R E S E A R C H
Open Access
Progress towards malaria control targets in
relation to national malaria programme funding
Eline L Korenromp
1,2*, Mehran Hosseini
2, Robert D Newman
3and Richard E Cibulskis
3Abstract
Background:Malaria control has been dramatically scaled up the past decade, mainly thanks to increasing international donor financing since 2003. This study assessed progress up to 2010 towards global malaria impact targets, in relation to Global Fund, other donor and domestic malaria programme financing over 2003 to 2009. Methods:Assessments used domestic malaria financing reported by national programmes, and Global Fund/OECD data on donor financing for 90 endemic low- and middle-income countries, WHO estimates of households owning one or more insecticide-treated mosquito net (ITN) for countries in sub-Saharan Africa, and WHO-estimated malaria case incidence and deaths in countries outside sub-Saharan Africa.
Results:Global Fund and other donor funding is concentrated in a subset of the highest endemic African countries. Outside Africa, donor funding is concentrated in those countries with highest malaria mortality and case incidence rates over the years 2000 to 2003. ITN coverage in 2010 in Africa, and declines in case and death rates per person at risk over 2004 to 2010 outside Africa, were greatest in countries with highest donor funding per person at risk, and smallest in countries with lowest donor malaria funding per person at risk. Outside Africa, all-source malaria programme funding over 2003 to 2009 per case averted ($56-5,749) or per death averted ($58,000-3,900,000) over 2004 to 2010 tended to be lower (more favourable) in countries with higher donor malaria funding per person at risk.
Conclusions:Increases in malaria programme funding are associated with accelerated progress towards malaria control targets. Associations between programme funding per person at risk and ITN coverage increases and declines in case and death rates suggest opportunities to maximize the impact of donor funding, by strategic re-allocation to countries with highest continued need.
Keywords:Malaria/mortality, Malaria/prevention and control, Child health, Programme impact, Financing, Health resources, Investments, Millennium Development Goals, Resource-poor countries
Background
With support from development partners, low- and middle-income countries have intensified efforts to meet intervention coverage and impact targets of the Millen-nium Development Goals (MDGs) [1], the World Health Assembly (WHA) and the Roll Back Malaria (RBM) Partnership [2] (Table 1). International funding for ma-laria control increased from US$149 million in 2000 to approximately US$1.66 billion in 2011 [3,4]. The Global
Fund has been a major contributor to this scale-up, covering an estimated 40% of international assistance for malaria from 2003 to 2008, and 63% of international malaria funding in the year 2010 alone [3,5]. Between 2002 and 2011, Global Fund-supported malaria pro-grammes delivered 230 million insecticide-treated nets (ITNs) and 230 million malaria treatments across 84 low- and middle-income countries [5,6]. This external funding is complemented by the United States President’s Malaria Initiative (PMI), which, since 2005, has been a significant donor for malaria control programmes in 19 countries in Africa and the Greater Mekong sub-region in Asia.
* Correspondence:[email protected] 1
Department of Public Health, Erasmus MC, University Medical Center Rotterdam, Rotterdam, The Netherlands
2
The Global Fund to Fight AIDS, Tuberculosis and Malaria, Geneva, Switzerland
Full list of author information is available at the end of the article
As a consequence of increased coverage with ITNs and artemisinin-based combination therapy (ACT), a growing number of countries have reported decreasing numbers of confirmed malaria cases and/or malaria-attributed hospital admissions and deaths since 2000; globally, malaria mortality has fallen by an estimated 25% [3,7].
RBM and WHO estimate the financing need for effect-ive malaria control to exceed US$5 billion every year through 2015; yet even at its 2011 peak, global funding available for malaria remained far below this need, with international disbursement totalling US$2 billion and domestic financing a lower amount [3,8,9]. To allocate available funding effectively and maximize the impact of investments, it is critical to understand how and where funding is advancing programme success in terms of population coverage achieved as well as health im-pact [3,9].
This study compares changes in the proportion of households owning at least one ITN (for sub-Saharan Africa countries) and in malaria cases and deaths (for
countries outside Africa) with levels of malaria
programme funding (from the Global Fund, other donors and domestic governments) available to low- and middle-income countries over the period 2003 to 2010. Findings are discussed with a view towards informing donor investment strategies and allocation policies.
Methods
Malaria programme financing
Malaria programme funding in each endemic country was expressed as the cumulative funding between 2003 (the first year of Global Fund malaria disbursements) and December 2009, in current US dollars. To assess the effects of funding on progress with malaria control, given that available estimates on malaria cases and deaths extended to 2010, analysis of funding data was capped at December 2009, assuming a typical lag of one year to in-country spending, programme implementation [10] and ensuing impact on reducing malaria cases and deaths.
Allocations from the Global Fund were taken as dis-bursements through malaria grants [5,11]. Other-donor gross disbursements included those from the USA Presi-dent’s Malaria Initiative [12], World Bank [13], and other bilateral and multilateral donors as reported through the Organization for Economic Cooperation and Develop-ment (OECD) DevelopDevelop-ment Assistance Committee
(DAC)’s Creditor Reporting System [14]. Domestic
fi-nancing data was taken from reports by National Ma-laria Control Programmes to WHO through the annual World Malaria Report questionnaire [3]. Government funding is expressed as programme expenditures, or as budgets when a programme had not reported govern-ment expenditures [15].
Total country funding was converted into funding
per-capita using national population sizes [16], and into funding per person at risk using WHO estimates of na-tional populations at risk [3]. For analyses, countries were stratified into three groups, according to their level of funding from all donors (Global Fund and other donors combined) cumulated over 2003 to 2009 per per-son at risk (Additional file 1). All-donor funding was chosen as the criterion for country stratification, because donor funding has increased relatively more than do-mestic government funding over the period 2003 to 2009, and is more likely to be allocated to commodities and other variable costs of malaria programmes, as opposed to the more stable cost of human resources, which is usually covered by national governments.
Insecticide-treated bed net coverage estimates
[image:2.595.57.290.118.374.2]ITN coverage was assessed as the proportion of house-holds that own one or more ITNs, estimated every year by WHO and partners, for 41 malaria-endemic, low-and middle-income countries in sub-Saharan Africa over the years 2003 to 2010 [3]. The coverage estimation is based on data from nationally representative household surveys (Demographic and Health Surveys, Multiple In-dicator Cluster Surveys and Malaria InIn-dicator Surveys), manufacturer reports of ITN procurement and National Malaria Programme reports of ITN distribution [17]. Table 1 Malaria targets in the Millennium Development
Goals and of the World Health Assembly and Roll Back Malaria Partnership
MDG 6−Combat HIV/AIDS, malaria and other diseases [1]:
• Target 6c: By 2015, have halted and begun to reverse the incidence of malaria and other major diseases
• Indicator 6.6: Incidence and death rates associated with malaria • Indicator 6.7: Proportion of children under-five sleeping under an
insecticide-treated bed net
MDG 4−Reduce child mortality [1]:
• Target 4a: Reduce by two-thirds, between 1990 and 2015, the under-five mortality rate.
World Health Assembly [43]:
• Reduce malaria cases by 75% from 2000 to 2015 • Reduce malaria-related deaths by 75% from 2000 to 2015. Roll Back Malaria Partnership, June 2011 [2,3]:
• Objective 1: Near-zero malaria deaths by 2015.
• Objective 2: Reduce malaria cases by 75%, from 2000 to 2015. • Objective 3: Eliminate malaria by 2015 in 10 new countries and in the
WHO European Region.
• Target 2.2 Sustain universal access to and utilization of prevention measures: By 2015 and beyond, all countries sustain universal access to and utilization of an appropriate package of preventive
interventions.
Coverage estimates refer to each country’s population at risk of malaria transmission, assuming that in countries with <100% of the national population living at malaria risk, all available ITNs are owned by households in ma-larious areas [17]. ITN coverage estimates for national population at risk were not available for countries out-side sub-Saharan Africa, where malaria transmission is often focused in certain regions, so that national surveys do not give a meaningful indication of the level of pro-tection in populations actually living in areas with ma-laria transmission.
Malaria case and death estimates
Assessments focus on 49 malaria-endemic, low- and middle-income countries outside sub-Saharan Africa, after exclusion of Turkey, Paraguay and Kyrgyzstan, with income levels taken from the World Bank income classi-fication of 2005 [18]. All of these 49 countries were eli-gible for Global Fund malaria support up to 2010. Turkey, Paraguay and Kyrgyzstan were excluded because they had very few cases throughout the 2000s and small populations at risk, resulting in extremely high levels of funding per person at risk that would have distorted analyses.
WHO’s case estimates for these countries were based
on numbers of reported, parasitologically confirmed malaria cases from national health information systems (HIS), adjusted for reporting completeness, the propor-tion of suspected malaria cases that are parasite-positive,
the proportion of confirmed cases due to each
Plasmo-diumspecies, and the extent to which patients use
pub-lic sector health facilities [3,15,19,20]. Death estimates
were derived by multiplying the number ofPlasmodium
falciparum malaria cases estimated for each country by a fixed case fatality rate [3,20]. Case and death estimates were evaluated over the period 2004 to 2010.
For most countries in sub-Saharan Africa, the overall quality of surveillance data did not allow a convincing estimate of total cases to be made from reported cases [3]. For these countries, numbers of cases and deaths are estimated using an epidemiological model in which the trend in each country over time is a function of that
country’s increase in household ITN coverage [3]. The
dependence of these case and death trend estimates on national ITN coverage trends, itself already considered as progress outcome earlier in the current analysis, pre-cluded an independent assessment of case and death trends in relation to programme funding for the sub-Saharan African countries.
Malaria funding per case or death averted
Malaria funding allocated (cumulated over 2003–2009)
was computed per case or death averted over 2004–
2010 for each of the 49 countries outside sub-Saharan
Africa. Each country’s time trend in case or death rates
over 2004–2010 was estimated in a linear regression,
and the predicted value for each of these years compared
with case and death rates over 2000–2003 as the
base-line, while adjusting for annual population growth. The four-year period 2000 to 2003 (rather than 2003 or 2004 alone) served as the baseline period, because in low-endemic countries outside Africa, ongoing malaria fund-ing serves not only to reduce case and death burden to below 2004 levels, but in the first place to prevent a re-surgence to even much higher case and death rates (as seen in 2000 and in the decades before) that would likely reappear if the control stopped.
Country-level programme funding per case or death averted were then summarized for three country groups (tertiles) as the median and interquartile range across the 16 or 17 countries in each group.
Results
Malaria financing
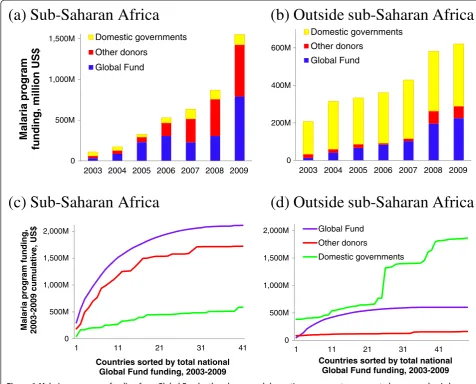
Total malaria programme funding in the 90 countries increased from US$317 million in 2003 to US$2.2 billion in 2009. The Global Fund, other donors and domestic governments accounted for 47%, 32% and 21%, respect-ively in 2009 (Figure 1a and b). From 2003 to 2009, Glo-bal Fund malaria funding increased 21-fold, other-donor malaria funding increased 14-fold, and domestic govern-ment funding increased two-fold. Among non-Global Fund donors, in 2009 the USA Presidential Malaria Ini-tiative contributed around 60% of malaria disbursements in 2009, the World Bank 7%, and the United Kingdom direct bilateral funding through the Department for International Development 6%.
Over 2003 to 2009, funding from all sources combined increased from US$110 million to US$1.55 billion in sub-Saharan Africa (Figure 1a), and from US$207 mil-lion to US$620 milmil-lion outside Africa (Figure 1b). Within sub-Saharan Africa, malaria funding from the Global Fund and other donors was concentrated in a common subset of countries, with half of total Global Fund funding going to only nine countries, and half of other-donor funding going to the same nine countries (Figure 1c). These nine countries were all in east and west Africa (Additional file 1), with stable high rates of malaria case incidence and mortality.
Domestic government funding, in contrast, was con-centrated in countries of lower endemicity, with lower case and death rates, in the Americas, Caribbean and Southeast Asia (Figure 1b & d and Additional file 1).
Among non-Africa countries, domestic funding
Insecticide-treated bed net coverage
ITN coverage in sub-Saharan Africa increased from 4% in 2003 to 63% in 2010 in the 14 countries with largest donor malaria funding per person at risk over 2003 to 2009, from 3% to 46% in the 14 countries with medium donor funding per person at risk, and from 2% to 36% in the 13 countries with lowest donor malaria funding per person at risk (Figure 2).
Malaria case and death declines, by level of donor funding
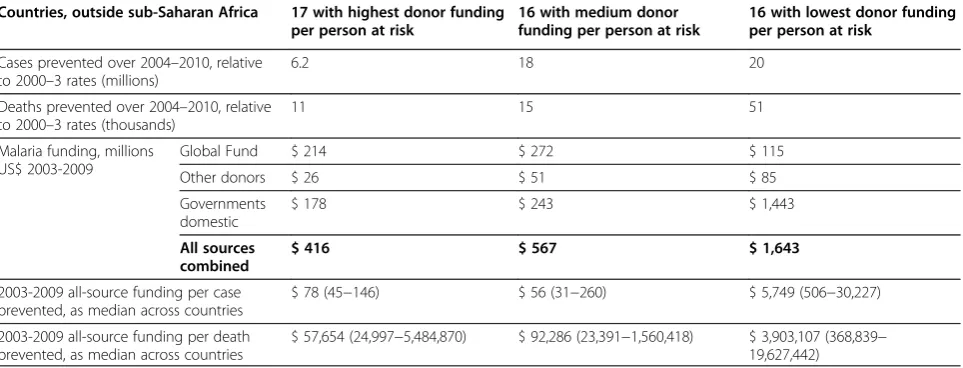
Among 49 countries outside sub-Saharan Africa, the 17 with highest donor malaria funding per person at risk had the highest rates of malaria cases and deaths over 2000–2003, and the largest subsequent declines in these
rates, both proportionally and as rate differences
com-pared to the 2000–2003 rates (Figure 3, red lines).
Among these 17 countries, overall time trends were driven by the countries with largest numbers of cases and deaths: Papua New Guinea, Cambodia, Sri Lanka, Laos and Timor Leste.
Among the 16 countries with an intermediate level of donor malaria funding per person at risk, an overall slight decline in case and death rates was driven by the relatively high-burden countries: Indonesia, Myanmar and Yemen, where case and death rates were stable; and Afghanistan and Bangladesh, where case and death rates declined (Figure 3, blue lines).
Among the 16 countries with lowest total donor ma-laria support per person at risk (Figure 3, green lines),
(a) Sub-Saharan Africa
(b) Outside sub-Saharan Africa
0 500M 1,000M 1,500M
2003 2004 2005 2006 2007 2008 2009
M
a
la
ri
a program
funding, million
US$
Domestic governments
Other donors
Global Fund
0 200M 400M 600M
2003 2004 2005 2006 2007 2008 2009 Domestic governments
Other donors Global Fund
(c) Sub-Saharan Africa
(d) Outside sub-Saharan Africa
0 500M 1,000M 1,500M 2,000M
1 11 21 31 41
Malaria program
funding,
2003-2009 cumulativ
e,
US$
Countries sorted by total national Global Fund funding, 2003-2009
0 500M 1,000M 1,500M 2,000M
1 11 21 31 41
Countries sorted by total national Global Fund funding, 2003-2009 Global Fund
Other donors
[image:4.595.56.533.90.474.2]Domestic governments
the overall case and death rate decline trends were dominated by India, which experienced a very slight de-cline. Among these countries, Pakistan showed a stable or fluctuating trend, whereas case and death rates declined in most Latin American countries including Brazil.
Malaria funding per case or death averted
Among countries outside sub-Saharan Africa, programme
funding from all sources summed over 2003–2009 per
case prevented over 2004–2010 was US$78 (interquartile range US$45−146) in the 17 countries with highest donor
funding per person at risk, US$56 (31−260) in the 16
countries with intermediate levels of donor funding per person at risk, and US$5,749 (506−30,227) in the 16 countries with lowest donor malaria support per person at risk (Table 2).
Per death prevented over 2004–2010, 2003–2009
funding averaged US$57,654 (24,997−5,484,870) in the
17 countries with highest donor funding per person at risk, US$92,286 (23,391−1,560,418) in the next 16 coun-tries, and US$3,903,107 (368,839−19,627,442) in the 16 countries with lowest donor malaria support per person at risk. The highest costs per death averted were esti-mated for countries with very few malaria deaths (Azer-baijan and Honduras in the highest-funding group;
0 20 40 60 80 100
Malaria cases per
1000 population
a
t
risk
17 countries with high donor funding pp at risk 16 countries with medium donor funding pp at risk 16 countries with low donor funding pp at risk
0.00 0.03 0.06 0.09 0.12
Malaria deaths per
1000 population
at risk
[image:5.595.62.540.89.278.2]17 countries with high donor funding pp at risk 16 countries with medium donor funding pp at risk 16 countries with low donor funding pp at risk
Figure 3Progress in reducing (a) malaria case incidence rate, and (b) malaria mortality rate from 2000 to 2010, by countries’malaria programme funding from all donors combined, over 2003 to 2009 [3]–among 49 malaria-endemic low- and middle income countries outside sub-Saharan Africa.
0% 20% 40% 60%
%
of
households
ow
ning I
T
N
14 countries with high donor malaria funding per person at risk
14 countries with medium donor malaria funding per person at risk
[image:5.595.63.538.510.695.2]13 countries with low donor malaria funding per person at risk
Democratic Republic of Korea, the Republic of Korea and Iraq in the medium-funding group; and Mexico and El Salvador in the lowest-funding group), or with an in-crease in malaria deaths (Timor-Leste and Venezuela in the highest-funding group; Indonesia in the medium-funding group, and Dominican Republic and Costa Rica in the lowest-funding group). The presented upper limits of the interquartile ranges (indicating the cost level that 75% of countries in a funding-level group are below), however illustrate the wide ranges in cost per death averted among all countries.
Discussion
The synthesis of malaria programme funding and control progress data from countries worldwide confirms that global malaria donor funding is generally well targeted to the countries with highest malaria transmission and case and death rates. Higher donor funding per person at risk was also associated with greater increases in household ITN ownership among African countries, confirming similar observations made earlier [10,15,17,21]. Outside Africa, increased donor funding was associated with larger proportional malaria case and death rate declines.
Outside Africa, all-source programme funding per case averted or death averted tended to be lower in the coun-tries with higher donor malaria support per person at risk (Table 2). These gradients illustrate an overall effect-ive targeting of global donor allocations to countries with highest return on malaria investments. Neverthe-less, there was large variation among countries within each group in programme funding per case or death averted, with overlapping ranges across the three tertiles of countries. Apparently, donor allocations partially coun-terbalance the enormous differences among countries in
levels of domestic funding per person at risk and per case or death averted (Figure 1c and d), but they do not com-pletely turn around the cross-country imbalances so as to maximize the possible health impact for available global funding.
The presented‘costs’per case or death averted should not be considered as cost-effectiveness ratios, which are typically lower (more favourable) [22,23], for three
rea-sons. First, case/death levels averaged over year
2000−2003 served as the baseline against which cases
and deaths averted were calculated; however, in reality, case and death rates in the non-African countries eva-luated might well resurge to above 2000−2003 levels if
malaria programme funding and control stopped
altogether. Second, the time horizon for cases and deaths averted was limited to 2010, without including
additional impact achieved over 2011–2012 from the –
comparatively large – programme spending in 2009–
2010. Third, total funding on all malaria services included case management and programme administra-tion, rather than just the cost of any single intervention.
[image:6.595.58.540.112.296.2]Although donor malaria funding is generally well tar-geted to the highest-need countries with lowest ITN coverage and highest case and death rates at baseline, there remain exceptions. As noted before [10,24-26], donor funding per person at risk was very high in some small countries of relatively low malaria burden and high income, including Bhutan, Comoros, Laos, Suriname, and in Africa Sao Tome and Principe and Equatorial Guinea (both excluded from analyses), Gabon, Namibia and Swaziland. In contrast, Burkina Faso, the Demo-cratic Republic of Congo, Mali, Cote d’Ivoire and Nigeria had surprisingly low donor malaria funding relative to their populations at risk.
Table 2 Estimated cases and deaths prevented over 2004–2010 (relative to 2000–2003 baseline) per dollar total malaria programme funding over 2003–2009, 49 countries outside sub-Saharan Africa
Countries, outside sub-Saharan Africa 17 with highest donor funding per person at risk
16 with medium donor funding per person at risk
16 with lowest donor funding per person at risk
Cases prevented over 2004–2010, relative to 2000–3 rates (millions)
6.2 18 20
Deaths prevented over 2004–2010, relative to 2000–3 rates (thousands)
11 15 51
Malaria funding, millions US$ 2003-2009
Global Fund $ 214 $ 272 $ 115
Other donors $ 26 $ 51 $ 85
Governments domestic
$ 178 $ 243 $ 1,443
All sources combined
$ 416 $ 567 $ 1,643
2003-2009 all-source funding per case prevented, as median across countries
$ 78 (45−146) $ 56 (31−260) $ 5,749 (506−30,227)
2003-2009 all-source funding per death prevented, as median across countries
$ 57,654 (24,997−5,484,870) $ 92,286 (23,391−1,560,418) $ 3,903,107 (368,839− 19,627,442)
A full mapping of malaria funding needs and gaps was beyond the scope of the current study, and would have to consider not only actual programme allocations but also countries’ domestic funding capacity. In addition, economies of scale will tend to lower costs per person reached in large-scale, nation-wide programmes in the highest-endemic countries, compared to settings with only focal malaria that require more expensive pre-elimination and pre-elimination strategies [27]. Also, effect-ive progress in control does not necessarily mean that impact would be sustained after lowering the inputs–as experiences with malaria resurgence in Sri Lanka, Mada-gascar and other countries have shown. According to WHO estimates, overall global funding for malaria con-trol falls short of the global need [3,8,9], and increasing overall malaria funding is equally important as optimiz-ing fundoptimiz-ing allocations. Nevertheless, the large variation in funding per person at risk (Additional file 1) and the only moderately strong association between funding per case or death averted and level of national donor fund-ing per person at risk (Table 2) suggest a scope for fur-ther enhancing value for money in international malaria financing, through more strategic allocation of available funding toward the highest-endemic countries with the highest continued need.
In 2011, the Global Fund revised its eligibility, prioritization and counterpart financing policy. From 2012 onwards all supported countries are required to make a minimum domestic government co-funding con-tribution, of a proportion increasing with country in-come and with the years of each grant [28,29]. The increased counterpart financing requirement on upper-middle income countries should result in a gradual shift of portfolio allocations toward lower-income countries. This policy change therefore has the potential to facili-tate better targeting of Global Fund funding to benefit countries with the highest continuing need, an approach also emphasized in the Global Fund’s 2012–2016 Stra-tegy‘Investing for impact’[30].
Limitations
Uncertainties and potential inaccuracies in country ITN coverage and case and death trend estimates [20,21,31] limited the power to assess associations between funding and health impact. The methods for producing estimates of cases and deaths outside of Africa adjust the number of reported cases to take into account the proportion of cases that are not captured by a surveillance system. While helping to make numbers more comparable be-tween countries, and filling gaps where data are missing, the estimates rely on relationships between variables that are uncertain, and draw upon data that may have been imprecisely measured, or measured in previous years and projected forward. Thus estimates of the number of
malaria cases or deaths are accompanied by a large de-gree of uncertainty, and inferences concerning trends are less certain than those made directly from good quality surveillance data. In particular, the number of malaria deaths is estimated by using a fixed case fatality rate which does not take into account varying access to treatment. For sub-Saharan Africa, lack of data on ma-laria cases and deaths narrowed the analysis to
house-hold ownership of ITNs. Although a reasonable
predictor of ITN usage [32,33] and associated reductions in under-five mortality, malaria parasitaemia and anae-mia [34-36], ownership of one or more ITNs is not a precise indicator of the extent to which universal protec-tion for all household members is achieved.
A further limitation is incompleteness and varying quality of data on domestic government financing. Of the 90 malaria-endemic countries analysed, eight did not report domestic malaria funding to WHO for any of the years 2003 to 2009, and 25 countries did not report do-mestic funding in 2009. Under-reporting is plausible notably for domestic spending on malaria case manage-ment, which is typically not allocated specifically to the malaria programme but rather absorbed within districts’ overall health budgets. While donor funding is some-times allocated predominantly to commodity needs of malaria programmes [10,15,21], domestic contributions may more often concern the infrastructure, staff and programme management [3]. A recent assessment of global malaria funding over 2006 to 2010 found similar annual funding levels as this study for the Global Fund and other donors, but slightly higher domestic funding– the latter based on government budgets reported by grant recipients to the Global Fund, as opposed to the programme expenditures reported to WHO used here [26].
Because of these imperfections in both national fund-ing and health outcome data, this study assessed their relationship only across groups of countries, and not at the level of individual countries. Importantly, whether in country groups or at the level of individual countries,
strategic planning capacity. Re-allocating funding to such countries may not necessarily yield equally high returns on investment as observed in other countries.
Finally, the study did not consider allocative and tech-nical efficiency in malaria programmes as determinants of progress in control. In reality, not only the funding amount, but also the appropriateness of its allocation across prevention, diagnosis and treatment services, and the−varying−efficiency in delivering these services [37] will influence the relations between funding and health outcome.
To refine these analyses will require improving country-level case and death trend estimates, based on
the WHO’s new guidelines for scaling-up malaria
diag-nosis [38] and for malaria surveillance [39,40], and the ongoing roll-out of parasitological diagnosis notably in African countries [41]. On the financing tracking side, new standards are needed for reporting of national ma-laria programme financing, to improve quality, transpa-rency, and completeness [42].
Conclusion
In conclusion, malaria programme financing from the Global Fund and other sources is associated with increased ITN coverage scale-up, a key determinant of malaria burden declines in Africa, and with larger pro-portional case and death rate declines among countries outside Africa. Achieving MDG6, WHA [43] and RBM targets globally will require accelerated case and death declines, through intensified scale-up of ITN distribution and other key prevention and treatment services. Outside Africa, programme funding per case or death prevented outside Africa tended to be lower in the coun-tries that received higher donor funding per person at risk. The associations shown between funding and impact and the large variations in funding per person at risk suggest opportunities to advance malaria control and maximize the impact by increasing programme funding and strategically allocating available donor funds to countries with the highest continued need.
Additional file
Additional file 1:Country data: all-donor and domestic funding national totals and funding per person at risk, estimated malaria cases and deaths rates in 2008 for countries outside sub-Saharan Africa, and population living in households owning≥one ITN in
sub-Saharan African countries in 2008.Countries sorted by level of all-donor funding per person at risk, separately within sub-Saharan Africa and outside sub-Saharan Africa.
Competing interests
The authors’views do not necessarily represent the decisions, policy or views of Erasmus MC/University Medical Center Rotterdam, the Global Fund to Fight AIDS, Tuberculosis and Malaria, or the World Health Organization. The authors declare that they have no competing interests.
Authors’contributions
ELK and RC conceived and designed the study; MH and ELK implemented analyses; ELK, RC and RN drafted the manuscript; all authors contributed to results interpretation and writing of the final manuscript. All authors read and approved the final manuscript.
Acknowledgements
We thank Dr Brian Williams (SACEMA) for statistical advice, and Dr George Korah (Global Fund) for advise on interpreting National Malaria Program finance data.
Author details
1Department of Public Health, Erasmus MC, University Medical Center Rotterdam, Rotterdam, The Netherlands.2The Global Fund to Fight AIDS, Tuberculosis and Malaria, Geneva, Switzerland.3Global Malaria Programme, World Health Organization, Geneva, Switzerland.
Received: 23 September 2012 Accepted: 20 December 2012 Published: 14 January 2013
References
1. United Nations Department of Economic and Social Affairs:The Millennium Development Goals Report 2011. New York City: United Nations; 2011. 2. Roll Back Malaria partnership:Refined/updated GMAP Objectives, Targets,
Milestones and Priorities Beyond 2011–as agreed upon by the RBM Board on 12 June 2011, based on the recommendations of the RBM Task Force on Priorities and Targets Beyond 2011. Geneva: Roll Back Malaria partnership; 2011.
3. World Health Organization:World Malaria Report 2011. Geneva: World Health Organization; 2011.
4. World Health Organization:World Malaria Report 2012. Geneva: World Health Organization; 2012.
5. The Global Fund to Fight AIDS Tuberculosis and Malaria:The Global Fund Results report 2011: Making a difference. Geneva: The Global Fund to Fight AIDS Tuberculosis and Malaria; 2011.
6. The Global Fund to fight AIDS Tuberculosis and Malaria:Global Fund-supported programs see strong results amid funding challenges [press release]. Geneva: The Global Fund to Fight AIDS Tuberculosis and Malaria; 2011.
7. Steketee RW, Campbell CC:Impact of national malaria control scale-up programmes in Africa: magnitude and attribution of effects.Malar J2010,
9:299.
8. Kiszewski A, Johns B, Schapira A, Delacollette C, Crowell V, Tan-Torres T, Ameneshewa B, Teklehaimanot A, Nafo-Traore F:Estimated global resources needed to attain international malaria control goals.Bull World Health Organ2007,85:623–630.
9. Roll Back Malaria partnership:Global malaria action plan for a malaria-free world. Geneva: Roll Back Malaria partnership; 2008.
10. Roll Back Malaria, UNICEF, World Health Organization, PATH:Malaria funding and resource utilization: the first decade of Roll Back Malaria. vol. 10. Geneva: Roll Back Malaria partnership; 2010.
11. The Global Fund to fight AIDS Tuberculosis and Malaria:Approved Grant Amounts and Disbursements: Disbursements in detail, Commitments and disbursements–summary. 2012.
12. United States President's Malaria Initiative:Malaria Operational Plans. 2011. 13. Worldbank:Data catalog. 2010.
14. Organisation for Economic Co-operation and Development:Development Assistance Committee (DAC)'s Creditor Reporting System. Paris: Organisation for Economic Co-operation and Development; 2011.
15. World Health Organization:World Malaria Report 2010. Geneva: World Health Organization; 2010.
16. United Nations Dept. of Economic and Social Affairs, population division; population estimates; and projections section:World population prospects -the 2010 revision population database. New York: United Nations Population Division; 2012.
18. Worldbank:GNI per capita, PPP (current international $)–World Bank, International Comparison Program database. 2012.
19. World Health Organization, UNICEF:World Malaria Report 2008. Geneva: World Health Organization; 2008.
20. Cibulskis R, Aregawi M, Williams R, Otten O, Dye C:Worldwide incidence of malaria in 2009: estimates, time trends, and a critique of methods.PLoS Med2011,8:e1001142.
21. World Health Organization:World Malaria Report 2009. Geneva: World Health Organization; 2009.
22. Eisele T, Larsen DA, Walker N, Cibulskis R, Yukich JO, Zikusooka CM, Steketee RW:Estimates of child deaths prevented from malaria prevention scale-up in Africa 2001–2010.Malar J2012,93:93.
23. Morel CM, Lauer JA, Evans DB:Cost effectiveness analysis of strategies to combat malaria in developing countries.BMJ2005,331:1299.
24. Institute for Health Metrics and Evaluation:Financing global health 2010: development assistance and country spending in economic uncertainty. Seattle, WA: University of Washington; 2010.
25. Snow RW, Okiro EA, Gething PW, Atun R, Hay SI:Equity and adequacy of international donor assistance for global malaria control: an analysis of populations at risk and external funding commitments.Lancet2010,
376:1409–1416.
26. Pigott DM, Atun R, Moyes CL, Hay SI, Gething PW:Funding for malaria control 2006–2010: a comprehensive assessment.Malar J2012,
11:246.
27. Sabot O, Cohen JM, Hsiang MS, Kahn JG, Basu S, Tang L, Zheng B, Gao Q, Zou L, Tatarsky A, Aboobakar S, Usas J, Barrett S, Cohen JL, Jamison DT, Feachem RG:Costs and financial feasibility of malaria elimination.Lancet
2010,376:1604–1615.
28. The Global Fund to Fight AIDS Tuberculosis and Malaria:Policy on eligibility criteria, counterpart financing requirements, and prioritization of proposals for funding from the Global Fund. Geneva: Global Fund Twenty-Third Board Meeting; 2011.
29. The Global Fund to fight AIDS Tuberculosis and Malaria:Decision Points of the Twenty-Fifth Board Meeting Accra, Ghana, 21–22 November 2011– Decision Point GF/B25/DP16: Modification of Grant Renewals and Transition to New Funding. Accra: The Global Fund to fight AIDS Tuberculosis and Malaria; 2011.
30. The Global Fund to fight AIDS Tuberculosis and Malaria:The Global Fund Strategy 2012–2016: Investing for Impact. Geneva: The Global Fund to fight AIDS Tuberculosis and Malaria; 2011.
31. Lynch M, Korenromp EL, Eisele T, Newby H, Steketee R, Kachur P, Nahlen B, Yoon S, MacArthur J, Newman R, Cibulskis R:New global estimates of malaria deaths.Lancet2012,380:559.
32. Korenromp EL, Miller J, Cibulskis RE, Cham MK, Alnwick D, Dye C:
Monitoring mosquito net coverage for malaria control in Africa: possession versus use by children under 5 years.Trop Med Int Health
2003,8:693–703.
33. Miller JM, Korenromp EL, Nahlen BL, Steketee RW:Estimating the number of insecticide-treated nets required by African households to reach continent-wide malaria coverage targets.JAMA2007,297:2241–2250. 34. Eisele TP, Larsen D, Steketee R:Protective efficacy of interventions for preventing malaria mortality in children inPlasmodium falciparum endemic areas / Modeling the impact of scaling up interventions for malaria.Int J Epid2010,39:i88–i101.
35. Lim SS, Fullman N, Stokes A, Ravishankar N, Masiye F, Murray CJ, Gakidou E:
Net benefits: a multicountry analysis of observational data examining associations between insecticide-treated mosquito nets and health outcomes.PLoS Med2011,8:e1001091.
36. Korenromp EL:Lives saved from malaria prevention in Africa–evidence to sustain cost-effective gains.Malar J2012,11:94.
37. White MT, Conteh L, Cibulskis R, Ghani AC:Costs and cost-effectiveness of malaria control interventions - a systematic review.Malar J2011,10:337. 38. World Health Organization:Universal access to malaria diagnostic testing: an
operational manual. Geneva: World Health Organization; 2011:160. 39. World Health Organization:Disease surveillance for malaria control–an
operational manual. Geneva: World Health Organization; 2012.
40. World Health Organization:Disease surveillance for malaria elimination–an operational manual. Geneva: World Health Organization; 2012.
41. Zhao J, Lama M, Korenromp EL, Aylward P, Shargie E, Filler S, Komatsu R, Atun R:Adoption of rapid diagnostic tests for the diagnosis of malaria, a
preliminary analysis of the Global Fund program data, 2005 to 2010. PLoS Med2012,7:e43549.
42. Lu C, Schneider MT, Gubbins P, Leach-Kemon K, Jamison D, Murray CJ:
Public financing of health in developing countries: a cross-national systematic analysis.Lancet2010,375:1375–1387.
43. World Health Organization:Resolution WHA58.2. Malaria control. In Fifty-eighth World Health Assembly, Geneva, 16–25 May 2005 Volume 1 Resolutions and decisions, and list of participants, WHA58/2005/REC/1. Geneva: World Health Organization; 2005:4–7.
doi:10.1186/1475-2875-12-18
Cite this article as:Korenrompet al.:Progress towards malaria control targets in relation to national malaria programme funding.Malaria Journal201312:18.
Submit your next manuscript to BioMed Central and take full advantage of:
• Convenient online submission
• Thorough peer review
• No space constraints or color figure charges
• Immediate publication on acceptance
• Inclusion in PubMed, CAS, Scopus and Google Scholar
• Research which is freely available for redistribution

![Figure 2 Progress toward target of universal coverage with ITNs (operationalized as 100% of households owning ≥one ITN [3]) among41 malaria-endemic low- and middle-income countries in sub-Saharan Africa, up to 2010, according to the level of countries’ malariaprogramme funding from donors per person at risk over 2003 to 2009.](https://thumb-us.123doks.com/thumbv2/123dok_us/8337459.304359/5.595.63.538.510.695/progress-universal-operationalized-households-countries-according-countries-malariaprogramme.webp)
![Diagnosing plant diseases: what do we ask and why do we ask for it? [Online community]](data:image/gif;base64,R0lGODlhAQABAIAAAP///wAAACH5BAEAAAAALAAAAAABAAEAAAICRAEAOw==)