RESEARCH
Development and validation of a rapid
assessment tool for malaria prevention
Judith Nekesa Mangeni
1*, Diana Menya
1, Andrew Obala
1, Alyssa Platt
2and Wendy Prudhomme O’Meara
2,3,4Abstract
Background: Insecticide-treated bed nets (ITN) have been shown to be efficacious in reducing malaria morbidity and mortality in many regions. Unfortunately in some areas, malaria has persisted despite the scale up of ITNs. Recent reports indicate that human behaviour and mosquito behaviour are potential threats to the efficacy of ITNs. However, these concerns are likely highly heterogeneous even at very small scales. This study aimed at developing, testing and validating a rapid assessment tool to collect actionable information at local levels for a quick evaluation of potential barriers to malaria prevention.
Methods: The study was conducted at the Webuye Health and Demographic Surveillance Site in Bungoma East Sub-County, Kenya. Based on the findings from the case–control study, 12 primary surveillance components that encompass the major impediments to successful prevention were identified and used to develop a rapid assessment tool. Twenty community health volunteers were trained to identify patients with laboratory-confirmed malaria in six peripheral health facilities located within six sub locations and subsequently followed them up to their homes to conduct a rapid assessment. Sampling and analysis of the results of the survey are based on Lot Quality Assurance. Results: The tool was able to detect local heterogeneity in bed net coverage, bed net use and larval site abundance in the six health facility catchment areas. Nearly all the catchment areas met the action threshold for incomplete household coverage (i.e. not all household members not using a net the previous night) except the peri-urban area. Although the threshold for nets not in good condition was set very high (≥50%), only two catchment areas failed to meet the action threshold. On the indicator for “Net not used every day last week”, half of the areas failed, while for net ownership, only two areas met the action threshold.
Conclusion: The rapid assessment tool was able to detect marked heterogeneity in key indicators for malaria preven-tion between patients attending health facilities, and can distinguish between priority areas for intervenpreven-tion. There is need to validate it for use in other contexts.
Keywords: Lot Quality Assurance (LQA), Rapid assessment, Problems, Barriers, Malaria prevention
© The Author(s) 2016. This article is distributed under the terms of the Creative Commons Attribution 4.0 International License (http://creativecommons.org/licenses/by/4.0/), which permits unrestricted use, distribution, and reproduction in any medium, provided you give appropriate credit to the original author(s) and the source, provide a link to the Creative Commons license, and indicate if changes were made. The Creative Commons Public Domain Dedication waiver (http://creativecommons.org/ publicdomain/zero/1.0/) applies to the data made available in this article, unless otherwise stated.
Background
Insecticide-treated bed nets (ITN) have been shown to be efficacious for reducing malaria morbidity and mortal-ity in controlled trials [1–3]. Therefore, the global health community has invested heavily in ITNs and they have been the cornerstone of global malaria control efforts. More than 400 million ITNs have been distributed in sub-Saharan Africa alone in the last few years [4, 5].
In many places, malaria has declined in response to such efforts [6–8], but success has not been uniform. In some places, malaria has persisted at high levels [9,
10], and in other places malaria has re-emerged after a period of successful control [11, 12]. Current reports have shown the potential threats to ITN efficacy, to include human behaviour [13, 14] and mosquito behav-iour [15–17]. However, these problems vary over time and place and are likely highly heterogeneous even at very small scales. There is a need for actionable informa-tion collected at local levels to quickly evaluate potential barriers to malaria prevention. Such information could
Open Access
*Correspondence: [email protected]
prompt tailored solutions such as improving adherence, targeted ITN distribution to specific groups, or breeding site remediation.
Using data from a detailed case–control study cou-pled with non-parametric variable selection techniques, a Rapid Assessment Tool was designed to capture infor-mation about problems with malaria prevention on a local scale through community health volunteers (CHV). Twenty CHVs were trained to identify patients with labo-ratory-confirmed malaria infection presenting to periph-eral health facilities and to conduct a rapid assessment using the Rapid Assessment Tool during home visits.
The tool was tested in a highly endemic area of west-ern Kenya where ITN coverage is high, but malaria morbidity persists at unacceptable levels. This study has demonstrated that such a tool can be implemented by CHVs, can identify marked heterogeneity in key indica-tors between neighboring villages, and can distinguish between priority areas for intervention. However, the tool may need refinements which allow it to be deployed using Lot Quality Assurance methodology.
Methods Study area
This study was conducted within the Webuye Health and Demographic Surveillance Site (HDSS), which is located in Webuye Division of Bungoma County, approximately 380 km west of Nairobi. The county borders the Repub-lic of Uganda to the West and lies between latitude 0°25.3′
and 0°53.2′ North and longitude 34° 21.4 and 35° 4′ East of the Greenwich meridian. It covers a land area of 3032 km2 or a quarter of the former western province [18].
The main inhabitants of the County are the Luhya eth-nic group. Small-scale farming is the main economic activity with sugarcane as the main cash crop. More than 61% of the population lives below the poverty line and majority of the households do not have access to electric-ity or municipal water. Majorelectric-ity of those in the labour force are mainly engaged in agricultural production which provides 60% of all household incomes; 19% wage employment and 13% urban self-employment [18].
The Webuye HDSS covers approximately 130 km2
with an approximate population of 73,000 people in four administrative locations and six sub-locations. Malaria transmission is perennial with a seasonal peak follow-ing the rains in May–June. The area is served by Webuye County Hospital as the main referral hospital alongside 12 other peripheral health facilities-mainly health centers and dispensaries.
Development of the rapid assessment tool
Although malaria control measures have been scaled up in Bungoma East, malaria has not declined in proportion
to the magnitude of control efforts. In a recently pub-lished case control study, barriers to malaria control that contribute to the persistently high malaria infections in Bungoma East district were identified [19].
Briefly, the case control study measured the efficacy decay of malaria prevention strategies. The main out-come of interest was malaria infection, which indicates that there is a breakdown in prevention. A total of 442 children hospitalized with malaria at the Webuye County hospital were enrolled into the study. They were paired with age, time, village and gender-matched healthy con-trols in the same community. In addition, comprehen-sive household and neighborhood assessments including entomological surveillance were done.
Using bivariate recursive partitioning for variable selection
Variables for inclusion into the rapid assessment tool were selected using bivariate recursive partitioning on a comprehensive set of variables collected in the case control study. Random forests is a non-parametric approach to regression, prediction and variable selec-tion that is particularly well-suited to high dimensional data such as ours where the number of covariates from which to select is large relative to the number of observa-tions [20]. Individual regression trees are constructed via binary splits in numeric predictor variables. The dataset is split into subsets that are increasingly homogeneous with regard to the response variable to form a regres-sion “tree”. Splits are determined by selecting variables with the strongest relationship with the response vari-able. The process is repeated recursively until a stopping criterion is met. In this case, trees to have may not have nodes with fewer than seven observations. Classification and regression trees have been used in previous studies to rank predictors of malaria illness [21]. However, one conditional inference tree alone may be sensitive to the particular distribution of observations in a dataset lead-ing to overfittlead-ing of data, thus the methods of conditional inference trees are expanded by using ensemble methods to create unbiased predictions. First, random subsets of the original dataset are taken repeatedly and conditional inference trees are produced for each subset, in a process called bagging. This reduces the impact of overly influen-tial observations. Second, a subset of predictor variables is taken repeatedly so that conditional inference trees are grown on a subset of both observations and predictor variables.
was done using the party package in R [22]. The top ten predictor variables were selected for inclusion in the rapid assessment tool (variable importance >0.001).
Using lot quality assurance sample methodology
Sampling and analysis of the results of the rapid assess-ment are based on Lot Quality Assurance (LQA) meth-odology. LQA approach requires far fewer observations than traditional sampling approaches [23]. Instead of estimating a population parameter with a pre-specified precision, it tests a sample against a threshold value and determines within a certain confidence whether that sample falls below the critical threshold.
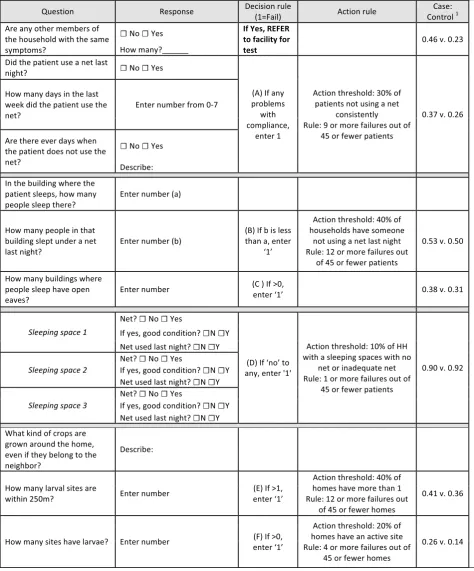
Action thresholds were set by comparing the val-ues of each indicator in the case and control groups. In other words, by comparing the average value of a specific indicator between households with a malaria case and households without a malaria case and choosing a cut-off between those values (Table 1, last column). Exact bino-mial probabilities for observing D* or fewer failures (f) given a true population prevalence (Pr) of X were calcu-lated for each action threshold X and a sample size of 45. The cutoff value of D* that gave a probability closest to 0.05 without exceeding 0.05 was chosen. In other words the value of D* that satisfies the following:
for example, the action threshold for percent of malaria patients who do not sleep under a net every night was set at 30%; if the percent of patients with net non-compliance is at least 30%, then compliance is determined to be a barrier to effective prevention. The value of D* which sat-isfies Eq 1 is 8 for Pr = 0.3 and sample size of 45. If more than 8 patients are found to be non-compliant in 45, then the null hypothesis of <30% noncompliance is rejected and it is assumed that the population has exceeded the action threshold. There is 95% certainty that the true pro-portion does not exceed the action threshold if the num-ber of cases does not exceed D* out of n.
Table 1 shows the estimated action threshold for each indicator, the critical values D*, and n required to test whether the population exceeds the action threshold with 95% confidence.
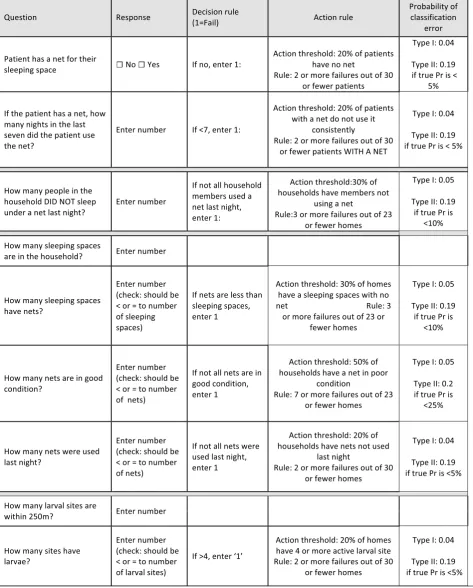
After piloting the tool, the indicators and action thresholds were revised. Instead of specifying a sample size of 45 houses, the n and the D* are allowed to vary but pairs of n and D* are identified that would keep the error of misclassifying as acceptable an indicator that exceeded the action threshold X to ≤0.05 (Type I error) and also allowed a maximum type II error (misclassifying an acceptable indicator as unacceptable) of 0.2 when the (1) P(f≤D∗|n=45, Pr≥X)≤0.05,
true prevalence was some lower pre-specified value of Y. In other words:
the revised n and D* for each indicator along with action thresholds, type I errors, and type II errors for misclas-sification if the true prevalence is Y are shown in Table 2.
Piloting and assessment of the tool
Training and use of the tool by community health volunteers
A total of 20 community health volunteers were trained to use the rapid assessment tool. The training was car-ried in two parts each consisting of 3–4 h over a period of 2 days. On the first day, community health volunteers were taken through all the items in the rapid assessment tool. The key areas in the training included; checking for other sick family members, identifying larval habitats, and confirming consistent usage of available bed nets. After the training, the CHVs were given an opportunity to do a simulation exercise to ensure the participants had grasped all the areas.
The community health volunteers were given an oppor-tunity to practice the tool the following day in areas that were nearby the Webuye peri-urban center. The research team then reviewed the questionnaires and noted sec-tions where the CHVs had problems. These were given more emphasis to ensure they completely grasped eve-rything. In general, the rapid assessment tool was easily understood and the CHVs administered it with minimal difficulty.
Data collection
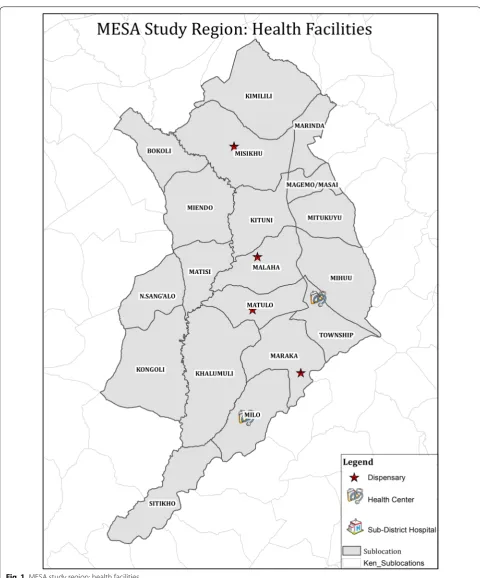
The purpose of the tool is to identify problems leading to malaria infection. Therefore, instead of recruiting a random community-based sample, individuals with con-firmed malaria infection reporting to the health facility were recruited. There were six peripheral health facili-ties that were eligible for the study. They had the capac-ity to perform parasitological confirmation of malaria infection by either microscopy or rapid diagnostic tests and they had CHVs linked to the facility. The six facili-ties were: Milo, Matulo and Webuye Health Centres, and Lurare, Mukhe and Kayaya Dispensaries, (Fig. 1). Patients with a confirmed malaria infection who were treated as outpatients and were older than one year were recruited consecutively from the laboratory and a CHV accompa-nied them home to complete the assessment using the tool. Each CHV completed 15 assessments for a total of 45 assessments per facility.
P
f ≤ D∗|n, Pr≥ X ≤ 0.05
P
Table 1 Tool for facility-based assessment of malaria prevention and risk
[image:4.595.57.532.101.673.2]Results
Developing the tool using bivariate recursive partitioning
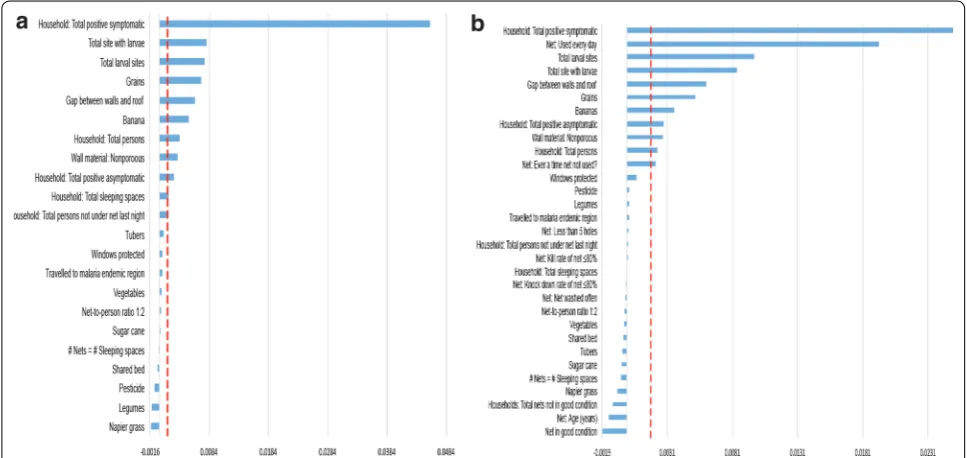
Random forest results are shown in Fig. 2a, b. The vari-ables are ranked in order of importance for (a) the total sample and (b) children who had a net for their sleeping space. For the total sample, selected variables are: total positive symptomatic household members, total larval sites, open eaves, total positive asymptomatic household members, non- porous walls, growing grains, growing banana, neighborhood bed net coverage, neighborhood population density, growing tubers, and total household size. For the subset of patients with nets, the same group of variables were selected from the BRP analysis except ‘growing tubers’ and ‘local bed net coverage’ were no longer above the threshold to be included. The only addi-tional variable was ‘net used every day’.
For this tool, only household indicators were selected and neighborhood variables were excluded. Nonporous walls were also excluded since this was highly corre-lated with open eaves. It was not feasible to test people for malaria during a rapid assessment, so the participant was asked whether other household members had similar symptoms as a proxy measure.
Selected variables were combined to create the rapid assessment tool. The action thresholds were set based on the difference between these indicators in the case and con-trol children (Table 1). Action thresholds for open eaves and crops grown were not defined since these would be dif-ficult to change, but were included in the tool in order to measure the local heterogeneity in these risk factors.
Piloting the rapid assessment tool
Six peripheral health facilities with capacity to diagnose malaria within the study area were identified and agreed to participate. The average Euclidean distance between facilities is 5.2 km (Fig. 1). 40–46 patients with con-firmed malaria infection were recruited from each facil-ity (n = 268) and were visited at home by CHVs using the
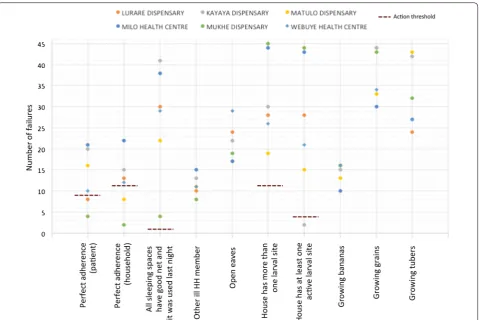
rapid assessment tool. Recruitment lasted between 1 and 3 weeks in each facility. Each indicator was scored as 0 (pass) or 1 (fail) for each household and the total ‘failures’ were tallied for each health facility. The total failures were compared against the LQA criteria. The number of failures for each indicator, action thresholds, and facilities identi-fied as exceeding action thresholds are shown in Fig. 3.
The tool was able to describe important heterogeneity between geographic areas in each of the indicators. ITN compliance by the patient ranged from 50 to 91%. Near Mukhe dispensary, more than 90% of patients and their households had perfect ITN coverage and adherence, but virtually all homes also had active larval sites nearby. By contrast, less than 5% of homes around Kayaya dis-pensary had active larval sites nearby, although house-hold ITN coverage and use was very low. Twenty-five percent of households reported another family member ill; the proportion was highest in Milo (32%) and low-est in Mukhe (17%). However, overall the LQA criteria appeared too high; the patient sample from every facil-ity met the action threshold for nearly every indicator. In other words, the tool identified every facility as exceeding the pre-defined action threshold for problems with ITN
[image:7.595.56.540.470.699.2]coverage, ITN use, ITN condition, and larval sites. The tool was better able to isolate areas where coverage was exceptionally good.
Revising the tool
Based on the results, the tool, sample size, and the action thresholds were revised (Table 2). Importantly, net own-ership was separated from net use instead of combining them in the patient compliance indicator. Net condition was also separated from net ownership and net use for each sleeping space. In addition, the minimum sample size and value of D* was identified to achieve a type I error of ≤0.05 (probability of misclassifying a poor per-forming area as not exceeding the action threshold) and type II error of ≤20% (probability of misclassifying a high performing area as a poor performing area). Type I and II errors are listed in Table 2.
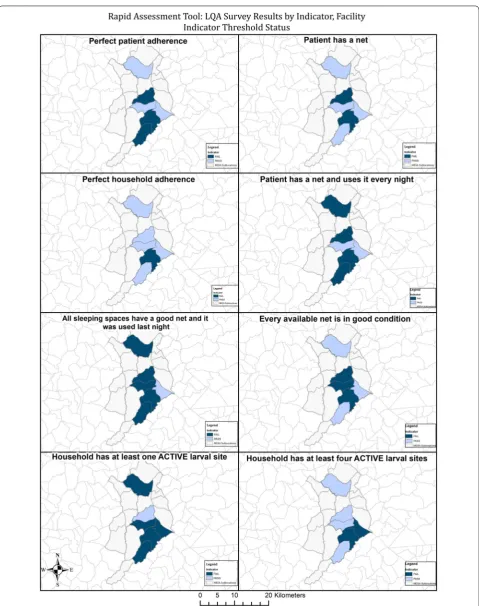
The data from the 268 patients was then re-analysed based on the new indicators and thresholds. The first 23–30 patients interviewed from each health facil-ity were chronologically identified and this was used
as the new sample. The modified approach helped to distinguish between areas where the ‘lot’ of patients did not fail for net ownership, but did fail for net use and vice versa, as well as those facilities which failed for net coverage but available nets were in good tion versus higher coverage but ‘failed’ for net condi-tion (Fig. 4).
The revised tool was able to detect heterogeneity in net ownership, net use, and net condition across the six health facility patient populations. All the six groups met the action threshold for fewer nets than sleeping spaces. Nearly all the groups met the action threshold for incomplete household coverage the previous night except the Webuye Health Cen-tre. Although the highest threshold was for nets not in good condition (≥50%), only two catchment areas (Milo and Webuye Township area) failed to meet the action threshold. On the indicator for “Net not used every day last week”, half of the facilities failed, while for net ownership, only Maraka and Milo met the action threshold (Fig. 4).
[image:8.595.60.540.86.406.2]Discussion
As malaria declines in response to control efforts, trans-mission is becoming more heterogeneous, populations are more susceptible to epidemics, and the need for local information is more acute.
An evidence-based rapid assessment tool that can be implemented at regular intervals (for example, in high transmission areas) or in response to local outbreaks (in low and epidemic prone areas) is presented. Of criti-cal importance, this tool can be deployed by community members with minimal training and little or no external resources.
The tool was designed to employ Lot Quality Assur-ance sampling which was originally developed for the manufacturing sector, but has been adopted by health programmes and in particular has been used extensively by immunization programmes [24]. Nation-wide survey data has been re-analysed using LQA methodology in order to identify areas with low and high ITN coverage [25]. These analyses have identified notable heterogene-ity at a subnational scale, but are only able to give infor-mation about the sampled clusters. Only one other study has explored the use of LQA surveys for local malaria surveillance [26]. The approach is much more similar to the way LQA surveys, which are used in polio campaigns to ensure immunization coverage targets are met within small zones in real time [27]. In addition, this study provides a major strength by its prospective nature. No other known studies have used LQA methodology pro-spectively to identify problems with malaria prevention within a group of diagnosed cases of malaria.
This survey focused on the area immediately surround-ing a health facility and used malaria-confirmed cases as the sample. Although this sample is not representa-tive of the entire village, it is representarepresenta-tive of people who contract malaria in that village. With a community-based sample areas with different levels of coverage or use could be identified, but it would not be possible to determine whether those differences were responsible for more malaria infection and morbidity. By recruiting con-firmed malaria infections, it is possible to link problems with prevention to actual malaria morbidity. In essence, patient populations are compared to see what problems give rise to malaria infections in different areas. Vari-ables were selected for the tool using a non-parametric method that sequentially divides the sample by covariates into groups with different outcomes. This approach was preferred over a regression approach because random forest methods do not assume a functional form or a dis-tribution for sample data. Whereas a regression model assumes additive relationships for predictor variables, a
regression tree allows for the possibility of any number of interactions between variables.
Although the tool was developed based on aggregated data from the entire study area, it was able to describe fine-scale heterogeneity in factors that contribute to persistent malaria burden. Communities less than 5 km apart showed distinct patterns—one community had nearly perfect ITN coverage and use but large numbers of larval sites whereas another had very few stagnant water bodies but also low ITN coverage.
The study has several limitations. The zones repre-sented in the study are much smaller than the areas used in polio coverage surveys or the clusters sampled in nationally representative surveys. The indicators used were selected after analysing data from an in-depth case– control study of malaria morbidity in the same area and may not be the optimal indicators for all settings. Fur-thermore, not all of the variables identified as relating to malaria infection are easily amendable to interven-tion, such as open eaves and types of crops. In particular, crop types may be related to other environmental factors and were identified as important because they represent proxies for other unmeasured variables.
Such a tool as presented here should promote locally relevant strategies to overcome barriers to prevention. For example, if high prevalence of damaged and old ITNs is identified as the problem, distribution efforts can be scaled up locally perhaps incorporating a ‘trade-in’ strat-egy. If ITNs are available, but are not being used consist-ently, then new ITNs are not necessary, but education interventions are required. Regular implementation of the rapid assessment tool can identify emerging problems and prompt early action. In addition, the tool can be used by community members and analysing locally in a very straightforward manner based on targets and rules. This allows the collection, analysis, and subsequent action to be owned by the community.
Conclusion
Abbreviations
CHVs: Community Health Volunteers; HDSS: Health and Demographic Surveil-lance Site; ITNs: insecticide treated nets; LQA: Lot Quality Assurance; MESA: Malaria Elimination Scientific Agency.
Authors’ contributions
WPO, JNM, DM and AAO conceived and designed the experiments. WPO, JNM, DM and AAO performed the experiments. AP and WPO analysed the data. JNM, DM, AAO, AP and WPO wrote the paper and contributed to interpreta-tion of results and revisions of the manuscript. All authors read and approved the final manuscript.
Author details
1 College of Health Sciences, Moi University, Eldoret, Kenya. 2 Duke Global Health Institute, Durham, NC, USA. 3 Academic Model Providing Access to Healthcare, Eldoret, Kenya. 4 Department of Medicine, Duke University, Durham, NC, USA.
Acknowledgements
We would like to thank the members of the community who supported this work and the participants who made it possible. Special recognition goes to our research assistants Ibrahim Khaoya, Isaac Kunusia, Eznah Mukeli, Eric Nalianya, Lilian Nukewa, Edith Wamalwa, and Aggrey Wekesa without whom the project would not have been possible.
Competing interests
The authors declare they have no competing interests.
Availability of supporting data
The datasets supporting the conclusions of this article will be uploaded in an anonymized form onto the Duke website/repository, http://sites.duke.edu/ wpomeara.
Consent to publish
This paper does not contain any individual person’s data in any form (indi-vidual details, images or videos). We also included in our consent form that we would share the general results from the study with other scientists.
Ethical considerations
We asked the household head to provide written informed consent for the household to participate in the study. Each household member was also requested to consent individually before being tested for malaria infection. The study protocol was reviewed by the Moi University Institutional Research and Ethics Committee and Duke University Institutional Review Board.
Funding
This work was supported by a grant from the Malaria Eradication Scientific Alli-ance (MESA) to WPO. Its contents are solely the responsibility of the authors and do not necessarily represent the official views of MESA.
Received: 10 May 2016 Accepted: 27 October 2016
References
1. Hawley WA, Phillips-Howard PA, Ter Kuile FO, Terlouw DJ, Vulule JM, Ombok M, et al. Community-wide effects of permethrin-treated bed nets on child mortality and malaria morbidity in western Kenya. Am J Trop Med Hyg. 2003;68:121–7.
2. Alonso PL, Lindsay SW, Armstrong Schellenberg JR, Keita K, Gomez P, Shenton FC, et al. A malaria control trial using insecticide-treated bed nets and targeted chemoprophylaxis in a rural area of the Gambia, West Africa. 6. The impact of the interventions on mortality and morbidity from malaria. Trans R Soc Trop Med Hyg. 1993;87:37–44.
3. Klinkenberg E, Onwona-Agyeman KA, McCall PJ, Wilson MD, Bates I, Verhoeff FH, et al. Cohort trial reveals community impact of insecticide-treated nets on malariometric indices in urban Ghana. Trans R Soc Trop Med Hyg. 2010;104:496–503.
4. WHO. Word Malaria Report. Geneva, World Health Organization; 2013.
5. RBM. Roll Back Malaria progress and impact series: malaria funding and resource utilization: the first decade of Roll Back Malaria. Geneva; 2010. 6. Okiro EA, Hay SI, Gikandi PW, Sharif SK, Noor AM, Peshu N, et al. The
decline in paediatric malaria admissions on the coast of Kenya. Malar J. 2007;6:151.
7. O’Meara WP, Bejon P, Mwangi TW, Okiro EA, Peshu N, Snow RW, et al. Effect of a fall in malaria transmission on morbidity and mortality in Kilifi, Kenya. Lancet. 2008;372:1555–62.
8. Bayoh MN, Mathias DK, Odiere MR, Mutuku FM, Kamau L, Gimnig JE, et al. Anopheles gambiae: historical population decline associated with regional distribution of insecticide-treated bed nets in western Nyanza Province Kenya. Malar J. 2010;9:62.
9. Zhou G, Afrane YA, Vardo-Zalik AM, Atieli H, Zhong D, Wamae P, et al. Changing patterns of malaria epidemiology between 2002 and 2010 in Western Kenya: the fall and rise of malaria. Plos ONE. 2011;6:e20318. 10. Jagannathan P, Muhindo MK, Kakuru A, Arinaitwe E, Greenhouse B,
Tappero J, et al. Increasing incidence of malaria in children despite insecticide-treated bed nets and prompt anti-malarial therapy in Tororo, Uganda. Malar J. 2012;11:435.
11. Hamel MJ, Adazu K, Obor D, Sewe M, Vulule J, Williamson JM, et al. A reversal in reductions of child mortality in western Kenya, 2003–2009. Am J Trop Med Hyg. 2011;85:597–605.
12. Cohen JM, Smith DL, Cotter C, Ward A, Yamey G, Sabot OJ, et al. Malaria resurgence: a systematic review and assessment of its causes. Malar J. 2012;11:122.
13. Atieli HE, Zhou G, Afrane Y, Lee MC, Mwanzo I, Githeko AK, et al. Insecti-cide-treated net (ITN) ownership, usage, and malaria transmission in the highlands of western Kenya. Parasit Vectors. 2011;4:113.
14. Githinji S, Herbst S, Kistemann T, Noor AM. Mosquito nets in a rural area of Western Kenya: ownership, use and quality. Malar J. 2010;9:250. 15. Ochomo EO, Bayoh NM, Walker ED, Abongo BO, Ombok MO, Ouma C,
et al. The efficacy of long-lasting nets with declining physical integrity may be compromised in areas with high levels of pyrethroid resistance. Malar J. 2013;12:368.
16. Russell TL, Govella NJ, Azizi S, Drakeley CJ, Kachur SP, Killeen GF. Increased proportions of outdoor feeding among residual malaria vector popula-tions following increased use of insecticide-treated nets in rural Tanzania. Malar J. 2011;10:80.
17. Sougoufara S, Diedhiou SM, Doucoure S, Diagne N, Sembene PM, Harry M, et al. Biting by Anopheles funestus in broad daylight after use of long-lasting insecticidal nets: a new challenge to malaria elimination. Malar J. 2014;13:125.
18. Bungoma District and Statistics (Office), Bungoma District Profile. 2006. 19. Obala AA, Mangeni JN, Platt A, Aswa D, Abel L, Ja Namae, et al. What is threatening the effectiveness of insecticide-treated bednets? A case– control study of environmental, behavioral, and physical factors associ-ated with prevention failure. Plos ONE. 2015;10:e0132778.
20. Strobl C, Malley J, Tutz G. An introduction to recursive partition-ing: rationale, application, and characteristics of classification and regression trees, bagging, and random forests. Psychol Methods. 2009;14:323–48.
21. Protopopoff N, Van Bortel W, Speybroeck N, Van Geertruyden J-P, Baza D, D’Alessandro U, et al. Ranking malaria risk factors to guide malaria control efforts in African Highlands. PLoS ONE. 2009;4:e8022.
22. Hothorn T, Hornik K, Strobl C, Zeileis A. Party: a laboratory for recursive partitioning. 2010. ftp://cran.r-project.org/pub/R/web/packages/party/ vignettes/party.pdf.
23. Lanata CF, Black RE. Lot quality assurance sampling techniques in health surveys in developing countries: advantages and current constraints. World Health Stat Q. 1991;44:133–9.
24. Singh J, Sharma RS, Goel RK, Verghese T. Concurrent evaluation of immu-nization programme by Lot Quality Assurance Sampling. J Trop Pediatr. 1995;41:215–20.
25. Biedron C, Pagano M, Hedt BL, Kilian A, Ratcliffe A, Sa Mabunda, et al. An assessment of Lot Quality Assurance Sampling to evaluate malaria outcome indicators: extending malaria indicator surveys. Int J Epidemiol. 2010;39:72–9.
27. Brown AE, Okayasu H, Nzioki MM, Wadood MZ, Chabot-Couture G, Qud-dus A, et al. Lot quality assurance sampling to monitor supplemental immunization activity quality: an essential tool for improving perfor-mance in polio endemic countries. J Infect Dis. 2014;210:333–40. 28. Flores W, Chang J, Barillas E. Rapid assessment of the performance of
malaria control strategies implemented by countries in the Amazon subregion using adequacy criteria case study. Malar J. 2011;10:379.
29. Utarini A, Winkvist A, Ulfa FM. Rapid assessment procedures of malaria in low endemic countries: community perceptions in Jepara district, Indonesia. Soc Sci Med. 2003;56:701–12.