International Journal of Prognostics and Health Management, ISSN 2153-2648, 2015 012
Improved Visual Inspection of Advanced Gas-Cooled Reactor Fuel
Channels
Graeme West, Paul Murray, Stephen Marshall, Stephen McArthur
Department of Electronic and Electrical Engineering, University of Strathclyde, 204 George Street, Glasgow
[email protected] [email protected] [email protected]
ABSTRACT
Visual inspection of fuel channels is important for assessing the health of the UK’s fleet of Advanced Gas-Cooled Reactor (AGR) power plants. For each fuel channel inspected, any defects found must be classified and assessed by a panel of experts and documented before the plant can return to service. Part of the current inspection process involves extracting relevant frames from visual inspection videos and manually assembling them to form a “crack montage” image. As the plants age, there is increasing pressure to inspect more fuel channels. Dealing with this increase in inspection demand requires new techniques to support the analysis of an increased volume of gathered video data so that crack montages can be made within the tight timescales of the outages. Recent work by the authors has created a technique for automatically processing inspection videos to extract the relevant frames and produce so called chanoramas from which any required defect montages can be cropped. Chanoramas are 360° panoramic images, which show the entire inside surface of the fuel channel inspected, and this provides completely a new way for plant operators to view their visual inspection data and analyse the condition of AGR fuel channels. In this paper we present an industrial case study which first introduces the concept of a chanorama and summarises some initial findings of testing the techniques used to create them. Then, based on the initial testing results, new and advanced image processing techniques which have been designed to improve the quality of the final chanoramas are presented. The paper then expands upon the use of the raw data and describes techniques for rendering it to allow 3D visualisations of the fuel channels which allow inspection engineers to view features of interest from a range of different angles.
1.INTRODUCTION
In the Advanced Gas-Cooled Reactor (AGR) design of nuclear power plants visual inspection of the fuel channels, which form part of the reactor core, plays a fundamental role in the continued and extended operation of these plants (Steer 2007). By gathering information relating to the structural health of these essential components, the operator can make informed decisions about the ability of these components to fulfill their requisite functions. However, gathering this inspection information is both difficult and expensive. It is difficult in terms of both the hardware that is qualified to insert into the harsh environment of a reactor core and the physical constraints of the size and depth of the channel. It is expensive as the reactor needs to be turned off in order to inspect it, and requires specialist hardware to capture the images and trained specialists to analyze them. Recent advances in image analysis techniques and improvements in processing power have allowed new software-based solutions to be developed which can greatly enhance the quality of information which can be derived from existing and legacy inspection equipment data. These techniques are attractive as they do not require the development of new hardware which can be particularly expensive if it needs to be certified before being inserted into a reactor core. Challenges to adopting new software-based analysis techniques includes ensuring that any data manipulation does not distort or introduce any new ‘false’ artifacts and that it remains a true representation of the component being inspected.
This paper contains two main parts. The first part describes an industrial case study where a software-based solution has been developed and deployed to improve existing visual inspection of AGR graphite cores. The second part of the paper discusses recent advances in data visualization to provide alternative ways of leveraging existing data sources. These techniques are still at the laboratory demonstration stage and though they have been used to support core
_____________________
INTERNATIONAL JOURNAL OF PROGNOSTICS AND HEALTH MANAGEMENT
2 inspection on an ad-hoc basis, they have not yet been
deployed as a robust, routinely used tool.
The structure of this paper is as follows. A description of the AGR inspection process is provided in Section 2. Then, the inspection tools used and the data gathering process is explained in Section 3 before techniques for building chanoramas are described conceptually in Section 4. Section 5 describes the ASIST (Automated Software Image Stitching Tool) software and highlights key findings made during the testing of this tool. Section 6 describes image processing techniques for improving the quality of chanoramas produced and, in Section 7, techniques are described which allow existing visual inspection footage to be processed and provide 3D visualisations of AGR fuel channel walls. A summary of conclusions, findings, lessons learned and planned future work is given in Section 8.
2.INSPECTION OF AGR CORES
Monitoring and inspection are key activities which support the case for the continued and extended operation of nuclear power plants across the globe. Instrumentation and Control (I&C) data provides information relating to the current operational state of the plant, and is increasingly being used to support predictions of future health. Inspection activities are undertaken when the plant is shutdown, normally during statutory outages which offer the opportunity of making direct observations of plant components, which would otherwise be inaccessible during operation. The range of measurements and observations that can be undertaken is also far greater than when the plant is at power. Some examples of inspection techniques include the ultrasonic measurement of calandria tubes in CANDU designs (Trelinski 2008), quantification of channel bore diameters of graphite fuel channel bricks using feelers acting as Linear Variable Displacement Transducers (LVDT) (Cole-Baker and Reed 2007) in AGR designs and non-destructive evaluation of the reactor pressure vessel in PWR designs (Debnar, Alaerts et al. 2010). Visual inspection also plays a key role but due to the hazardous environmental conditions found within the reactor, even during shutdown, this is normally done remotely.
For the UK’s fleet of AGR plants, the motivation for regular plant inspection stems from the fact that at the start of life, the condition of the core components is known, but as the core ages, the components degrade and their condition is more uncertain. There are two mechanisms by which the graphite in the AGR cores degrades:
1. loss of weight from radiolytic oxidation in the presence of gamma radiation in a carbon dioxide atmosphere; 2. shrinkage and material property changes caused by
neutron irradiation (Marsden, Hall et al. 2008), (Neighbour 2000).
INTERNATIONAL JOURNAL OF PROGNOSTICS AND HEALTH MANAGEMENT
3 During the design and construction of the algorithms used to
build ASIST, a number of lessons have been learned, and recent testing of the software has identified a few areas where new algorithms could be developed to improve the quality of the final chanoramas produced. These new techniques actually aim specifically to overcome the challenges associated with designing techniques to automatically process data captured using existing hardware and existing acquisition processes which cannot be easily changed. Therefore, software-based solutions (presented herein) are required to compensate for issues such as noise, interference, lens distortion and others which might otherwise have been resolved through hardware or process modifications. Furthermore, it has become clear that by exploiting some of the inherent redundancy that exists in the data already captured by the tool, completely new 3D visualisations of the AGR fuel channel walls can be rendered.
3.INSPECTION EQUIPMENT AND DATA CAPTURE
Part of the inspection process which takes place during planned, periodic plant outages uses tools named CBIU (Channel Bore Inspection Unit), also sometimes called the CBMU (Channel Bore Monitoring Unit) and NICIE Mk2 (New In-Core Inspection Equipment Mark 2) which are lowered into each AGR fuel channel selected for inspection (Cole-Baker and Reed 2007). These tools are equipped with various sensors, including a video camera, which are used to acquire data from inside the channel. The NICIE Mk2 device is a newer tool combining a different arrangement of sensors from CBIU, however both devices are still in use. Once a channel has been selected for inspection, the process of visually inspecting a fuel channel at an AGR is as follows: the fuel assembly is removed from the channel to be inspected. Then, either NICIE Mk 2 or CBIU is lowered into the fuel channel while the camera within the tool is fixed so that it points forward looking down the centre of the channel. When either tool reaches the bottom of the channel a mirror is positioned in front of the camera module at 45° to provide a view of the side of the channel. The tool is then hoisted up the length of the channel at a constant speed and fixed orientation to allow video footage of the surface of the channel wall to be captured at this camera facing. The tool is then returned to the bottom of the channel, rotated by approximately 60° (the field of view of the camera in each tool is approximately 70° to allow some overlap) and the process repeated a further 5 times to ensure complete coverage of the inside surface of the channel. If at any point during the recording a crack, or anomalous feature is observed, then its location is noted. Once all six traversals of the channel are complete, the location of any cracks or defects are re-visited and additional “crack following” footage is recorded. The sole purpose of this footage is to allow montages of these cracks to be created for further analysis. As explained earlier, these montages are created by
extracting frames from the crack following footage and manually assembling them using conventional image manipulation software.
4.CHANORAMAS:AUTOMATICALLY GENERATED FUEL CHANNEL MONTAGES
The creation of chanoramas offers a number of significant benefits to the plant operators in the UK. Firstly, chanoramas are much faster to produce than manual assembly of defect montages, with chanorama generation times now in the region of about 30 minutes on a powerful desktop computer. This is significant when compared to approximately half a day to a day which is currently required to produce a single crack montage by manual assembly. Secondly, the chanorama covers the full inner surface of the channel allowing the location of any defects to be referenced to other known features within the channel, and in the case of multiple defects in a channel (which are produced with no additional overhead in the chanorama), the relative positions of each defect. Thirdly, the need for the additional crack following footage is removed, thereby reducing the inspection time for each channel regardless of whether or not further data processing is required to produce a crack montage. This is particularly beneficial as any observed cracks or defects need to be formally assessed and reported upon before the reactor is re-started. Therefore, production of these images lies on the critical outage path of the reactor.
4.1.Automated chanorama generation
International Journal of Prognostics and Health Management, ISSN 2153-2648, 2015 012
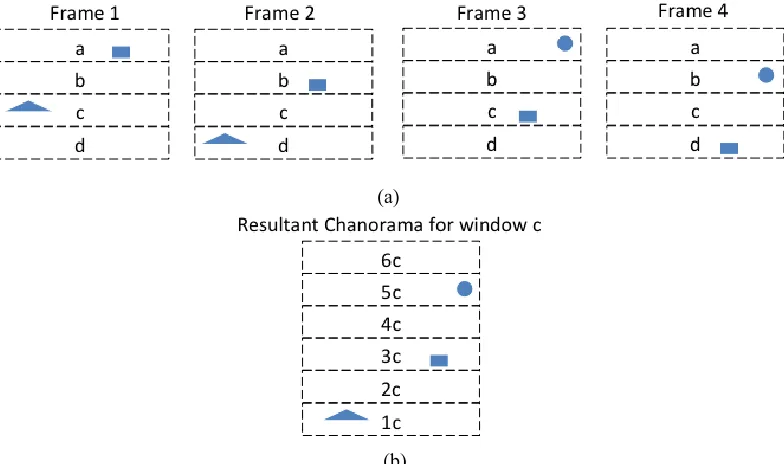
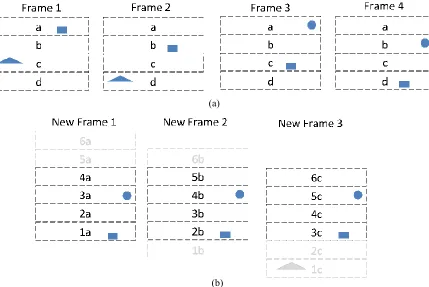
Figure 1 Process for creating a chanorama where a window of set height is extracted from each frame and these windows are stacked on top of each other to form the chanorama (a) frames from video (b) chanorama strip
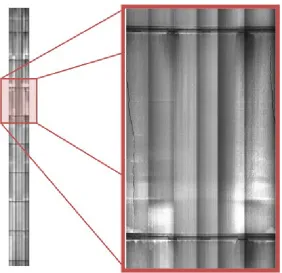
The tool moves at a constant speed of 1.5m/minute which equates to 25mm per second. The camera captures 25 frames per second meaning the displacement of features between frames is 1mm. The relative displacement of spatial features between frames was determined empirically to be 5 pixels and hence a 5 pixel high window was cropped from each frame in the video sequence to build the chanorama using the approach outlined in Figure 1. Two additional and quite different approaches using 1) feature extraction and 2) cross correlation to automatically compute the optimal window height directly from the images were also implemented and evaluated. There was no discernible difference in the quality of images produced by each technique and, hence, the approach using a window with a fixed height of 5 pixels was preferred as it minimizes computational overhead. In the case of creating a chanorama for an AGR fuel channel, the above process is applied to footage from all 6 different camera orientations and the 6 individual chanorama strips are subsequently stitched together to form the full 360° channel image. An example of a chanorama taken from Hinkley Point B nuclear power plant in the UK is shown in Figure 2. The left hand side shows the full chanorama and the right hand side shows a close up of a single brick layer containing a single, full length axial crack.
It should be noted that techniques for image stitching have been actively researched in the image processing community for many years, and, as such, this is a mature area of research. However, the techniques in this area tend to rely on images with rich feature content and high detail for accurate alignment of the overlapping images to be
stitched. Such feature rich images are not generally found in the videos captured from within the reactor core as the fuel channels being inspected are grey and often featureless surfaces themselves. Hence, new techniques capable of dealing with the lack of features had to be developed. A review of the literature on image stitching is beyond the scope of this paper. However, the following references are provided for the interested reader seeking further information on this topic, (Szeliski 2006), (Brown and Lowe 2007), (Dobie, Summan et al. 2013).
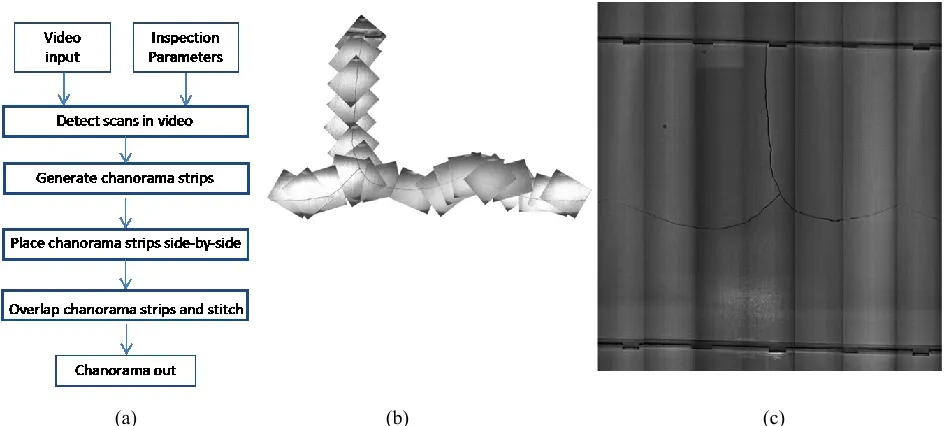
5.AUTOMATED SOFTWARE IMAGE STITCHING TOOL A prototype software tool called ASIST which is able to automatically convert AGR inspection videos into chanoramas has recently been provided to plant inspection engineers in the UK for testing in parallel with their ongoing inspection campaign. The software allows a system user to select a video file for processing, enter some parameters and metadata for the video, and then execute the underlying image stitching routines either in a fully automatic mode or with the option of manual intervention at set points within the algorithms. The process used by ASIST to convert the video into a chanorama are shown in Figure 3(a) and more detail on the individual steps can be found in (Murray, West et al. 2013).
5.1.ASIST Testing and Evaluation
To date, ASIST has been evaluated using multiple historic videos from each nuclear plant in the UK. Furthermore, data gathered from three recent outages in 2014 have been effectively processed using ASIST. In total, approximately (a)
International Journal of Prognostics and Health Management, ISSN 2153-2648, 2015 012
Figure 2 Example showing the full chanorama and a zoomed portion revealing a full axial crack
100 inspection videos have been converted to chanoramas using the software and, the results in terms of image quality and processing efficiency are excellent. To demonstrate this, an example crack montage image, extracted from a chanorama created using ASIST during a 2014 inspection of Hunterston B power plant is shown in Figure 3(c) alongside a manually assembled crack montage from the same brick layer in Figure 3(b).
It is immediately obvious by observation of Figure 3 that the quality of the image generated by ASIST is far superior to that offered by manual assembly. The latter is clearly a montage assembled from a number of frames which exhibit lens distortion as well as non-uniform illumination and, in some cases, saturation too. These effects originate from the raw inspection videos and hence cannot be easily removed when manually processing the data. However, it is clear that most of these artefacts are not seen in the crack montage extracted from the chanorama of this channel Figure 3(c). In fact, the technique used to create chanoramas accounts for most of these variations in the raw video data except for a small amount of non-uniform illumination across the horizontal axis of the image. Upon close inspection of the results, this actually reveals the location of the individual chanorama strips in the final image produced.
The main difference between the two approaches for producing crack montages lies in the number of frames used to create them and the way in which these frames are
stitched together. For practical reasons the manually assembled image is comprised of a very small number of frames extracted from the video. In fact, it can be seen in Figure 3(b) that around 25 frames have been used to create the image manually. Even though only a small amount of frames are used, creating the image requires many hours of expert intervention to get right. On the contrary, the image shown in Figure 3(c) was created from around 5500 individual frames using the method described in Section 4. By creating the image in this way it is possible to produce a very high quality result which appears like a single seamless image. Furthermore, ASIST takes around 30 minutes to produce the full chanorama from which a crack montage like the one in Figure 3(c) can be cropped. This data processing time, unlike that associated with the manual approach, is also not affected by the number of defects found in a channel.
International Journal of Prognostics and Health Management, ISSN 2153-2648, 2015 012
Figure 3 Crack montages (a) steps of automatic generation (b) result by manual assembly (b) cropped from chanorama
The generation of chanoramas described in this paper is tailored to process inspection videos from AGR plants. Specifically, this includes constraints on how the channels are inspected, including the use of a fixed-speed camera and a-priori knowledge of the channel dimensions, which in turn leads to the footage being captured in a specific order. This ensures that a better quality image is produced, but does of course reduce its general applicability to other applications. Furthermore, the limited surface detail in large portions of the graphite reduced the performance of feature-based approaches. If applying a similar methodological approach to a different inspection target, especially one which contains richer and more varied features, then a more general approach could be adopted which is less reliant on the a-priori knowledge of the core construction and video format.
5.2.Evaluating ASIST during a recent inspection During a recent inspection of Torness nuclear power plant in 2014, both NICIE and CBIU tools were used to acquire video footage from inside fuel channels in the AGR core. A total of 16 examples containing a mixture from both tools were used to test ASIST in a time constrained experiment. The aim was to evaluate the efficiency and robustness of the software when processing data from both inspection tools as well as to establish the quality of the chanoramas produced for each.
ASIST was configured on two machines which ran in parallel to speed up processing. If ASIST is adopted by inspection engineers this approach could be extended to speed up processing time during an outage where multiple powerful desktop PCs could run in parallel to produce chanoramas. However, given the time required to actually
acquire the data this will likely not be necessary. To begin, a single inspection video for each tool was selected randomly and viewed at high speed to allow some parameters to be estimated and set within the software itself. These videos were then processed and converted to chanoramas. Then, without being viewed in advance, the remaining videos from the sequence were processed using the same settings. A chanorama was successfully produced for all videos tested and all processing was completed within 3 working days. This is significant when compared to the existing manual process which took three times as long to produce only the crack montage images.
On analyzing the results it was noticed that 3 of the 16 videos processed contained a small amount of “camera noise” and the effects of this were visible in the chanoramas generated from these videos. However, it was deemed that this would not affect the ability of an expert analyst to interpret the images and use them for their intended health management purpose.
5.3.ASIST testing – key findings
To date, ASIST has been used to successfully convert around 100 inspection videos into chanoramas and, following initial positive feedback from inspection engineers about the software, two key points were raised: a) The resulting chanoramas often appeared to contain a tilt. This was attributed to a misalignment in the hardware between the camera and a mirror.
b) Some of the raw video footage contained noise (as mentioned above), which caused distortion to the chanoramas produced.
International Journal of Prognostics and Health Management, ISSN 2153-2648, 2015 012
Figure 4 Tilt correction (a) Raw chanorama (b) chanorama after tilt correction has been applied
Figure 5 Noise reduction and tilt correction (a) Raw chanorama, (b) Camera tilt corrected (c) Noise reduced
It should be noted that neither of these points affect the usability of the chanoramas for their intended purpose. However, in looking to the future, it would be useful to compare new results from future inspections with those captured previously. In these situations, it will be difficult to perform such a comparison (automatically or by manual visual inspection) unless the camera noise or camera-mirror misalignment is identical when capturing data from the same channel in future. Instead, a better approach is to develop new software based fixes to these distortions introduced by the data acquisition hardware. This will allow the highest quality chanoramas to be extracted from historic, current and future inspection data and should facilitate comparison of data from the same channel at different points in time.
6.ENHANCED CHANORAMAS
In the following section techniques are presented which address both of the areas identified for improvement based on the initial testing of the routines in ASIST.
6.1.Camera tilt correction
A common issue encountered when leveraging existing data sources is the lack of influence one has on the hardware or how it is calibrated retrospectively. In the case of the historical data, in many chanoramas the effects of a slight misalignment between the camera and mirror arrangement were visible. Prior to the generation of chanoramas this slight misalignment had not been an issue as any crack montages were generated by hand and the images manually
rotated and adjusted. It is even possible that this misalignment was unknown since it only became apparent when viewing entire brick interfaces in chanoramas. When present, this camera tilt was found to be a constant across a full outage and did not vary during the recording. Therefore a simple solution was to ascertain the magnitude of this tilt (typically 1-2°) and rotate each frame before applying the window extraction and stitching. As the window used to create the chanorama is near the middle of the frame, the resulting rotation does not significantly reduce the data lost at either edge of the window. Furthermore, there is overlap between the six strips used to comprise the full chanorama, which mitigates the potential for lost data. Figure 4 shows an example of a portion of a chanorama showing the interface between two brick layers. Four trepanning holes can also be seen, where small samples of the core have been removed and tested for their material properties. The raw chanorama is shown in Figure 4(a) and in Figure 4(b) is a chanorama that has had the camera tilt corrected. As can be seen, the chanorama is still created without loss of detail, and the features in the image are no longer at an angle.
6.2. Noise reduction
A second issue encountered with some of the chanoramas is the presence of noise in the video. The source of this noise is attributable to other sensors mounted in the tool, which are sometimes deployed during some of the inspection procedure. Making hardware modifications to reduce or eliminate this noise is not possible within the scope of our work. When present, the noise generally manifests itself as horizontal lines in the video output and any chanorama produced using such data. Furthermore, the noise is
(a) (b)
[image:7.612.123.488.198.296.2]International Journal of Prognostics and Health Management, ISSN 2153-2648, 2015 012
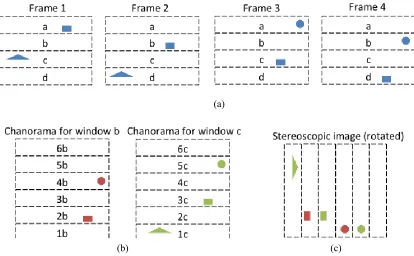
[image:8.612.130.501.387.490.2]Figure 6 Process for generating an anaglyph 3D image of the fuel channel surface (a) video frames (b) two different chanoramas from different viewpoints (c) stereoscopic anaglyph image
Figure 7 Example anaglyph 3D image of a crack and a brick interface
intermittent and appears at one location in one frame of the video, but not in the next frame. The approach used to reduce the impact of this noise was firstly to identify and then to substitute the segments containing the noise with neighboring windows from adjacent frames. A physical feature, such as a brick interface or a crack, would be represented by the same approximate pixel greyscale value in subsequent frames, whereas noise would be represented as a change in the pixel greyscale value. This allowed the noise to be distinguished from true straight lines, such as the brick interfaces. Therefore, as shown in the example in Figure 5, the proposed approach is able to suppress the noise without removing details of the channel such as the brick interfaces, trepanned holes and horizontal cracks. Given that each window was only 5 pixels high then, provided only nearby windows were selected, the distortion
caused by the location in the field of view was not enough to be appreciable in the final chanorama. Figure 5(a) shows the raw image, in Figure 5(b) the camera tilt correction has been applied and Figure 5(c) shows the result of the noise reduction when applied. This demonstrates the usefulness of the implemented noise reduction algorithm when applied to real industrial inspection data.
7.3DVISUALIZATION
The development of the noise reduction algorithm discussed in the previous section led to the realization that a lot more information could potentially be derived directly from the source videos. Recent work has hence focused on the generation of stereoscopic images from the raw source video, which has led to the generation of so called “pivot” videos, where an alternative video which “pivots” around a (a)
International Journal of Prognostics and Health Management, ISSN 2153-2648, 2015 012
Figure 8 Pivot video creation (a) video frames (b) aligned frames with different viewpoints and video frame extraction
The raw video footage can be viewed here: http://personal.strath.ac.uk/graeme.west/Source.avi and the resulting pivot video can be viewed here: http://personal.strath.ac.uk/graeme.west/PBI.avi
Figure 9 Sample frames from a pivot video
feature of interest can be generated directly from the raw source footage. This was found particularly useful for examining a new type of defect, a keyway root crack, which was discovered for the first time during the development of these techniques.
7.1. Stereoscopic images
When creating a chanorama, the height of the window extracted from each frame is only 5 pixels high while the usable region from a standard frame is 410 pixels high (once an overlay has been removed). This means that a maximum of 406 different chanoramas could be generated from the useable pixels in each frame. Within the field of view, due
to the curved surface being examined and the close proximity of the camera to the channel wall, there is a reasonable amount of variation between chanoramas generated by a window selection near the top of the frame compared to those generated near the bottom of the frame. By selecting two different chanoramas and adding a red tint to one and a cyan tint to the second, then merging the two an anaglyph 3D image can be generated. This process is illustrated in Figure 6.
The result from applying this process to a single traversal is shown in Figure 7. Although this provides some sense of depth when viewed with appropriate 3D glasses, there are limitations. Firstly, the image needs to be rotated by 90° to (a)
(b)
[image:9.612.71.544.405.489.2]INTERNATIONAL JOURNAL OF PROGNOSTICS AND HEALTH MANAGEMENT
10 match the left and right eye offset, which is not intuitive
with respect to viewing the actual fuel channel. Secondly, there was a significant amount of tuning required for the anaglyph, and with the large quantity of featureless grey in the image, the overall response is muted. Thirdly, 3D glasses are required to view the anaglyph image. However, this laid the foundations for creating “pivot” videos, which provide a much improved 3D visualization experience of the data.
7.2.Pivot videos
Building upon the anaglyph generation, the raw video permits up to 406 different chanoramas to be created. If created, all chanoramas could then be aligned and a new set of video frames cropped and compiled from the sequence of chanoramas to create a “pivot video” using the technique illustrated in Figure 8. In practice, far fewer chanoramas (between 10 and 20) are sufficient to produce a suitable output “pivot” video. When played back, the resultant video then “pivots” around the point of interest as each chanorama provides a different view of the same feature from a slightly different angle. Figure 9 shows 5 frames from a pivot video taken of a brick interface. The frame in Figure 9(a) is taken from a window near the bottom of the frame, with the brick interface feature the focus of the pivot video. From this viewpoint, the camera is looking slightly down onto the interface from above. Subsequent frames are taken from windows higher up in the frame until the last frame shown in Figure 9(e), where the camera is slightly below the interface looking up (note: these frames have not had camera tilt correction or other calibration applied). Figure 9 demonstrates the pivot video views as best as possible in a paper format. However, the full effect can only truly be appreciated by viewing the video itself using the links provided above the figure caption in Figure 9.
The process of generating pivot videos has recently been applied to the assessment of the crack shown in Figure 7. Here, the crack includes a small section of the brick which has fragmented from the main bulk of the brick. In this situation, the operators wished to establish whether the resulting fragment remained: flush with the surrounding wall; was recessed into the brick; or protruded into the channel. This was difficult to ascertain from the raw inspection videos or any single 2D image of the crack. However, the 3D pivot video allowed a more informed decision to be made by allowing the crack to be viewed from a range of different angles to give a previously unavailable sense of depth.
8.CONCLUSIONS AND FUTURE WORK
This paper has provided an overview of advanced image processing techniques which are currently being investigated to provide support to the inspection of fuel channels in the UK’s fleet of AGR nuclear power plants. Software which automatically generates chanoramas has
been demonstrated (Murray, West et al. 2013) to produce valuable results on three complete outages for evaluation purposes and an overview of one of these studies was provided herein. The software is currently under review with a view to being used in the 2015 outage campaign. This is already providing significant benefits in the time saved on the critical outage path, both in terms of the time taken to generate the images, and in removing the need for the crack following footage. Furthermore, the resulting chanoramas provide far greater coverage, and therefore contextual information about the relative location of any defects to each other and known features within the channel. This should allow for more accurate defect sizing going forward.
This paper has also described recent improvements made to the original chanorama software, ASIST, addressing issues of noise and camera tilt compensation. The stereoscopic images and “pivot” videos presented in this paper have been used to support the investigation of new keyway root cracks found recently in the Hunterston B nuclear power plant and have provided engineers with a much greater appreciation of the configuration and structure of the cracks found. Looking to the future, there is additional potential benefit to be gained by exploiting redundancy in the raw inspection videos. Firstly, developing the concept of the pivot video further to provide an interactive chanorama where the user could select any point on the chanorama to generate a pivot video is currently under investigation. Another interesting research avenue being pursued is the possibility for extracting structure from motion from the video. That is, variation in illumination between successive video frames contains coded information relating to the surface structure. The ultimate goal of this would be to use the raw footage to generate a 3D point cloud, which could in turn be fed to a 3D printer to create a physical model of the inside surface, and associated defects, of the fuel channel. This is a challenging problem, particularly given the constraints of the hardware, but would also have potential application in designing inspection equipment for future generations of nuclear reactors.
ACKNOWLEDGEMENT
This work was funded by EDF Energy. The views presented here are the views of the authors and do not necessarily represent the views of EDF Energy.
REFERENCES
Brown, M. and D. G. Lowe (2007). Automatic Panoramic Image Stitching using Invariant Features. International Journal of Computer Vision 74 (1): 59-73.
INTERNATIONAL JOURNAL OF PROGNOSTICS AND HEALTH MANAGEMENT
11 Debnar, A., Alaerts, L., Spies, M., Minogue, P., & Epineau,
C. (2010). Recent experiences with ultrasonic inspection of baffle former bolts. In 8th International Conference on NDE in Relation to Structural Integrity for Nuclear and Pressurised Components, Sept, Berlin, Germany.
Dobie, G., et al. (2013). Visual odometry and image mosaicing for NDE, NDT & E International57(0): 17-25.
Marsden, B.J., Hall, G.N., Wouters, O., Vreeling, J.A. and Van Der Laan, J. (2008). Dimensional and material property changes to irradiated Gilsocarbon graphite irradiated between 650 and 750 °C. Journal of Nuclear Materials, 381 (1–2), 62–67.
Murray, P and West, G and Marshall, S and McArthur, S. (2013). Automated image stitching for enhanced visual
inspections of nuclear power stations. 10th
International Conference on Condition Monitoring and Machine Failure Prevention Technologies, June 17th
-20th, Krakow, Poland.
Neighbour, G.B. (2000). Modelling of dimensional changes in irradiated nuclear graphites. Journal of Physics D: Applied Physics 33 (22), 2966–2972.
Steer, A. G. (2006). AGR core design, operation and safety functions, G.B. Neighbour (Ed.), Management of Ageing Processes in Graphite Reactor Core, RSC Publishing, Cambridge, pp. 142–149.
Szeliski, R. (2006). Image alignment and stitching: A tutorial. Technical Report MSR-TR-2004-92, Microsoft Research.
Trelinski, M. (2008). Inspection of CANDU Reactor Pressure Tubes Using Ultrasonics. In 17th World Conference on NDT, October 25th -28th, Shanghai,
China.