THE NATURE AND ACQUISITION OF EXPERT
KNOWLEDGE TO BE USED IN SPATIAL EXPERT
SYSTEMS FOR CLASSIFYING REMOTELY SENSED
4
IMAGES
UNIVERSITY OF TASMANIA
Paul Crowther
MSc, BSc(hons), Grad Dip Comp Stud,
Grad Dip Admin, Dip Teach (TAFE)
A' School of Computing -\,--
University of Tasmania
PO Box 1214, Launceston,
Tasmania, Australia, 7250
A thesis submitted in fulfilment of the requirements for the degree of
Doctor of Philosophy
Paul Crowther
12th June 1999 DECLARATION
I hereby declare that this submission is my own work and that, to the best of my
knowledge and belief, it contains no material previously published or written by
another person nor material which to a substantial extent has been accepted for the
award of any other degree or diploma of the University or any other institute of higher
learning, except where due acknowledgment is made in the text.
Paul Crowther
12th June 1999
AUTHORITY OF ACCESS
This thesis may be made available for loan and limited copying in accordance with
ABSTRACT
Knowledge engineering is the process of acquiring expert knowledge from human
domain experts. In this thesis the emphasis is on the acquisition of geographic or
spatial knowledge from experts involved in interpreting multi-spectral satellite
images.
This thesis argues that spatial knowledge is primarily visual, hence tools to acquire it
also need to be visual. Currently there is no methodology, other than ad hoc interview
and protocol analysis, for acquiring expert knowledge of interpretation of satellite
images. As a result, there cannot be an integrated knowledge acquisition toolkit, since
this must be based on a formal methodology. This thesis offers a methodology to
overcome this shortcoming and presents a series of tools to implement the
methodology.
In the first part of the thesis the nature of geographic knowledge is investigated. A
geographic knowledge classification scheme is presented as the basis of the work in
the rest of the thesis. It is shown that geographic knowledge can be divided into a six
level hierarchy:
• Primitive knowledge about point, line and areal objects,
• Relationship knowledge about the relationships between primitive objects,
• Assembly knowledge about related collections of primitive objects,
• Non-Visual knowledge of expert heuristics (knowledge of short cuts acquired by
experience),
• Consolidation knowledge of how to resolve and evaluate conflicting information
and
• Interpretation knowledge of how to combine the other knowledge types to produce
a classified image.
This six level hierarchical classification of geographic knowledge forms the basis of
the KAGES (Knowledge Acquisition for Geographic Expert Systems) methodology.
as interviewing and automated knowledge acquisition methods such as neural
networks and machine learning. It will be shown that although automated pattern
recognition techniques are important, there is still a need to include knowledge
acquired by human image interpreters in an automated image interpretation system.
There is a theoretical discussion of new techniques to acquire visual knowledge of the
types identified in the KAGES methodology. It is shown that these methods can be
combined into an integrated knowledge engineering toolkit to acquire geographic
knowledge from satellite image interpreters. Not all geographic knowledge is visual
however. Three types of non-visual knowledge, algorithmic, heuristic and temporal,
are identified and investigated. The first two are implemented in the knowledge
engineering toolkit described in this thesis.
It is shown that if there are multiple domain experts and multiple knowledge
acquisition sessions multiple knowledge-bases will be produced. Techniques for the
consolidation of these knowledge-bases is presented.
The final section of the thesis involves evaluation of KAGES. This is done in two
ways: user evaluation and application of the methodology in two domains. The user
evaluation of the KAGES methodology and toolkit involved a number of image
interpretation experts from a variety of domains and currently using a variety of tools.
They were questioned about the usefulness and useability of the KAGES toolkit.
The results of using the tools in the toolkit are evaluated by generating rules for two
scenarios, one for sea ice identification and the other for crop recognition. The rules
produced using the toolkit are compared with rules produced using other techniques.
The effect of applying rules generated by the toolkit to classify images is compared
ACKNOWLEDGEMENTS
The work reported in this thesis has been supported by an Antarctic Science Advisory
Committee Research Grant and a Horticultural Research and Development Grant.
I would like to thank Steve Pendlebury (Bureau of Meteorology, Hobart), Dr. Robert
Massom and Dr. Kelvin Micheal (Antarctic CRC, Hobart) for their assistance in
providing glaciological knowledge. Also Dr. Rowland Lawrence, Chris Abbott
(Tasmanian Institute for Agricultural Research) and Mark Brown (Department of
Primary Industry and Fisheries) for their help with agricultural knowledge and the
MIRC project. Ross Lincoln of the University of Tasmania deserves a special thanks
as he was responsible for image acquisition (for which he was paid) and provision of
an alternative classification method as well as evaluating KAGES (for which he was
not paid).
As well as the above I would like to thank the following for evaluation and feedback
on the KAGES toolkit: Assoc. Prof. Manuel Nunez, Prof. Jamie Kirkpatrick,
Dr. Eleanor Bruce (Department of Geography and Environmental Studies, University
of Tasmania), Mr Mark Chladil (Tasmania Fire Service), Mark Garvey (Country Fire
Authority, Victoria), Guy Tuddenham and Dr. John Le Marshall (Bureau of
Meteorology, Melbourne)
Staff and students of the School of Computing have been supportive throughout this
project. I thank Head of School, Prof. Young Choi, for his continued support and
advice. Jacky Hartnett, co-author of many of the papers I have written, has offered
much valuable advice on which direction KAGES should be headed and without her
half the papers produced would not have been written. Dr. Mike Cameron-Jones, as
my associate supervisor, kept me on track while my supervisor was away and kept me
focused. Finally many thanks go to my supervisor, Dr. Ray Williams, who has read so
many drafts of this thesis he probably knows it off by heart. I appreciate his advice,
CONTENTS
page
ABSTRACT iii
ACKNOWLEDGEMENTS
LIST OF FIGURES xi
LIST OF TABLES xv
1. INTRODUCTION 1
1.1 Knowledge Engineering In Spatial Expert Systems 1
1.2 Statement of Thesis 6
1.3 Chapter Plan 7
1.4 Publications 8
2 THE NATURE OF SPATIAL KNOWLEDGE 9
• 2.1 Knowledge 9
•2.2 Expertise and the Domain Expert 9
2.3 Expert Systems 10
2.4 Visual Knowledge 12
2.4.1 Geographic or Spatial Knowledge 12
2.4.2 Classification of Geographic Knowledge 13
2.4.3 Problems of Spatial Knowledge Classification Schemes 15
2.4.4 Unique Characteristics of Spatial Knowledge 16
2.5 Verification of Expert Interpretations 17
2.6 The Needs of a Visual Geographic Knowledge Acquisition System 19
2.7 A Proposed Classification Of Geographic Knowledge 19
2.7.1 Primitive Knowledge 20
2.7.2 Relationship Knowledge 21
2.7.3 Assembly Knowledge 21
2.7.4 Non Visual Knowledge 22
2.7.5 Temporal Knowledge 22
2.7.6 Algorithmic Knowledge 23
2.7.7 Heuristic Knowledge 23
2.7.8 Consolidation Knowledge 23
2.8 Visual Knowledge and ICADS 24
2.9 Conclusion 26
3 KNOWLEDGE-BASED SPATIAL INFORMATION SYSTEMS 27
3.1 Geographic Information Systems 27
3.1.1 Data Input and Verification 28
3.1.2 Data Output and Presentation 29
3.1.3 Data Transformation and Analysis 29
3.1.4 Data Storage and Database Management 30
3.1.5 Interaction With the User 33
3.2 Remote Sensing 36
3.2.1 Active and Passive Remotely Sensed Data 36
3.2.2 The Electromagnetic Spectrum 37
3.2.3 Problems With Remotely Sensed Data 38
3.3 The Need for Data Structures 39
3.3.1 Evaluation of Vector versus Raster Data Structures for
this Study 39
3.3.2 Knowledge-base Structure for a Geographic System 40
3.4 Survey of Knowledge-based GIS and RSS 43
3.5 Conclusion 46
4 TRADITIONAL KNOWLEDGE ACQUISITION TECHNIQUES 47
4.1 Introduction 47
4.2 Manual Techniques 48
4.2.1 Interviews 48
4.2.2 Observation / Protocol Based Analysis 50
4.2.3 Repertory Grid 53
4.3 Automated Techniques 55
4.3.1 Machine Learning 56
4.3.2 Neural Networks 58
4.3.3 Supervised Versus Unsupervised Methods 59
4.3.4 The Importance of Training Data 60
4.4 Combination Of Knowledge Gained From Multiple Techniques and
Multiple Experts 61
5 THE SPATIAL KNOWLEDGE ACQUISITION PROCESS 66
5.1 Introduction 66
5.2 Scenarios For Assessing Spatial Knowledge Acquisition 66
5.2.1 Antarctic Sea Ice Classification 67
5.2.2 Crop Recognition 69
5.3 Primitive Knowledge Acquisition 71
5.3.1 Knowledge of Areal Features 71
5.3.2 Knowledge of Point Features 73
5.3.3 Knowledge of Line Features 73
5.4 Relationship Knowledge Acquisition 75
5.4.1 The Problem of Three Objects 79
5.5 Assembly Knowledge Acquisition 79
5.6 Non-Visual Knowledge Acquisition 80
5.6.1 Heuristic Knowledge Acquisition 80
5.6.2 Algorithmic Knowledge Acquisition 81
5.6.3 Temporal Knowledge Acquisition 82
5.7 Consolidation Knowledge Acquisition 83
5.7.1 Primitive Knowledge 83
5.7.2 Relationship Knowledge 87
5.7.3 Assembly Knowledge 88
5.7.4 Heuristic Knowledge 90
5.8 Interpretation Knowledge Acquisition 91
5.9 Conclusions 91
6 THE KAGES SPATIAL KNOWLEDGE ACQUISITION TOOLKIT 93
6.1 Overview 93
6.2 Primitive Knowledge: The Per Pixel Tool 95
6.2.1 Primitive Knowledge 95
6.2.2 Identifying Areal Features 96
6.2.3 Identifying Point Features 97
6.2.4 Identifying Line Features 98
6.2.5 Primitive Knowledge Data Structures 99
6.2.6 Primitive Knowledge Rules 100
6.3.1 Spatial Relationships Involving Lines 102
6.3.2 Spatial Relationships Involving Points 103
6.3.3 Spatial Relationships Involving Areas 103
6.3.4 Relationship Knowledge rules 104
6.4 Assembly Knowledge Acquisition: The Region Of Interest Tool 104
6.4.1 Assembly Knowledge Rules 106
6.5 Non Visual Heuristic Knowledge Acquisition: The Repertory Grid
Tool 107
6.5.1 Analysis 110
6.6 Non Visual Algorithmic Knowledge Acquisition: The Band
Calculator Tool 111
6.7 A Tool To Assist Machine Learning And Verification:
The Point Data Tool 113
6.8 Consolidation Knowledge Acquisition: The Consolidation Tool 114
6.9 Knowledge Verification Tool 115
6.10 The User Interface 116
6.11 Conclusions 118
7 EVALUATION OF THE KAGES SYSTEM 120
7.1 Introduction 120
7.2 Methodology For Comparing The Knowledge Acquired By
The System 120
7.2.1 General Approach 120
7.2.1 The Sea Ice Mapping Domain 121
7.2.1 The Crop Recognition Domain 122
7.3 Methodology For Evaluating The Useability Of The System 122
7.3.1 User Selection 122
7.3.2 User Testing Procedure 123
7.4 Results Of The Evaluation 124
7.4.2 Verification Strategies in Remote Sensing 124
7.4.2 Antarctic Sea Ice Knowledge 125
7.4.2 Crop Recognition Knowledge 135
7.4.3 Expert User Acceptance 138
8 CONCLUSIONS 143
8.1 Introduction 143
8.2 An Integrated Geographic Knowledge Acquisition Strategy 143
8.3 An Integrated Toolicit to Implement the Knowledge Acquisition
Strategy 145
8.4 User-Centred Geographic Knowledge Acquisition 146
8.5 Future Work 147
8.5.1 Temporal Knowledge 147
8.5.2 Interpretation Knowledge 147
8.5.3 Machine Learning Integration 148
8.5.4 Data Mining 149
9 REFERENCES 150
GLOSSARY 164
APPENDIX A: OPERATION OF KAGES 165
A.1 Main Menu 165
A.2 Load SPOT Image 166
A.3 Display Bands 166
A.4 Band Calculator 167
A.5 Per Pixel Tool 168
A.5.1 Verification of Per Pixel Tool 170
A.6 Relationship Tool 172
A.6.1 Verification of Relationships 174
A.7 Region of Interest Tool 176
A.8 Repertory Grid Tool 178
A.9 Point Data Tool 183
APPENDIX B: THE M1RC DATA BASE 186
LIST OF FIGURES
page
Figure 1.1 GIS, Remote Sensing and Expert Systems. 5
Figure 2.1 Essential components of a knowledge-based system
(after Mockler, 1989). 11
Figure 2.2 The four-layer model of expertise (Wielinga et al, 1992). 24
Figure 3.1 Components of a GIS. 28
Figure 3.2 Types of vector representations. 32
Figure 3.3 Semantic Network. 41
Figure 3.4 Part of a frame for storing meta-data (from Miller, 1994, p. 148). 42
Figure 3.5 An integrated RSS, expert system and GIS
(after Wilkinson and Burrill, 1991). 43
Figure 4.1 Relationship of traditional knowledge acquisition techniques. 47
Figure 4.2 Multilayer feedforward artificial neural network for land type
classification (Leung, 1997, p205). 58
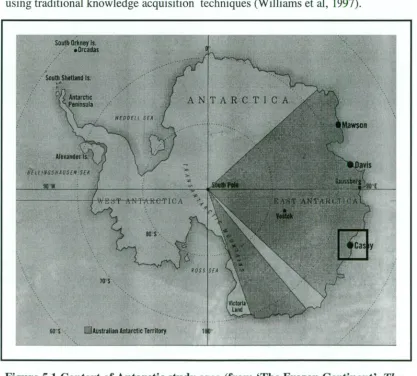
Figure 5.1 Context of Antarctic study area. 67
Figure 5.2 Antarctic study area: An area in Vincennes Bay near Casey Base. Note South is up the page. Taken from a NOAA AVHRR band 1
image viewed using KAGES. 68
Figure 5.3 Context of study area for MIRC. 69
Figure 5.4: The MIRC study area as seen on band 1 of a SPOT image taken on 2 ' November 1996 using the KAGES tool. 70
Figure 5.5 Minimum bounding rectangles. The example on the right has a
true MBR superimposed. 71
Figure 5.6 A 2D-projection picture (after Nabil et al, 1995). 72
Figure 5.7 The eight relations between two regions (Egenhofer and Sharma, 1993). 76
Figure 5.9 Three Object Definition: Fence (line object) defined by interaction of two fields (area objects) and a gate (point object) defined by the interaction of a field (area object) and access track (line object). 79
Figure 6.1 Overview of the KAGES system showing the primary knowledge
acquisition tools. 93
Figure 6.2 The band viewing tool showing the image histogram and band 3 of a SPOT image of Table Cape area in Tasmania taken on
24th December 1996. 96
Figure 6.3 Per Pixel Tool. The window on the left shows the histogram of pixel values for the entire image. The centre window is of the image itself while the right window contains a zoomed section of the image to allow for accurate selection. From band 1 of a SPOT image of Table Cape, Tasmania 2nd November 1996. 97
Figure 6.4 Relationship Tool. The first object (X) is open water defined in band 1. The second (Y) is sea ice identified from band 3 of the
NOAA image. The results are shown superimposed on band 1. 101
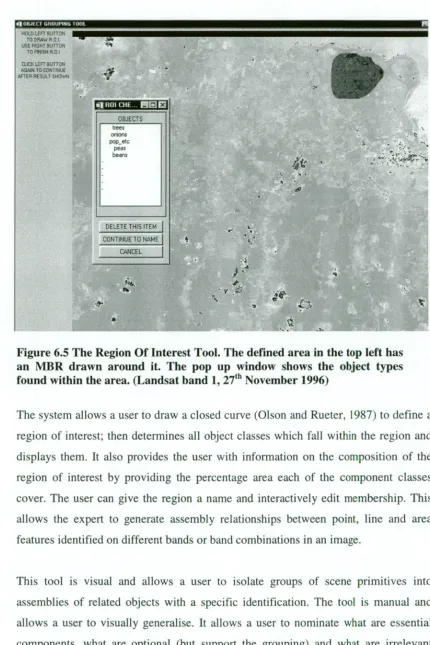
Figure 6.5 The Region Of Interest Tool. The defined area in the top left has an MBR drawn around it. The pop-up window shows the object
Types found within the area (Landsat band 1, 27 1 November 1996) 105
Figure 6.6 Repertory Grid Tool with menu options and the window to enter elements displayed. (NOAA VHRR image of Casey taken on 26th
February 1998) . 108
Figure 6.7 Triad window for determining discriminators. 109
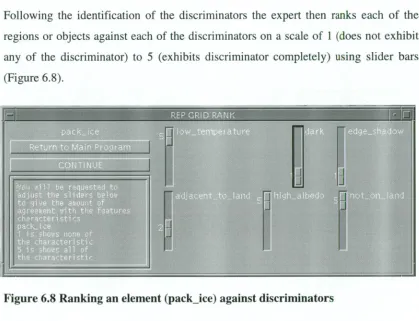
Figure 6.8 Ranking an element (pack_ice) against discriminators. 109
Figure 6.9 Repertory Grid of Antarctic elements (features) with 5 indicating complete agreement with discriminator (concept) and 1 indicating
complete disagreement with the discriminator. 110
Figure 6.10 Band Calculator for use on a three band SPOT image set. 112
Figure 6.11 Consolidation of knowledge-bases. 115
Figure 6.12 KAGES main user interface with a SPOT image loaded. The, image is of Table Cape, North West Tasmania and was taken
on 2nd November 1996. 117
Figure 7.1 Domain expert classification of sample points on the training image. 126
Figure 7.2 KAGES classification of sample points on the training image. Cells
Figure 7.3 Thermal band 3 of the test image derived from a NOAA AVHRR Image of Mawson/Davis taken on 4th March 1998 viewed using the
ICAGES Band Display Tool. 129
Figure 7.4 The classified test image produced using the !CAGES generated rules. 130
Figure 7.5 Domain expert classification of sample points on the test image. 131
Figure 7.6 KAGES classification of sample points on the test image. Cells
containing letters indicate misclassification. 132
Figure 7.7 Growth and cropping times for crops under study showing times of useable satellite passes.
Figure A.1 }CAGES main menu with SPOT HRV image (24th December 1996) already loaded.
Figure A.2 SPOT image (2" november 1996) with near infra red (band3) displayed using the Display Image Bands option.
Figure A.3 Band Calculator shown in conjunction with a SPOT image. (2" November 1996)
Figure A.4 Per-Pixel Tool being used to define an area. The zoomed window shows a segment in the bottom right hand comer of the main image
segment. 168
Figure A.5 Threshold Adjuster window showing the selected area has pixel
thresholds between 67 and 81. 168
Figure A.6 Region definition (naming) dialog window displaying an area
objects characteristics and allowing a user to enter a name. 169
Figure A.7 An image produced by applying all rules. 171
Figure A.8 Initial window from the Spatial Tool which is superimposed over
the main screen. A user is required to pick 2 objects. 172
Figure A.9 Spatial Tool with the selected objects displayed. 173
Figure A.10 Spatial Rule Editor which is superimposed on top of the previous
image showing the relationships between sea and trees. 174
Figure A.11 Effect of selecting Apply Rules / Apply Spatial Rule with the
previous rule selected. 175
Figure A.12 Region of Interest Tool defining a rural area (SPOT band 1,
2" November 1996). 176
135
165
166
Figure A.14 Naming window for Region of Interest Tool. 177
Figure A.15 Repertory Grid Tool after New Grid option chosen. 178
Figure A.16 Repertory Grid Load Window allowing entry of image features. 179
Figure A.17 Triad (Get Discriminators) Window asking users to differentiate
between features. 180
Figure A.18 Ranking Window with slider bars to input ranking. 181
Figure A.19 Repertory Grid results. 182
Figure A.20 Point Data Tool showing sampling points designated by X on the image and the Naming Window. (NOAA VHRR image of Casey
taken on 26th February 1998) 184
LIST OF TABLES
page
Table 3.1 The electromagnetic spectrum covered by Landsat. 37
Table 3.2 SPOT and NOAA AVHRR spectral characteristics. 37
Table 6.1 Data structures for scene primitives. 99
Table 6.2 Partial transcript of a file generated using the Point Data Tool on
a NOAA AVHRR image. 114
Table 7.1 Antarctic classification results using the KAGES knowledge-base
on the training image. 128
Table 7.2 Comparison of Icemapper, KAGES and S performance on the training
image. 128
Table 7.3 Antarctic classification results using the KAGES knowledge-base
on the test image. 129
Table 7.4 Comparison of Icemapper, ICAGES and S performance on the test
image. 133
Table 7.5 Crop classification results using the ICAGES knowledge-base. 137
Chapter 1. INTRODUCTION
In this chapter the origins and confluence of remote sensing, expert systems and
geography are discussed. The importance of knowledge acquisition for geographic
expert systems is argued. A statement of thesis and a chapter plan is presented.
1.1 KNOWLEDGE ENGINEERING IN SPATIAL EXPERT SYSTEMS
"Geography is concerned with the description and explanation of the areal
differentiation of the earth's surface." (Harvey, 1993, p3) This can be in terms of
natural features (physical geography) or features which relate to people (human
geography). The field of geography is wide as there are numerous subfields, for
example environmental geography, biogeography, historical geography, climatology
and geomorphology (many of which can themselves be subdivided). The one thing all
of these specialist fields have in common is their use of spatial analysis (that is they
study the way phenomena are distributed in space). The spatial distribution of
phenomena is normally shown in the form of maps, which are two dimensional
representations of parts of the earth's surface.
Maps have been used for centuries and although some map categories such as
topographic maps are multi-purpose, they have always tended to relate to a particular
theme. Initially each map was used for a specific purpose, but maps with different
themes can be combined in a process known as overlay. Unwin (1996) cites early uses
of map overlays in the mid-nineteenth century to link cholera outbreaks to water
pumps (Snow, 1936). One map depicted the water reticulation system, the second map
a plot of cholera outbreaks. Map overlays are now an essential analytical tool in
Geographic Information Systems (GIS).
Data used in maps originally came from ground based cartographers who would
survey a particular area. A major advance came in the form of airborne observations,
especially from aircraft during the First World War when aerial photography was
To gain more information infra red spectral data was subsequently used and the
visible spectrum was split into several distinct components.
The term remote sensing was introduced to distinguish multi-spectral imaging from
aerial photography. Remote sensing is defined as:
"...the measurement of objects' properties on the earth's surface using data acquired
from aircraft and satellites."
(Schowengerdt, R. A., 1997, p2)
where the term "properties" relates to electromagnetic properties. Use of sensors
other than those sensitive to visual light began in the 1960's and space borne sensors
appeared in the 1970's. With the launch of the first Landsat system in 1972, data from
space borne multispectral sensors providing large scale ground cover became readily
available.
Geographic Information Systems (GIS) are inherently linked to remote sensing
systems (Star et al, 1997). GIS's are systems which allow a user to manipulate and
analyse geographic data. They feature graphical user interfaces and integrated
databases. Their development since the 1980's has been rapid. The number and range
of applications that use GIS has increased markedly over the last few years (Star et al,
1997) and form the basis of the Tasmanian Governments' LIST (Land Information
System Tasmania) component of the Future Directions Statement.
One problem with remote sensing systems is the resolution of the data they capture.
Each image is made up of picture elements or pixels. In digital processing these are
numbers, within a specified range, for example 0 to 256. Shades of gray or colours are
assigned depending on the number. For example a value of 0 will be black and 256
will be white on a gray scale image. Currently, the best resolution is for each pixel on
an image to represent an area of about 20 meters by 20 meters on the earths surface.
Sensors with resolution of about one meter will soon be available. By contrast, in GIS
advantages of remotely sensed data is that it can be gathered in a systematic, timely
fashion (Muller, 1988).
A second problem with remote sensing systems is that although large amounts of
geographic data can be acquired, the expertise to interpret it is scarce. Therefore some
means of automating tasks such as image interpretation and classification is required
to make the best use of the data acquired (Openshaw and Scholten, 1994). Processing
techniques using artificial intelligence are a possible solution. There are three areas of
artificial intelligence which are used for image interpretation; expert systems, machine
learning and neural networks.
The field of expert systems developed rapidly in the 1970's. Expert systems are
programs which emulate an expert's problem solving methods (Pigford and Baur,
1990). An expert is often called the domain expert to indicate that a persons field of
expertise is limited to a specific subject or domain. The expert's expertise is acquired
in a variety of ways, including formal training. However the distinguishing factor of
the way an expert gains expertise is through on-the-job experience. With experience a
practitioner in a particular field develops rules of thumb and short cuts which enables
them to solve problems more effectively than others in the field. An expert is only an
expert because other practitioners in the field recognise them as such. An expert's
knowledge may be supplemented with other information gained from records and the
literature.
One of the early expert systems was the medical diagnostic system MYClN. This was
typical of the first generation expert systems which were predominantly text based
diagnostic programs (Bonnet et al 1988). Another early system was Prospector which
was used to predict the location of mineral deposits. Prospector was not a spatial
expert system, but did analysis and prediction based on the results of analysis of
geological samples and presented its results in map form. Later expert systems were
developed for more complex tasks including planning and classification. Coupled
One of the major problems in developing expert systems is acquiring knowledge to
code into them. This can be extremely time consuming, requiring numerous
interviews with domain experts. The term knowledge bottleneck was coined to
describe the problem (Weibel et al, 1995). A variety of techniques have been
developed to overcome the knowledge bottleneck including fully automated
techniques using machine learning and neural networks.
Knowledge used by expert interpreters of remotely sensed data is predominantly
visual. Traditionally the knowledge in expert systems has had a semantic association.
With visual media an expert is more likely to use the 'I know it when I see it'
approach (Gupta et al, 1997). Experts see objects in images and can point to them and
name them. To do this they may use specific bands of a set of satellite images or a
combination of those bands. They may also work on histogram representations of an
image. Hence an image interpretation expert knows what range the spectral signature
(or reflectance value) of an object will fall into. They can recognise spatial
relationships such as streams flowing in valleys and down slopes, and collections of
objects, such as roads and buildings, which make up a settlement.
Because of its visual nature the acquisition of this knowledge from the expert is
difficult using most traditional techniques. To overcome this difficulty a visual
method of knowledge acquisition is needed. That is a method which directly captures
the steps used by an expert to classify an image rather than requiring the expert to
describe those steps.
Currently most automated systems classify images on a per pixel basis (Wilkinson,
1996). Each pixel or individual picture element that makes up an image is classified as
being part of a particular object type and assigned a label. This technology is quite
well developed and available in GIS and image processing packages. It is also the
basis for pattern recognition systems using neural network and machine learning
techniques.
objects, the orientation of two objects with respect to each other and the degree of
overlap of two objects (Egenhofer and Sharma, 1993). A further complication occurs
when the interaction of two objects defines a third object. For example where an
object 'sea' meets an object 'land' a third object, a line, is defined which is
'shoreline'.
A second complex relationship occurs when a group of objects are combined into a
single object. This process is called generalisation (McMaster and Mark, 1991) and is
a technique that is used extensively in cartography. If it is impractical to show all the
details of an object, or group of objects, so they are simplified. Hence a two track
railway is often represented as a single track. A town is not shown as individual
houses but as an object representing urban development.
In both these cases techniques which can handle knowledge beyond the per pixel level
are needed. These require a system which can identify and manipulate spatial objects
and groups of objects. To be able to do this an expert knowledge acquisition system
needs to allow a domain expert to point and draw on an image. By doing this a user
can identify the objects to be manipulated and define areas of the image to be
[image:20.557.108.480.449.696.2]generalised.
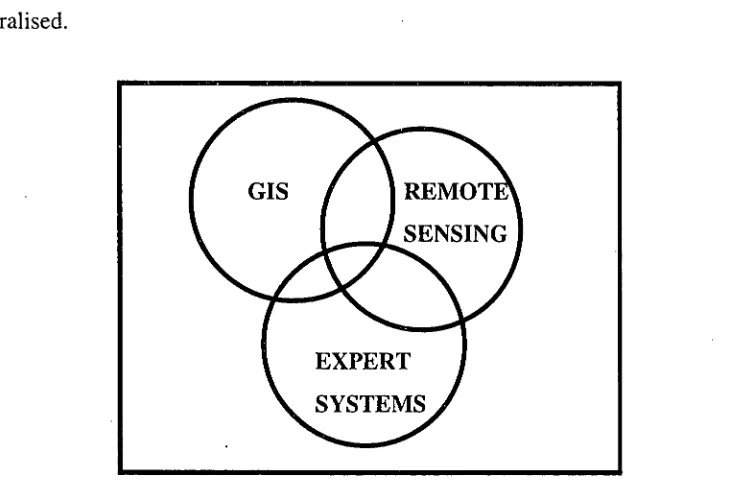
The three subdisciplines which relate to this study are shown in Figure 1.1. Remote
sensing is often closely tied to GIS. Images can be loaded into and analysed by GIS
which have a raster (or pixel) processing ability (Star et al, 1997). There are expert
systems, generally associated with image processing, which are used to directly
classify remotely sensed data (Williams et al, 1994). Likewise there are expert systems
coupled to GIS (Hartnett et al, 1994). This study is related to the *overlap of the three
areas. It is a study of the types of geographic knowledge which can be acquired from
remotely sensed images and can be used in conjunction with a GIS.
1.2 STATEMENT OF THESIS
The aim of this thesis is to investigate knowledge acquisition techniques for expert
systems used in conjunction with remotely sensed images and geographic expert
systems. This includes an investigation of the nature of expert knowledge -in a
geographic context. A new classification of visual geographic knowledge consisting of
Primitive, Relational, Assembly, Non-visual, Consolidation and Interpretation
knowledge, is presented.
To validate this classification, tools and techniques for geographic knowledge
acquisition from satellite images were developed for each of the knowledge
acquisition categories. Traditional techniques of knowledge acquisition are
investigated to determine their suitability in a geographic domain and to see how well
they compare with techniques using primarily visual knowledge acquisition tools. A
tool-kit testbench was developed to implement the tools within specific knowledge
categories. The component tools are evaluated on a series of systems and the results
analyzed both in terms of the accuracy of the rules produced and user acceptance.
It will be postulated that geographic knowledge has different characteristics from
non-visual knowledge and therefore unique tools, reflecting the way the user analyses
images, are required for knowledge acquisition. It will also be postulated that visual
knowledge elicited from different sources and gathered by different elicitation
knowledge, it will also be shown that there is a need for non-visual knowledge to be
integrated into a geographic knowledge-base.
1.3 CHAPTER PLAN
The second chapter investigates the nature of knowledge and expertise, in particular
the unique properties of spatial and geographic knowledge and expertise. The role of
the domain expert in terms of expert knowledge in relation to spatial systems and
interpretation of remotely sensed data is studied and a new classification of
geographic knowledge is presented.
The third chapter is a review of the theory and requirements of Geographic
Information Systems and discusses the choice of data structures for use with expert
systems which interact with them. There is an investigation of how the data structures
can be utilized in a knowledge-base.
The fourth chapter explores the various traditional knowledge acquisition methods,
the tools available and their applicability to geographic expert systems.
The fifth chapter introduces the scenarios to be used in testing the spatial knowledge
acquisition methodology. There is a conceptual description of the tools and the
features that are needed to acquire knowledge based on the classification system
presented in Chapter 2. It will also describe the methods of verifying and combining
spatial knowledge-bases.
The sixth chapter describes the implementation of a graphical geographic knowledge
acquisition tool-kit, KAGES (Knowledge Acquisition for Geographic Expert
Systems), based on the theoretical considerations presented in Chapter 5.
The seventh chapter presents the results of using the tool-kit in the domains described
in Chapter 5. Knowledge acquisition using the methodology is compared, in terms of
user acceptance of the various techniques and conclusions are drawn about knowledge
acquisition for spatial systems.
The final chapter presents conclusions about geographic knowledge acquisition and
suggests directions for future work.
1.4 PUBLICATIONS
Portions of this work have been published previously (Crowther and Hartnett (1996a),
Crowther and Hartnett (1996b), Crowther and Hartnett (1997a), Crowther et al (1997),
Crowther and Hartnett (1997b), Crowther (1998)). Note that the terminology used
Chapter 2. THE NATURE OF SPATIAL KNOWLEDGE
This chapter discusses knowledge and expertise in relation to visual systems and
geography. There is an investigation of the role of expert systems in geography and
the unique properties of spatial knowledge. A six level classification of visual
geographic knowledge is presented which is used as the theoretical basis for
developing knowledge acquisition tools.
2.1 KNOWLEDGE
Knowledge is a prerequisite for expertise in that first one must have knowledge, then
after experience applying that knowledge one becomes recognised as an expert.
Knowledge therefore is an awareness, familiarity and understanding acquired through
education or experience. As such it is information which has been learned, perceived,
discovered, inferred or understood (Nagao, 1988).
Visual and geographic knowledge introduces a spatial aspect to the definition. This
knowledge, or spatial cognition, involves recognition of objects, patterns and the
relationships between objects in space(Lloyd, 1997).
2.2 EXPERTISE AND THE DOMAIN EXPERT
An expert is a person who is regarded as a pre-eminent practitioner in their field of
expertise (Agnew et al, 1994). Often called the domain expert (the term used in this
thesis), they have in-depth knowledge acquired through training and experience.
Meyer and Booker (1991) define an expert as
"... a person who has a background in the subject area and is recognised by his or her
peers ... as qualified to answer questions" (p3)
Many of the methods experts use to solve problems are heuristics — rules of thumb,
may aid in a problems solution, but are not guaranteed to work (Gianatano and Riley,
1994). An important point of Agnew's paper and Meyer and Booker's Introduction is
that expertise is socially selected. You are not an expert unless others regard you as an
expert. Expertise in a specific domain is therefore rare.
Experts are generally only acknowledged experts in a particular field or domain. It is
also possible that there is no one domain expert covering a particular domain. Instead
there may be several experts in the same domain who as a group cover the domain of
expertise. Another possibility is a group who are experts in overlapping subdomains
(Barrett and Edwards, 1995). This is common when working in geographic domains
where expertise in a variety of fields is combined into a geographic information
system.
There are advantages and disadvantages to working with a group of experts. This is
particularly so when their knowledge has to be combined. With one expert one is
reliant on their expertise and their acknowledged status as an expert. With two experts
one has the problem of conflict. With three or more experts one has the problem of
minority interpretations, one of which could be the correct interpretation (Medsker et
al, 1995)
Finally, the nature of expertise is temporal (Fuller, 1994). In technology based
activities an expert must continually build their expertise, and the nature of that
expertise will change. The proliferation of expert systems has had the effect of making
expertise more widely available to users without skilling the users. The expert's
standing may be eroded because of this. This is particularly true of emerging
technologies where the early practitioners are regarded as experts, but their status as
an expert is eroded as their skills become more commonplace.
2.3 EXPERT SYSTEMS
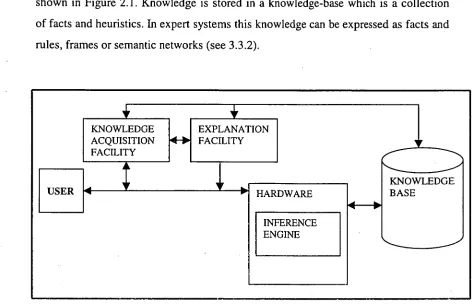
Expert systems contain representations of human expert knowledge which can be
shown in Figure 2.1. Knowledge is stored in a knowledge-base which is a collection
of facts and heuristics. In expert systems this knowledge can be expressed as facts and
rules, frames or semantic networks (see 3.3.2).
KNOWLEDGE ACQUISITION FACILITY
EXPLANATION
41—
■
FACILITYKNOWLEDGE BASE
USER HARDWARE
[image:26.557.48.521.74.381.2]INFERENCE ENGINE
Figure 2.1 Essential components of a knowledge-based system (after Mockler, 1989)
The second major component of an expert system is the inference engine. The
inference engine is a computer program which guides the manipulation of knowledge
contained in a knowledge-base (Mockler, 1989). It is often supplied as part of a
development package (Mockler and Dologite, 1992).
Hence the primary task of developing an expert system is the capture and coding of
expert knowledge of a particular problem domain into a knowledge-base. This
knowledge can come from a variety of sources; domain expert, journals, technical
manuals, historic data, electronic databases and in the case of spatial systems, maps
and GIS. In this thesis, the emphasis is on knowledge elicitation from the domain
2.4 VISUAL KNOWLEDGE
Visual (including spatial) knowledge presents special problems for knowledge
acquisition. Recognising visual features is easy for a human although the cognitive
processing is complex (Lloyd, 1997). Describing those features without the use of
diagrams is difficult. It is easy for a human expert to show what something looks like,
but far more difficult to describe it in words, and more difficult again to describe it in
terms of rules. (Kweon and Kanade, 1994). There has been work done in multimedia
where sound and animation have been added to GIS, (Galetto and Spalla, 1996) but
this still does not overcome the problem of different interpretations of the same
feature.
Many experts draw diagrams to explain their reasoning (Cheng, 1996), or use
diagrams to describe a process (Crowther, 1992). An ideal expert knowledge
acquisition tool would be one which could capture this type of knowledge directly.
2.4.1 Geographic or Spatial Knowledge
It should be noted that in this thesis the term Geographic Knowledge is used
extensively, while in scene analysis Spatial Knowledge is the term typically used and
much work has been done on spatial knowledge acquisition. In this thesis Geographic
Knowledge and Spatial Knowledge will be regarded as synonymous.
One of the primary ways of representing knowledge in geography is through the use of
maps. Maps present knowledge naturally occurring in three dimensions, in a two
dimensional graphic form. However maps are produced using information from
images produced by sensors on aircraft or satellites, from photographic images and
from ground (and sometimes underground) information. Each of these could be
regarded as another dimension. The problem then becomes one of representing
n-dimensional knowledge in a two-dimensional form (Crowther and Hartnett, 1996b).
The information is then used to produce a map showing some specific characteristics
Experts operating in different domains will use different sources and may produce
different maps of the same area showing different features. By using expert system
approaches it may be possible to make more use of all the dimensions of knowledge
available and its interpretation by multiple satellite image domain experts (Tranowski,
1990).
Egenhofer and Mark (1995) use the term "Naive Geography" to describe the field of
study that is concerned with formal models of the common sense geographic-world.
They identify a number of elements of Naive Geography which have implications for
developing geographic expert systems. These include:
• Naive Geographic space is two dimensional,
o The earth is flat as most representations (maps and images) are flat,
• Geographic space and time are tightly coupled,
• Geographic information is frequently incomplete,
• People use rnultiple conceptualizations of geographic space. That is, geographic
space is regarded differently depending on the application,
• Geographic space has multiple levels of detail. For example, depending on scale,
certain features may be grouped or generalised,
• Boundaries are sometimes entities and have a specific tag, but sometimes not,
• People have biases towards north-south and east-west directions and
• Distances do not add up easily because of order of magnitude reasoning
There is also a related problem - that of assigning definitions to features (Kweon and
Kanade 1994). In geography most terms are described in natural language, but the
definitions are often incomplete or open to interpretation. A method of knowledge
acquisition that captures how users think about geographic space is needed.
2.4.2 Classification of Geographic Knowledge
Geographic knowledge differs from knowledge used in non-spatial expert systems in
Often multiple experts with different expertise are required to interpret images to
make up a final composite image (Tranowski, 1990). There have been several papers
which suggest how to identify and classify knowledge in geographic and spatial
systems. McKeown et al (1989) identifies five types of spatial knowledge.
The five types are:
• Type 1 Knowledge: identifies scene primitives where a primitive is a readily
identifiable object such as a road, a building or an iceberg.
• Type 2 Knowledge: is the knowledge of the spatial relationships between the
scene primitives. For example, buildings are next to roads or icebergs are
surrounded by water.
• Type 3 Knowledge: defines collections of objects which form spatial
decompositions within the task domain.
• Type 4 Knowledge: consists of how to combine information from type 3
knowledge.
• Type 5 Knowledge: is used to resolve and evaluate conflicting information.
Tranowski also suggests a three level classification which is basically McKeowns
Type 1, 2 and 3 knowledge. The classification is based on:
• The appearance of objects.
• Simple relationships between objects.
• More complex relationships between objects that describe a spatial pattern.
Since this classification is not an advancement on McKeown's, it will not be
considered further.
One field of spatial systems receiving considerable attention using knowledge-based
approaches is that of generalisation (Buttenfield and McMaster, 1991).
Generalisation is the replacement of a group of features with a single generalised
Armstrong (1991) defines three types of knowledge which includes a non-visual class
necessary for generalisation. They are:
• Geometrical knowledge which describes features in terms of location and density
in a given area. For example, a feature may exist at a specific location and there
may be a number of such features in the vicinity giving an indication of
congestion.
• Structural knowledge which involves the intrinsic expertise of the domain expert
to distinguish between features. This is also influenced by the purpose of the
required map.
• Procedural knowledge which allows the control of the individual generalization:
operators and algorithms.
The classifications of McKeown and Armstrong are not mutually exclusive. They are
in fact complimentary. The McKeown classification appears to expand on
Armstrong's geometrical and structural knowledge classifications. Procedural
knowledge is an essential component when image processing systems are considered
and is not covered in the McKeown et al scheme.
2.4.3 Problems of Spatial Knowledge Classification Schemes
McKeown's classification is the most useful of the three so far discussed when
considering the development of a geographic knowledge acquisition tool. However it
does have one drawback in assuming all knowledge of a scene is visual. Non-visual
knowledge also needs to be incorporated. One example is that of temporal knowledge
where past classifications may affect those of the future. For example in agricultural
systems, crop rotation and crop seasonality may be useful in producing a
classification. Another example is the combination of satellite bands to highlight
gained directly from the images, but are rather a non-visual aspect which needs to be
added to the knowledge acquisition process.
The classification also lacks detail at certain levels. For example, what Type 1
Knowledge is essential and what is desirable when describing scene primitives? A
new classification scheme is presented at the end of this chapter.
2.4.4 Unique Characteristics of Spatial Knowledge
Spatial knowledge has all the characteristics of knowledge in other domains but there
are other additional characteristics which need to be considered including:
• Position,
• Shape,
• Size,
• Orientation,
• Connectivity,
• Containment and
• Proximity.
The relationship of one object to one or more other objects may determine the identity
of a particular feature. It is also possible that features may form a classification
hierarchy. A house may be part of a block of houses which may be a residential
division of a town for example. This forms the basis of map generalisation.
When working with images the domain expert must rely primarily on visual
interpretation of a particular image. Before satellite remote sensing images were
available, aircraft images were used as the primary source of data. A major factor in
the successful interpretation of these images was the experts' experience. The
interpretation was then confirmed by looking at other images containing similar
features in a different setting and by ground truthing. Remote sensing information
pixel values and the combination of pixel values at the same point on different
wavelength bands. It also allowed them to view distributions of pixel values over an
image as a histogram. It is common for domain experts to stretch these histograms to
highlight the areas of pixel values of most interest (Richards, 1993).
Many automated image classifiers use a parametric classification of pixels
(Wilkinson, 1996). These classifiers rely on a pixel value alone rather than on
identifying geometric patterns. This is partly due to the dichotomy between raster and
vector representation of features. Raster representations are often classified pixel by
pixel, while vector representations are more useful when defining spatial
relationships. To put it another way some scene primitives may be identified by
per-pixel classification, but beyond that spatial analysis of vectors is required.
In inteipreting data, humans can rarely operate with more than two images
simultaneously and as a result much information held in other dimensions is
overlooked. GIS classification systems overcome that to a certain extent, but there are
often large amounts of information which goes unchecked (Openshaw, 1993).
2.5 VERIFICATION OF EXPERT INTERPRETATIONS
Verification has been defined as building a product correctly (without errors) while
validation is building the right product; one which meets the user's requirements
(McGraw and Harbison-Briggs, 1989).
Verification and validation of knowledge-bases encompass four main activities
(Meseguer and Preece, 1995):
• Inspection
• Static verification
• Empirical testing
Inspection aims to detect semantically incorrect knowledge in a knowledge-base and
is a manual operation. This is normally done by either the original expert or, ideally,
another expert in the knowledge domain. To aid this process the knowledge should be
in a form easily understood by the domain expert.
Static verification is a check for anomalies in the knowledge-base. An anomaly is a
static pattern in the knowledge-base structure which suggests an error in the encoded
knowledge.
Empirical testing involves applying the knowledge-base to sample data sets. This
would include applying the knowledge-base to a range of images after training on one
or more image sets.
Empirical evaluation is the validation stage and determines the effectiveness of the
operational expert system as far as the final user is concerned. It includes technical
performance and applicability.
Verification of classified images presents unique problems. Ground truthing, which is
the traditional way to verify geographic classification, is subject to error (Congalton,
1991). Firstly if the feature being studied varies rapidly over time, records of the
feature may not exist unless it was being closely monitored. This is particularly true
for atmospheric phenomena such as clouds and in agricultural systems around harvest
time. Secondly it may be impossible or impractical to ground truth, in the case of mid
ocean and polar features for example. Lastly it may be difficult to precisely locate a
feature on the ground. In all cases there is some level of sampling and extrapolation.
Sea ice ship-borne verification is inevitably a linear transect. Forestry sampling is
done with random quadrants.
Verification must be systematic. Vicat et al (1995) suggest a verification model based
on knowledge modelling and integrated into the knowledge-base construction life
cycle. Rouge et al (1995) support this approach where a formalism based on the
2.6 THE NEEDS OF A VISUAL GEOGRAPHIC KNOWLEDGE
ACQUISITION SYSTEM
Given that geographic knowledge is visual and that domain experts work with images,
a graphical system is required. Secondly, the level of computer familiarity may be
low. Any system would therefore have to be easy to use and ideally operate in a way
the domain expert understands (Kuhn, 1993). Since a domain expert can rarely work
with more than two images at a time the system should also collect information from
other bands and allow the user to rapidly change between bands. The knowledge
generated by the system should be easily verifiable (although the problems of ground
truthing are not going to be overcome).
2.7 A PROPOSED CLASSIFICATION OF GEOGRAPHIC KNOWLEDGE
The following classification is derived from and expands on those of McKeown, et al
(1989) and Armstrong (1991). It is more rigorous and incorporates non-visual
knowledge. It consists of six levels of knowledge which are:
Primitive Knowledge about the identification of scene primitives. A primitive is a
readily identifiable point, line or areal object which cannot be subdivided into smaller
named entities. This includes knowledge about an object's size and shape if relevant.
Relationship Knowledge of the spatial relationships between scene primitives in
terms of their proximity, orientation and degree of overlap.
Assembly Knowledge, used to define collections of objects which form identifiable
spatial decompositions. This includes knowledge of the spatial density of primitives.
Non-Visual Knowledge which helps refine classifications developed using visual
knowledge including labelling of scene primitives and spatial relationships. It consists
of:
• temporal knowledge of how a scene changes over time.
• algorithmic knowledge, including how to combine bands.
• heuristic knowledge of a non-visual nature.
Consolidation Knowledge used to resolve and evaluate conflicting information.
Interpretation Knowledge of how to combine the other five types of knowledge to
produce a classified image.
2.7.1 Primitive Knowledge
A primary function of any automated image interpretation system is to identify the
objects that make up a scene. An unclassified image consists of pixels each of which
has a value assigned to this. From this image objects or scene primitives need to be
extracted. Scene primitives fall into three categories; points, lines and areas. They can
each be given a name and they cannot be subdivided. They are the basic building
blocks of any GIS. The attributes of objects depend on their category and are
summarised in Table 2.1
OBJECT CATEGORY ATTRIBUTES
Point location
Line location Length shape
Area location (of centroid)
size shape spectral
signature
Table 2.1 Primitive objects and their attributes
One of the primary aims of many systems is to identify and classify these scene
by a segmentation program which assigns unique identities to each primitive of a class
(Gerbrands, 1993).
2.7.2 Relationship Knowledge
Knowledge about the spatial relationship between scene primitives falls into three
categories:
• Proximity of the objects,
• Direction of one object in relation to the other, and
• Degree of overlap of objects.
Proximity can be measured in a number of ways. For example, the proximity of the
two areal objects' centroids or, the proximity of the closest edge pixels (assuming the
two objects do not overlap). Generally the measurement is a fuzzy concept with terms
like near and very near being used.
Direction is generally best measured in relation to two points; for example two
centroids. It is normally not worth classifying to less than 450 as users tend only to
think in terms of north, south, east and west with north-west south-west south-east arid
north-east only rarely being used. (Egenhofer, 1995)
Degree of overlap is generally defined using the terms disjoint, touches, overlap,
covers, and encloses. Eight basic forms have been identified (Egenhofer, 1991), but
many more variations, especially with lines have been described.
2.7.3 Assembly Knowledge
Assembly Knowledge is knowledge about combinations of Primitive and Relationship
Knowledge. At its most basic, it describes how related groups of scene primitives are
grouped and classified as a larger entity. This may also include other 'Assembled'
objects resulting in a hierarchy. These assembled objects or components can then be
Assembly Knowledge also includes:
• The density of components both by number and by area,
• The ratio of components (number of one object type in relation to others) and
• The required existence of certain key components and the possibility of optional
components or atypical components.
Assembly Knowledge is also knowledge required for generalisation. That is
simplification by replacing groups of features with a single feature. For example a
group of objects representing paddocks could be replaced by a single object
representing a farm.
2.7.4 Non-Visual Knowledge
Despite geographic and spatial knowledge being primarily visual, there are a number
of non-visual aspects which need to be considered. These may be important in further
refining the classification of an image. Armstrong's (1991) Procedural Knowledge
has already been identified as a necessary inclusion in a classification. Other
non-visual knowledge includes knowledge of change over time (temporal) and
heuristic knowledge.
2.7.5 Temporal Knowledge
Temporal knowledge may have a visual aspect to it. For example a feature that is in
the image in time 1 may not be present or may have moved in time 2. This is
particularly true for meteorological applications. Other information however may only
become apparent as a pattern when historical data is examined. Such information may
include crop rotations, herbicide withholding periods, changes in demand for a
particular crop. This knowledge may be held mentally by a domain expert or may
come from analysis of data in a database system associated with a GIS. The term for
2.7.6 Algorithmic Knowledge
Remote sensing in particular uses algorithms to analyse images. They include image
pre-processing algorithms to carry out geographic registration and radiometric
calibration, algorithms to combine satellite image bands into composite images and
various statistical classifiers such as maximum likelihood and minimum distance
classifiers (Lillesand and Kiefer, 1994).
2.7.7 Heuristic Knowledge
Heuristics are shortcuts which domain experts use to complete their tasks. The ability
to use such heuristics is often what distinguishes an expert from other practitioners in
a field. They may not be based on visible clues, but rather something the expert has
•found from experience. For example, potato crops are less likely to be planted to the
east (with a prevailing westerly wind) of poppy crops because spray drift from poppies
is harmful to potatoes. Heuristics are informal methods based primarily on human
intuition (Bonnet et al, 1988). They may not work in all cases, but a greater problem is
that they are often difficult for a domain expert to verbalise.
2.7.8 Consolidation Knowledge
Consolidation knowledge is the knowledge required to integrate the knowledge-bases
which have been generated by the rest of the system. This includes the knowledge
gained from a number of training images and from a number of domain experts. If
more than one expert is available they may use different rules or visual clues to
identify features. The same expert may also use different techniques at times. The
knowledge acquired therefore needs to be checked for consistency. Possible outcomes
include the most general or the most restrictive rule set. Knowledge at this level will
identify and try to resolve conflicts within the component knowledge-bases and
2.7.9 Interpretation Knowledge
Interpretation knowledge is knowledge of how to apply specific knowledge-bases to
an unclassified image to produce a classified image for a specific domain. For
knowledge-bases that span several domains this will include the type of classification
that is being undertaken. For example a knowledge-base containing rules about soil
type may be used along with other knowledge-bases in both vegetation and
geomorphological classification systems. There needs to be meta knowledge on how
this is to be done.
2.8 VISUAL KNOWLEDGE AND KADS
KADS (Knowledge Acquisition and Development System) has been presented as a
development methodology for expert systems and classifies knowledge into a number
of types (Breuker and Wielinga, 1987, Schreiber et al, 1993). Since this classification
scheme is accepted as a standard in many areas it is useful to compare it with the
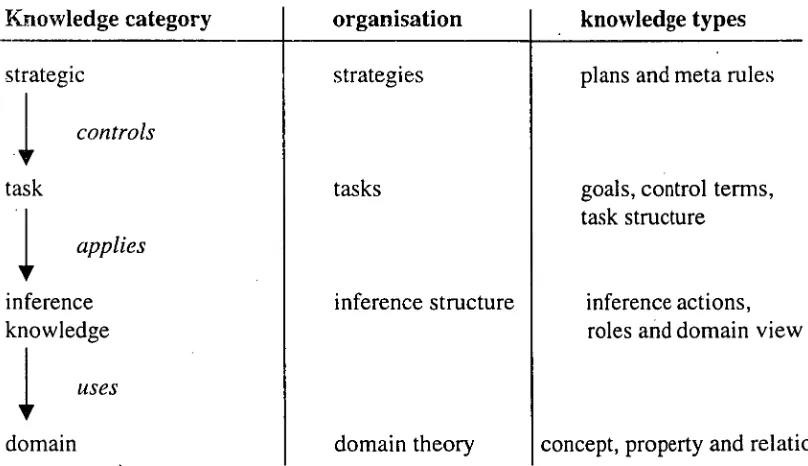
classification of geographic knowledge presented above. The KADS model proposes
a four layer model of expertise which is shown in Figure 2.2.
Knowledge category organisation knowledge types
strategies
tasks
inference structure strategic
N1'
controls
task
applies
inference knowledge
uses
domain domain theory
plans and meta rules
goals, control terms, task structure
inference actions, roles and domain view
[image:39.559.83.487.471.704.2]concept, property and relation
The KADS Domain Layer is static knowledge describing a declarative theory of the
domain. Knowledge at this level should be represented in a way that is independent of
the way in which it is to be used. It should define the conceptualisation and declarative
theory of the problem domain and provide the knowledge to carry out given tasks. The
other layers contain knowledge to control the use of knowledge from the domain layer
(Fensel and Van Harmelen, 1994).
The Inference Layer specifies how to use the knowledge from the domain layer. It
restricts the use of the domain layer and abstracts from it. The Task Layer represents a
fixed strategy for achieving problem solving goals. The final level of control
knowledge is the Strategy Layer which involves knowledge of how to choose between
various tasks that when completed successfully achieve the same goal. A formal
specification language has been developed to record knowledge in each of the layers
(Schreiber et al, 1994).
In terms of the suggested geographic knowledge classification, Primitive, Relationship
and Assembly Knowledge are forms of knowledge at the Domain Level under the
KADS methodology as is Heuristic knowledge in the Non-Visual category. This
knowledge could be used in a variety of different ways to produce products showing
different aspects of an area covered by an image
Consolidation Knowledge on the other hand requires knowledge of how the rules are
to be applied and is knowledge at the Inference level. Algorithmic Knowledge which
contains knowledge of image band combinations and when they should be applied is
also at the Inference level. Knowledge at this level will be applied according to the use
to be made of the final classified image.
The Task Level in the KADS system is represented by Interpretation Knowledge and
shows how to apply the problem solving strategy to the whole image set. Depending
on the objective of the system different strategies can be used, including the masking
In the suggested geographic knowledge classification, there is no equivalent of the
Strategy Layer as no attempt has been made to create a knowledge category which
contains alternate ways of classifying images. This could change in the future when
choices need to be made between using rules developed from machine learning, neural
nets or rules elicited from domain experts to classify images.
2.9 CONCLUSION
Geographic knowledge used in interpreting remotely sensed images is essentially
visual.
When developing a theory of geographic knowledge acquisition, it is desirable to
develop a general model of the knowledge types which are to be acquired. Once this
has been established, tools and techniques for eliciting this knowledge can be
developed. The proposed six level geographic knowledge classification, which has
equivalences in the KADS methodology, is such a model and will be used through the
Chapter 3. KNOWLEDGE-BASED SPATIAL
INFORMATION SYSTEMS
This chapter investigates Geographic Information Systems (GIS) and their relationship
with remote sensing and knowledge-based systems. The data structures and processing
requirements necessary in a spatial system are considered.
To implement rules on spatial reasoning there must be an understanding of the way
GIS information is stored and processed. This is the basis of selecting appropriate
knowledge-base structures for use in a geographic environment.
The final section of this chapter is a survey of expert systems which have been
developed and used in geographic and remote sensing environments.
3.1 GEOGRAPHIC INFORMATION SYSTEMS
It is not an aim of this thesis to develop a geographic information system (GIS).
However, because a study of knowledge acquisition for expert systems used with GIS
is the primary aim of the research, there must be a discussion of GIS systems. In such
a discussion it is useful to begin with a definition:
"A geographic information system (GIS) is a computer-based information system that
enables the capture, modeling, manipulation, retrieval, analysis and presentation of
geographically referenced data" (Vsforboys, 1995, pl)
The fundamental part of a GIS is a database, and fundamental to that is the
development of a data model. Another major component of the system is a user
interface with which a user can input, manipulate and display information from the
database in the form of a map or image. In current technology this takes the form of a
graphical user interface. Therefore one needs to be able to input information into a
system, store it and then manipulate it. One of the functions of an expert system linked
QUERIES USER
INTERFACE
DATA INPUT
MAPS & REPORTS
DATABASE: Location Topography
Attributes
TRANSFORMATION AND ANALYSIS
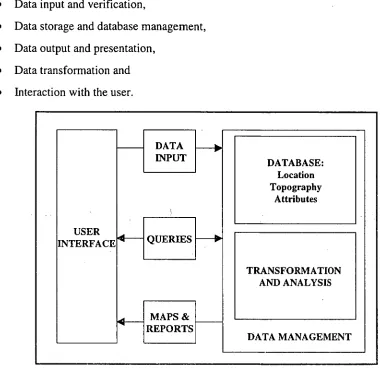
DATA MANAGEMENT Burroughs (1990) defines the following five components of a GIS:
• Data input and verification,
• Data storage and database management,
• Data output and presentation,
• Data transformation and
[image:43.557.88.468.117.493.2]• Interaction with the user.
Figure 3.1 Components of a GIS
These are shown in Figure 3.1 where output and presentation is subdivided into
queries and maps and reports. In this model data storage (or database) is grouped
with transformation and analysis under data management.
3.1.1 Data Input and Verification
There are many sources of data that can be used as input to a geographic information
system. These include traditional text files, field observation data, drawings, maps,
tables and airborne and satellite sensors. Because of this, the input devices used
One problem, which is not confined to GIS, is the quality of input data (Star and
Estes, 1990) which in turn affects the quality of the output. Since GIS allow a user to
combine data from a number of sources, many have built in verification routines
which alert users to potential errors. Despite this, it is up to the user to record which
are the more unreliable data sources. By using an expert system to preprocess some of
this data, the quality of the data can be improved.
3.1.2 Data Output and Presentation
The data output component of a GIS incorporates many of the features typical of
computer aided design packages (CAD). The output is displayed on a VDU screen or
can be plotted for hardcopy. This output may be in the form of statistical reports,
maps including three-dimensional topographic representations and various types of
graphs.
3.1.3 Data Transformation and Analysis
This component of the GIS allows data to be transformed into information. Individual
packages have different features. Burroughs (1990) classified data transformation
functions into:
• Rotation,
• Stretching to a new scale,
• Transformation of scale and projections,
• Zooming,
• Joining,
• Polygon overlay,
• Smoothing and
• Data reduction or generalisation.
Since these functions are built into GIS it makes sense to use them before passing