Changes in the Wage Structure
and Participation in Education
and Training for Young People:
An Analysis of the England and
Wales Youth Cohort Study
R
E S E A RC H
David Wilkinson
Policy Studies Institute
Research Report No 306
Changes in the Wage Structure
and Participation in Education
and Training for Young People:
An Analysis of the England and
Wales Youth Cohort Study
David Wilkinson
Policy Studies Institute
The views expressed in this report are the authors' and do not necessarily reflect those of the Department for Education and Skills. © Queen’s Printer 2001. Published with the permission of DfES on behalf of the Controller of Her Majesty's Stationery Office. Applications for reproduction should be made in writing to The Crown Copyright Unit, Her Majesty's Stationery Office, St Clements House, 2-16 Colegate, Norwich NR3 1BQ.
ACKNOWLEDGEMENTS
This study forms part of a continuing programme of analysis of the England and Wales Youth Cohort Study (YCS). Both data collection and analysis of YCS are funded by the Department for Education and Skills.
The data used in the report come from YCS Cohorts 8, 9 and 10. The surveys for Sweep 1 of Cohort 8 and Sweep 1 of Cohort 9 were designed and conducted by The National Centre for Social Research (formerly known as SCPR). Sweep2 of Cohort 8, Sweeps 2 and 3 of Cohort 9 and Sweep 1 of Cohort 10 were designed and conducted by Research Surveys of Great Britain. Thanks are due to both organisations for making the data available and for help with queries. Thanks are also owed to Karen Mackinnon of the Policy Studies Institute for her highly efficient help in setting up the data and to Joan Payne of the Policy Studies Institute for her advice and support in carrying out the analysis.
The author wishes to thank the DfES research and policy specialists and colleagues at the Policy Studies Institutes who made useful comments on preliminary findings during oral presentations.
DISCLAIMER
CONTENTS
EXECUTIVE SUMMARY... 1
1 INTRODUCTION... 7
Background ...7
Aims of the report...9
Structure of the report...10
2 THE DATA... 11
The England and Wales Youth Cohort Study...11
Main activity by age...13
3 PAY LEVELS AND DISTRIBUTION... 15
Introduction...15
Jobs and training ...15
Jobs and training by main activity ...16
The level and distribution of pay...17
The level and distribution of pay by main activity...24
4 TRAINING RECEIPT FOR THOSE IN WORK... 29
Introduction...29
Training receipt by main activity ...29
Models of training receipt ...31
5 PAY EXPECTATIONS AND RESERVATION PAY... 38
Introduction...38
Interpretation issues...39
Whether looking for a full-time job...40
Whether looking for a full-time job by main activity...40
Pay expectations ...41
Reservation pay...43
6 CONCLUSIONS... 47
REFERENCES...49
APPENDIX 1: REGRESSION MODEL FOR LOG USUAL TAKE HOME HOURLY EARNINGS...50
LIST OF TABLES
Page
2.1 Dates for YCS Cohort 8, 9 and 10 interviews at age 16/17 and 18/19... 12
2.2 Main activity in the spring at age 16/17 and age 18/19: 1998 and 2000 ... 13
3.1 Percentage of young people currently in job or training by age... 16
3.2 Main activity of young people currently in job or training by age... 17
3.3 The mean and distribution of real earnings and hours... 18
3.4a The mean and distribution of real earnings and hours at age 18/19 by main activity ... 27
3.4b The mean and distribution of real earnings and hours at age 16/17 by main activity ... 28
4.1 Percentage of young people receiving training in the last four weeks by age and main activity30 4.2a Logistic regression model for receipt of on-the-job training in the previous four weeks: young people whose main activity at age 16/17 was GST or a job ... 35
4.2b Logistic regression model for receipt of on-the-job training in the previous four weeks: young people whose main activity at age 18/19 was GST or a job ... 36
4.2c Logistic regression model for receipt of off-the-job training in the previous four weeks: young people whose main activity at age 18/19 was GST or a job ... 37
5.1 Percentage in or looking for full-time work by age group ... 40
5.2 Percentage looking for a full-time job by age and main activity... 41
5.3 The mean and distribution of real weekly earnings expectations by age and main activity... 45
5.4 The mean and distribution of real weekly reservation expectations by age and main activity.. 46
A1.1 Regression models for log usual take home earnings... 50
LIST OF CHARTS
3.1a The distribution of real hourly pay at age 18/19, 1998 and 2000... 223.1b The distribution of real hourly pay at age 16/17, 1998 and 2000... 23
1
EXECUTIVE SUMMARY
Introduction
Recent policy changes may have had a significant impact on the wage structure for young people. Such changes may influence participation rates in education and training for a number of reasons. The relative levels of income that young people receive in each of the three main routes available to them at age 16 - full-time education, a job or government supported training (GST) - may influence their choices at this age. Furthermore, an increase in wages for young people could also reduce the willingness of employers to offer training.
Policy interest in removing financial barriers to educational participation is evident through current pilots of Educational Maintenance Allowances (EMAs). However, if the level of wages from jobs available to 16 and 17 year olds increased, the impact of EMAs on educational participation could be undermined.
There is good reason to believe that there may have been a significant change in the wage structure for young people as a result of the introduction of the National Minimum Wage (NMW) in April 1999. The legislation applies to workers aged 18 and over, however, despite their exclusion from the legislation, it is nevertheless possible that if the wages of older workers increased as a result of the NMW, then the wages of 16 and 17 year olds might also have risen.
The main aim of this report is to identify whether there was any change in the level and distribution of pay of young workers between 1998 and 2000. The report also considers changes in the probability of receiving both on-the-job and off-the-job training between 1998 and 2000. Further to examining questions on actual pay rates we also consider whether there have been any associated changes in both pay
2
The Data
The report is based on analysis of the England and Wales Youth Cohort Study (YCS), a regular survey which tracks a large nationally representative sample of young people between the ages of 16 and 19 through postal questionnaires and telephone interviews. This report draws on data from YCS Cohorts 8, 9 and 10, which has information on people reaching minimum school leaving age in summer 1996, 1998 and 2000. Comparisons are made for individuals aged 16/17 using data from Cohorts 9 and 10 in 1998 and 2000 and individuals aged 18/19 in the same years using data from Cohorts 8 and 9. At each age in each year the single largest group within the cohort was in full-time education. However, there were also significant numbers in jobs and training at both ages.
Pay Levels and Distribution
The NMW applies to workers aged 18 and over with a minimum rate in spring 2000 of £3.00 per hour for workers aged between 18 and 21 and a higher rate of £3.60 per hour for older workers. Before its introduction, around one in seven workers aged 18 to 21 were paid below £3.00 per hour, hence we would expect to see changes in the wage structure at age 18/19. It is unclear whether there will be similar wage
adjustments for workers under the age of 18. If pay differentials between older and younger workers are maintained, or going rates for particular jobs are up-rated in line with the NMW, then we may also find changes in the structure of wages at age 16/17.
The analysis here is complicated slightly by definitional differences. The NMW applies to gross earnings, whilst the YCS questions on pay relate to take home pay. The differences between take home and gross pay need to be born in mind throughout the analysis. Although there will clearly be differences in the levels of these two pay measures, they will still move in the same direction. An increase in gross pay as a response to the NMW will be reflected in an increase in take home pay in the YCS data.
3
their main activity. At age 18/19 two-thirds of young people were in a job or training in both years, with roughly three out of ten of these having full-time education as their main activity.
At both ages average real hourly earnings increased for all people in jobs or training by five per cent between 1998 and 2000. At the bottom of the distribution the increase
was much greater than at the top. At age 18/19, earnings at the 10th percentile
increased by 14 per cent, whilst median earnings increased by four per cent and there
was no change at the 90th percentile. Similarly at age 16/17 earnings at the 10th
percentile increased by 19 per cent, whilst median earnings and earnings at the 90th
percentile increased by just three per cent and two per cent respectively.
Looking at 1998 earnings levels, the median for both ages was above £3.00 per hour, the NMW rate for 18-21 year-olds, hence it is only where 1998 earnings were below the NMW rate that we see large increases in pay between 1998 and 2000. It is also notable that the increase at the bottom of the earnings distribution was large at age 16/17 as well as at age 18/19, suggesting that the NMW had an impact on pay even below age 18, the lowest age to which it applies.
There is also some evidence of clustering of pay close to both the age 18-21 NMW rate and the higher rate for people aged over. This analysis is made difficult by the fact that YCS only has data on take-home pay. However, at age 18/19, hourly pay is most frequent in the £3.20-£3.40 pay band in 1998, which is broadly equivalent to the NMW rate for gross pay that applied to workers aged over 21 from April 1999
onwards. This suggests that some employers adjusted pay in line with the NMW before it was introduced.
At age 16/17 hourly pay in 1998 was more common in two bands: the £2.60-£2.80 band, broadly equivalent to the NMW rate at age 18-21, and the £3.20-£3.40 pay band, broadly equivalent to the NMW rate that applied to workers aged over 21.
4
Looking at pay by main activity, we find that people who were on GST received the lowest pay in both years and also received the greatest increase in pay. In general, at both ages, the changes in hourly pay are consistent with the aggregate picture and also consistent with changes as a result of the introduction of the NMW.
Training Receipt for Those in Work
One of the main concerns about the increases in earnings for young workers identified above is that employers may offset having to pay higher wages by reducing the
amount of training available for young workers. It is therefore important to assess whether young workers are also less likely to receive training.
The YCS allows a separate assessment of both on-the-job and off-the-job training, although because of changes in the questionnaire between Cohorts 9 and 10 it is not possible to provide an assessment of changes in off-the-job training at age 16/17. Roughly a quarter of young people of both ages received some on-the-job training in the last four weeks in both years, whilst one-in-ten people aged 18/19 received off-the-job training. There is considerable variation by main activity, with people in GST most likely to have received training, and people in part-time jobs less likely to have received training.
After controlling for a range of determinants of training we find that 16/17 year-olds were less likely to receive on-the-job training in 2000 than in 1998. This fall in the probability of receiving on-the-job training was limited to those young people who were in a full-time job. Further investigation of this effect tried to determine whether this change was a result of changes in pay. There was no evidence that the fall in on-the-job training receipt for people aged 16/17 had anything to do with changes in pay.
5
and a fall in training receipt for people in part-time jobs. Analysis of whether these changes were related to pay changes again found no evidence that this was the case.
Pay Expectations and Reservation Pay
The final piece of analysis focuses on measures of pay expectations and reservation pay. These measures may be related to the choice about whether to take up a full-time job or stay in full-time education. Young people who were not currently in a full-time job and who were looking for a full-time job were asked the following:
"If you were to start a full-time job in the next few months, how much weekly take home pay would you expect to earn?"
"What is the lowest weekly take-home pay you would consider for a full-time job?"
There is some evidence from other surveys that these concepts are unclear in the minds of respondents. Four out of five people reported that they set their reservation wage by reference to their household out goings, whilst factors that related to the labour market were considered influential in setting the reservation wage by only a few people. This is a very important issue and here the analysis of these measures is mainly concerned with determining whether it is believable that the questions have a labour market interpretation.
In both 1998 and 2000, roughly one in five of 16/17 year-olds and a similar proportion of 18/19 year-olds were not in a time job and were looking for full-time work. These included many whose main activity was full-full-time education. In all, around one-fifth of young people in full-time education were looking for a full-time job, whilst the majority of young people whose main activity was a part-time job or being out of work were looking for a full-time job.
6
ages at both extremes of the distribution, but not at the median. Similar changes were evident in our measure of reservation pay, although for young people who were in full-time education the increase was exclusively at the top of the distribution at age 18/19 and there were falls in reservation pay across the distribution at age 16/17.
These changes do not appear to be related to the introduction of the NMW and as such support the earlier assertion that these types of question do not have a labour market interpretation. From this conclusion it is not possible to say any more about the possible impact of the NMW on participation in full-time education.
Conclusions
Average real hourly earnings increased between 1998 and 2000 both at age 18/19 and at age 16/17. For both ages the increases were much larger at the bottom of the earnings distribution, in particular where hourly earnings in 1998 were below the level of the NMW. We would expect such a pattern of earnings changes at age 18/19 because the NMW directly applied to workers of this age. However, the NMW does not apply to workers aged under 18, so it is interesting to find that the pattern of earnings changes at age 16/17 is consistent with changes associated with the NMW.
Changes in expected pay and reservation pay were found not to be related to the introduction of the NMW and we conclude in line with previous research that these measures do not have a clear labour market interpretation. Thus we could not assess whether the NMW had an effect on participation in full-time education beyond the simple fact that jobs may have become more attractive to young people because actual pay has increased.
7
1 INTRODUCTION
Background
Participation rates in post-compulsory full-time education in Britain are still a matter of concern, despite the rapid rise of the early 1990s, as they are lower than in many OECD countries and have declined from their mid-1990s peak. Furthermore, the children of parents in low skilled (and often poorly paid) jobs have significantly lower staying-on rates than the children of parents in higher level occupations, and short-term income considerations may be one reason for this. There are similar concerns about participation rates in training for those young people in work.
Recent policy changes may have had a significant impact on the wage structure for young people and there are at least two theoretical reasons why such changes could influence participation in education and training. First, the relative levels of income that young people receive in each of the three main routes available to them at age 16 - full-time education, a job or government supported training (GST) - may influence their choices at this age. An increase in income from a change in the wage structure may therefore lower participation rates in full-time education.
Policy interest in removing any financial barriers to educational participation is evident in the current pilots of mandatory Educational Maintenance Allowances (EMAs) that have replaced the former discretionary system. These are testing whether the availability of EMAs increases rates of participation and retention in full-time education after age 16, and the effectiveness of different levels of allowance and different modes of delivery. However, if the level of wages from jobs available to 16 and 17 year-olds increases, the impact of EMAs on educational participation could be undermined.
8
known that young people in work who receive training also receive lower wages. This may happen for a number of reasons. One factor is that young people are likely to be less productive whilst in receipt of training, so employers may pay lower wages to offset this lower productivity. The benefit to trainees is increased future productivity from the training, so they will be prepared to accept lower wages during training in exchange for higher future wages. However, employers cannot necessarily recoup the investment made in training an individual, because any individual may move to a new employer once they are fully trained. Therefore, it is optimal for employers to offer lower wages during training to offset the risk that trainees may leave their
employment.
Given this relationship, any change in the wage structure could change the incentives for employers to offer training young workers, with an increase in wages predicted to reduce the amount of training offered.
There is good reason to believe that there may have been a significant change in the wage structure for young people as a result of the introduction of the National
Minimum Wage (NMW) in April 1999. Minimum rates apply to workers aged 18 and above. There was an introductory rate of £3.00 per hour for 18-21 year olds (60p below the adult rate) and an exemption for apprentices aged 18-21. No minimum was set for workers aged under 18. Increases to these introductory rates were implemented in 2000. The rate for 18-20 year olds rose to £3.20 per hour in June 2000 and the main
rate increased to £3.70 per year in October 20001. Further increases have also been
announced to take effect in 2001, but the NMW continues not to apply to 16 or 17 year-old workers. For further details about the NMW see the two reports by the Low Pay Commission (1998, 2000).
The Government was cautious in its approach to younger workers. The announcement of the NMW rates by the President of the Board of Trade (Margaret Beckett) stated:
"We have been particularly mindful of the need to protect the position of young people. It is, in our view, essential that we avoid reducing the relative attractiveness to
1 The regulations were also amended in October 2000 so that National Traineeships were also exempt
9
young people of staying on in education and training, and avoid discouraging employers from providing training for those in work."
Despite their exclusion from the legislation, it is nevertheless possible that if the wages of older workers increased as a result of the NMW, then the wages of 16 and 17 year-olds might also have risen. For example, if there is a going rate within a firm or industry for a particular job, then we may expect to find an increase in the rate for 16 or 17 year-olds performing the same job. Similarly, there may be a fixed
differential between the rates of pay for 16 and 17 year-olds relative to older workers, so a mandatory increase for older workers may lead to increases for younger workers to minimise any change in the age specific differentials.
There may be other reasons for a change in the wage structure over the period under consideration. In April 1998 the New Deal for Young People (NDYP) was introduced for people aged 18 to 24 who had been unemployed for six months or more. NDYP offered a series of options for young people including subsidised jobs and education and training. Furthermore, there was a rapid expansion of the Modern Apprenticeship programme for young people over this period. Both of these programmes may also have changed the structure of wages for young people by influencing the supply of skilled labour. It is important that these possibilities are born in mind throughout the analysis. However, the NMW had a direct effect on pay for young people, and because of this direct impact it is likely to have had the greatest influence on changes in the structure of wages.
Aims of the report
10
questions as pay expectations and reservation pay are likely to determine whether young people remain in full-time education or move into jobs or GST.
Structure of the report
11
2 THE DATA
The England and Wales Youth Cohort Study
The analysis is based on Cohorts 8, 9 and 10 of the England and Wales Youth Cohort
Study (YCS)2. YCS is a continuing follow-up study (funded by the Department for
Education and Skills) of a series of cohorts of young people reaching minimum school leaving age. The first cohort became eligible to leave school in 1984; the tenth in summer 1999. Each cohort forms a large nationally representative random sample of young people in the relevant age group in both state and independent schools, excluding special schools. They are first surveyed in the spring following the end of the academic year in which they reach school leaving age, using a combination of postal questionnaires and telephone interviews, and are re-contacted at varying intervals thereafter.
The postal methodology together with the questionnaire's emphasis on education and training causes a response bias towards more able and more motivated young people. However, this is partially corrected by a sophisticated weighting matrix that ensures that the Sweep 1 sample is nationally representative in terms of sex, region, school type and GCSE results. Further weighting processes at Sweeps 2 and 3 correct for differential sample attrition. The appropriate weights are applied throughout this report, though where relevant, unweighted sample numbers are reported alongside weighted sample numbers.
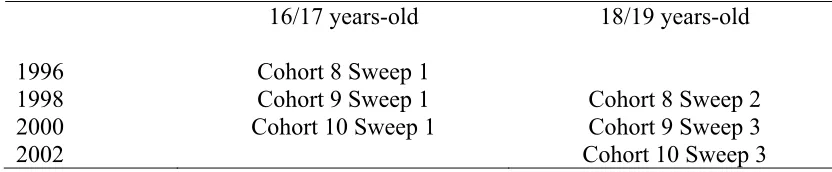
Respondents in Cohort 8 were first contacted at age 16/17 in 1996 and again in 1998 at age 18/19. For Cohorts 9 and 10 contact was at yearly intervals. The first contact for Cohort 9 was in 1998 and the third contact was in 2000 at age 18/19. The first contact for Cohort 10 was also in 2000, at age 16/17, and these respondents are expected to be contacted again at age 18/19 in 2002. These dates are set out in Table 2.1.
2 Full details of the methodology used for Cohort 8 can be found in Social and Community Planning
12
[image:17.595.82.498.244.330.2]From Cohorts 9 and 10 we therefore have information for individuals aged 16/17 in 1998 and 2000. Similarly from Cohorts 8 and 9 we have information for individuals aged 18/19 in the same years. We will attempt to identify at each age changes between 1998 and 2000 and where possible relate these changes to the possible impact of the introduction of the National Minimum Wage in 1999.
Table 2.1 Dates for YCS Cohort 8, 9 and 10 interviews at age 16/17 and 18/19.
16/17 years-old 18/19 years-old
1996 Cohort 8 Sweep 1
1998 Cohort 9 Sweep 1 Cohort 8 Sweep 2
2000 Cohort 10 Sweep 1 Cohort 9 Sweep 3
2002 Cohort 10 Sweep 3
The surveys are all quite large3, although overall response rates are not particularly
high.4 There were many changes to the design of the Sweep 1 questionnaire for
Cohort 10, which made it longer and more complex than for previous cohorts. This may explain the drop in the sweep 1 response rate to 55 per cent from 65 per cent for
Cohorts 8 and 9.5 It seems likely that response bias was increased as a result.6 This
creates a degree of discontinuity between YCS 9 and 10, because although response bias can be partially compensated for by weighting, it is unlikely to be completely eliminated. Further discontinuities are created by changes in question wording and order, and by differences in editing and coding procedures. These problems are discussed in more detail in the sections of the report where they are relevant.
3 The number of sweep one respondents was 15,899 for Cohort 8, 14,662 for Cohort 9 and 13,698 for
Cohort 10.
4 The response rates at sweep one, taking into account all sources of non-response including wrong
addresses were 65 per cent for Cohorts 8 and 9 and 55 per cent for Cohort 10.
5 These changes were due partly to a wish to meet requests for information on new topics, and partly to
a switch to a different fieldwork company.
6 Increased response bias can be inferred from the overall range of weights, which is wider in YCS 10
13
Main activity by age
In each survey there is a key question that identifies the main activity of respondents7.
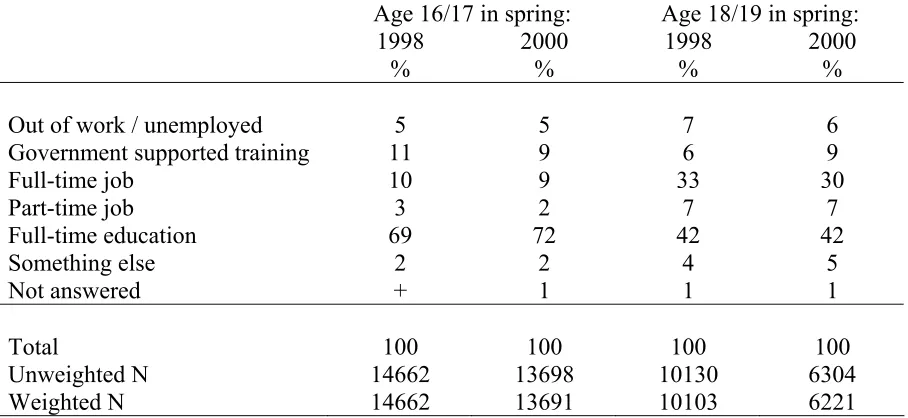
[image:18.595.86.540.204.413.2]Table 2.2 indicates the main activity reported by respondents each spring at age 16/17 and age 18/19.
Table 2.2 Main activity in the spring at age 16/17 and age 18/19: 1998 and 2000.
Age 16/17 in spring: Age 18/19 in spring:
1998 2000 1998 2000 % % % %
Out of work / unemployed 5 5 7 6
Government supported training 11 9 6 9
Full-time job 10 9 33 30
Part-time job 3 2 7 7
Full-time education 69 72 42 42
Something else 2 2 4 5
Not answered + 1 1 1
Total 100 100 100 100
Unweighted N 14662 13698 10130 6304
Weighted N 14662 13691 10103 6221
+ indicates less than 0.5 per cent but greater than 0.
Note age 16/17 in spring 1998 represents Cohort 9 and age 16/17 in spring 2000 represents Cohort 10. Similarly, age 18/19 in spring 1998 represents Cohort 8 and age 18/19 in spring 2000 represents Cohort 9.
For each age cohort in each year the largest percentage of the cohort was in full-time education: 69 per cent of 16/17 year-olds in spring 1998 and 72 per cent in spring 2000 and 42 per cent of 18/19 year-olds in both years. These YCS estimates at age 16/17 differ slightly from the official participation estimates, whilst the YCS
estimates at age 18/19 overstate the proportion in full-time education.8
7 The question for the first sweep of Cohort 9 at age 16/17 asks " We would like to know what you are
doing at the moment. Please tick one box to show us what your main activity is. The options include "out of work/unemployed"; "Modern Apprenticeship, National Traineeship or other government supported training [sometimes known as Youth Training (YT)]"; "full-time job (over 30 hours a week)"; "part-time job (if this is your main activity)"; "full-time education at school or a college of further education (or 6th form college/ tertiary college)"; "doing something else". There is space for
respondents to report what they are doing when they respond "doing something else". A similar question was asked in the cohort 10 survey and similar questions were asked at age 18/19 in Cohorts 8 and 9.
8 The official estimates of participation in full-time education in England (DfES Statistical First
14
At age 18/19 just under half of the cohort was either in a job or some form of GST in both years, with the majority of these young people in a full-time job. There is a rise in the proportion reported to be in GST, which is not evident in the official estimates, and an equivalent fall in the proportion reported to be in a full-time job. This may be a result of the introduction of the New Deal for Young People (NDYP) causing some confusion in respondents’ minds. If they were on a job-related option of NDYP then they may have reported to YCS that they were in a full-time job, whilst the official administrative figures would count them as being on GST.
At age 16/17, roughly a quarter of the cohort were in a job or GST in spring 1998 compared with roughly a fifth of the cohort in spring 2000. This fall more or less offsets the rise in the proportion of young people in full-time education. However, these apparent changes may result from a change in the design of the questionnaire between Cohorts 9 and 10.
There seems to be little evidence here that the introduction of the NMW has had any adverse affect on participation in full-time education, particularly at age 16/17. However it is possible that participation rates could have been higher still without the NMW.
based on YCS data (for example, Payne 2001), which combine information from other survey
15
3 PAY LEVELS AND DISTRIBUTION
Introduction
The main aims of the report are to determine whether there has been a change in the wage structure at age 18/19 and at age 16/17 and to see whether any identified changes can be related to the introduction of the NMW. We would expect significant changes at age 18/19 because the NMW applies directly to all workers aged 18 and over, with a minimum rate in spring 2000 of £3.00 per hour for workers aged between 18 and 21. Furthermore, Wilkinson (1998) shows that in 1998, before the introduction of the NMW, around one in seven workers aged 18 to 21 were paid below £3.00 per hour. However, it is unclear whether there will be similar wage adjustments for workers under the age of 18 and analysis of YCS data provides a good opportunity to identify any knock-on wage adjustments for younger workers.
The analysis focuses on both the level and distribution of pay, so that we can identify effects close to or below the level of the NMW. Analysis of the YCS data does not allow for a simple comparison with reported pay data and the NMW rates because the YCS survey questions are all concerned with take-home pay after deductions, but including bonuses or overtime. The NMW rates relate to pay before deductions, so comparisons are a little imprecise, although analysis of take-home pay in this context is still revealing.
Jobs and training
Before considering any information about pay we must first identify those individuals
who are currently in a job or training9. Note that young people could be in a job or
training even if their main activity was something quite different: for example, many
9 The precise question is as follows:
"At any time since the end of Year 11, have you had a full or part-time job or been in training?" If the response was yes, the respondent is routed to the following question:
"Are you currently in a full or part-time job or training?"
16
school or college students work part-time at evenings or weekends, or have full-time jobs during the holidays.
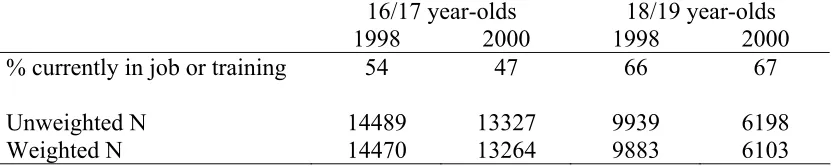
[image:21.595.87.504.357.440.2]Table 3.1 shows that in spring 1998 54 per cent of all young people aged 16/17 were currently in a job or training, as were 47 per cent of people aged 16/17 in spring 2000. At age 18/19 roughly two-thirds of all young people were in a job or training in both years. There was quite a large fall in the percentage of 16/17 year-olds in a job or training between 1998 and 2000. This partly reflects the changes identified in Table 2.2 where more young people remained in full-time education. However, this fall may also be related to the change in the wording of the questionnaire whereby in Cohort 9 the question asks about "training" whilst in Cohort 10 the questionnaire asks about "government supported training".
Table 3.1 Percentage of young people currently in job or training by age
16/17 year-olds 18/19 year-olds
1998 2000 1998 2000
% currently in job or training 54 47 66 67
Unweighted N 14489 13327 9939 6198
Weighted N 14470 13264 9883 6103
Jobs and training by main activity
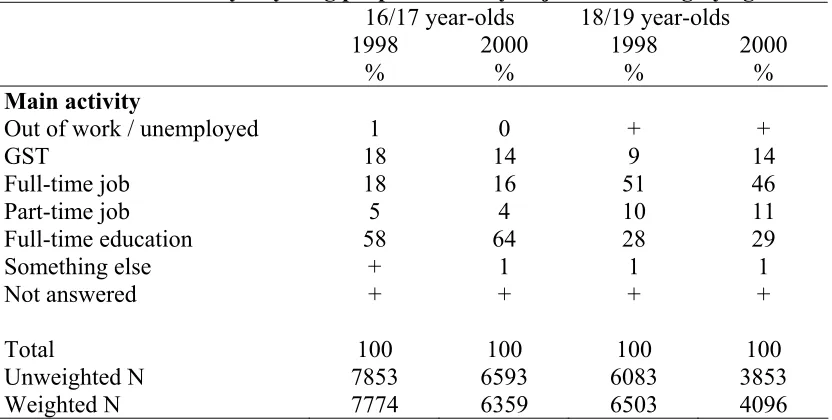
Table 3.2 gives the main activity of those in a job or training. At age 16/17 the
majority of people who were in a job or training had full-time education as their main activity (58 per cent in spring 1998 and 64 per cent in spring 2000).
17
Roughly three out of ten people in jobs or training at age 18/19 were in full-time education in both years and roughly one in ten were in a part-time job. For both age groups and in both years there was a small number of people who reported they were in a job whilst they were out of work or unemployed or whilst their main activity was doing something else (that is, not a job or training or full-time education or
[image:22.595.88.504.285.495.2]unemployed). Given these very small numbers these respondents are excluded from all subsequent analysis of jobs and pay in this report.
Table 3.2 Main activity of young people currently in job or training by age
16/17 year-olds 18/19 year-olds
1998
% 2000 % 1998 % 2000 %
Main activity
Out of work / unemployed 1 0 + +
GST 18 14 9 14
Full-time job 18 16 51 46
Part-time job 5 4 10 11
Full-time education 58 64 28 29
Something else + 1 1 1
Not answered + + + +
Total 100 100 100 100
Unweighted N 7853 6593 6083 3853
Weighted N 7774 6359 6503 4096
+ indicates less than 0.5 per cent but greater than 0.
The level and distribution of pay
18
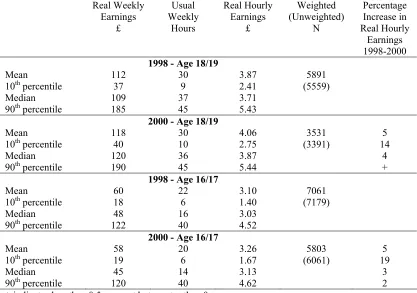
[image:23.595.85.502.225.518.2]Throughout the analysis the pay figures have been adjusted taking into account increases in average earnings. All 1998 earnings data are increased by 8.6 per cent, the equivalent of 4.2 per cent per year, in line with the increase in the Average Earnings Index between spring 1998 and spring 2000. The 2000 figures remain unadjusted, so the numbers reported here are in spring 2000 prices.
Table 3.3 The mean and distribution of real1 earnings2 and hours
Real Weekly
Earnings £ Usual Weekly Hours Real Hourly Earnings £ Weighted (Unweighted) N Percentage Increase in Real Hourly Earnings 1998-2000
1998 - Age 18/19
Mean 112 30 3.87 5891
10th percentile 37 9 2.41 (5559)
Median 109 37 3.71
90th percentile 185 45 5.43
2000 - Age 18/19
Mean 118 30 4.06 3531 5
10th percentile 40 10 2.75 (3391) 14
Median 120 36 3.87 4
90th percentile 190 45 5.44 +
1998 - Age 16/17
Mean 60 22 3.10 7061
10th percentile 18 6 1.40 (7179)
Median 48 16 3.03
90th percentile 122 40 4.52
2000 - Age 16/17
Mean 58 20 3.26 5803 5
10th percentile 19 6 1.67 (6061) 19
Median 45 14 3.13 3
90th percentile 120 40 4.62 2
+ indicates less than 0.5 per cent but greater than 0.
1. The earnings figures are adjusted by the average earnings for April to June in each year. This means that the 1998 figures are increased by 8.6 per cent, the equivalent of 4.2 per cent each year.
2. Earnings are usual take-home pay after deductions but including bonuses or overtime.
Table 3.3 gives the mean, median and 10th and 90th percentile of weekly pay, weekly
hours and hourly earnings for all 16/17 and 18/19 year-olds in jobs or training10. The
top two panels give information at age 18/19. The upper of these panels is for 1998
10 The sample excludes a small number with hourly pay of 75p or less per hour or £15 or more per
19
and the lower panel for 2000. The bottom two panels give the same information at age 16/17.
We would expect earnings to have increased by more at age 18/19 than age 16/17 since these workers are directly affected by the NMW. However, between 1998 and 2000, mean real hourly earnings increased by five per cent for both ages. This is a substantial rise at age 16/17 and suggests strongly that there were some knock-on effects on pay at this age.
In general the distribution of usual weekly hours is fairly stable between the two years for both age groups. Hence any changes in weekly earnings result from changes in hourly rates of pay. The biggest increase in real hourly earnings was at the bottom of
the earnings distribution for both ages. The 10th percentile point of the real hourly
earnings distribution increased by 14 per cent at age 18/19 and by 19 per cent at age
16/17. At the 90th percentile the increases were less than half a per cent at 18/19 and
two per cent at 16/17, and at the median they were four and three per cent respectively. To understand how these increases relate to the NMW we need to consider the level of earnings at different points of the distribution in 1998. The
NMW rate that applies to 18/19 year-olds was set at £3.00 per hour and the 10th
percentile point of earnings were well below this rate for both ages in 1998. At the
median and 90th percentile the hourly rates were already above £3.00 per hour in
1998, and at age 18/19 they were even above the adult rate of £3.60 per hour. Hence we would not expect a large increase in hourly rates at the top of the earnings
distribution except by way of maintaining some earnings differentials with lower paid workers.
20
It is also possible that employers may have anticipated the level of the NMW and raised earnings for low paid workers prior to 1998. The Government announced the NMW rates in June 1998 soon after the 1998 data being analysed was collected. However, the Low Pay Commission was appointed by Government in July 1997 to recommend the level at which the NMW should be introduced. At this time it was known that the NMW would soon come into effect, and many employers were thought to have raised pay rates for low paid workers prior to the official
announcement of the rates. This was thought to be to avoid the embarrassment of being exposed as low paying employers once the rates were announced. There was widespread speculation about the rates and coverage of the NMW for a long time prior to the official announcement of the rates, so it is certainly plausible that some adjustment may have occurred prior to 1998. It is also possible that pre-1998 adjustments were greater for workers aged 18/19 than aged 16/17 if it was expected that the NMW rates would only apply to workers aged 18 and over.
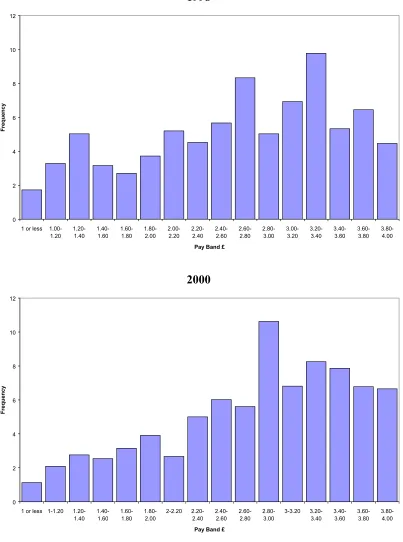
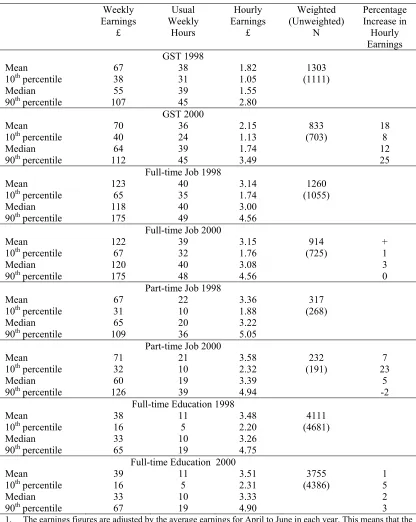
Some evidence of how earnings clustered around the NMW rates is presented in Figures 3.1a and 3.1b. Here the distribution of take-home pay in 1998 and 2000 is plotted in 20p bands up to £4 per hour. Figure 3.1a gives the distribution at age 18/19 and Figure 3.1b at age 16/17. In both Figures the top graph is for 1998 and the bottom graph is for 2000.
The pay bands include pay greater than the bottom threshold and less than or equal to the top threshold, so for example the £2.80 - £3.00 pay band includes pay above £2.80 per hour up to £3.00 per hour. Changing the thresholds to include the bottom
threshold and exclude the top threshold would change the graphs slightly. However, these figures are for take home pay and, as stated earlier, the NMW relates to gross pay, so any inferences made here are fairly rough.
The increase in the 10th percentile point is clearly shown by larger blocks for the
lower pay bands in 1998 than in 2000. Figure 3.1a also shows a peak in the 1998 earnings distribution at age 18/19 at £3.20-£3.40 per hour. This level of take-home pay roughly corresponds to gross earnings of £3.60 per hour, the adult NMW rate and suggests that some employers may have anticipated this rate and set wages
21
By 2000, when the actual minimum rates were imposed, this peak is no longer evident and earnings are more evenly distributed around this level. There is however, some evidence from the bottom graph of Figure 3.1a that take-home pay has clustered in the £2.80-£3.00 pay band. This level of take-home pay broadly corresponds to gross earnings of around £3.00 or £3.20 per hour, the former figure being the original minimum rate for workers aged 18-21 and the latter figure the minimum rate to be imposed from June 2000.
22
Figure 3.1a The distribution of real hourly pay at age 18/19, 1998 and 2000. 1998 0 2 4 6 8 10 12
1 or less 1.00-1.20 1.20-1.40 1.40-1.60 1.60-1.80 1.80-2.00 2.00-2.20 2.20-2.40 2.40-2.60 2.60-2.80 2.80-3.00 3.00-3.20 3.20-3.40 3.40-3.60 3.60-3.80 3.80-4.00
Pay Band £
Frequency 2000 0 2 4 6 8 10 12 14
1 or less 1.00-1.20 1.20-1.40 1.40-1.60 1.60-1.80 1.80-2.00 2.00-2.20 2.20-2.40 2.40-2.60 2.60-2.80 2.80-3.00 3.00-3.20 3.20-3.40 3.40-3.60 3.60-3.80 3.80-4.00
Pay Band £
Frequency
23
Figure 3.1b The distribution of real hourly pay at age 16/17, 1998 and 2000. 1998 0 2 4 6 8 10 12
1 or less 1.00-1.20 1.20-1.40 1.40-1.60 1.60-1.80 1.80-2.00 2.00-2.20 2.20-2.40 2.40-2.60 2.60-2.80 2.80-3.00 3.00-3.20 3.20-3.40 3.40-3.60 3.60-3.80 3.80-4.00
Pay Band £
Frequency 2000 0 2 4 6 8 10 12
1 or less 1-1.20 1.20-1.40 1.40-1.60 1.60-1.80 1.80-2.00 2-2.20 2.20-2.40 2.40-2.60 2.60-2.80 2.80-3.00 3-3.20 3.20-3.40 3.40-3.60 3.60-3.80 3.80-4.00
Pay Band £
Frequency
24
Table 3.3 and Figures 3.1a and 3.1b indicate a change in the wage structure at age 16/17 as well as at age 18/19 between 1998 and 2000. The evidence is in line with the changes being a result of the introduction of the NMW. The largest increases occur at a level of pay that was below the minimum rate before introduction and there is some evidence of a clustering of earnings at around the minimum rates. As noted in Chapter One there were other changes in the youth labour market that may have altered the structure of wages between 1998 and 2000. However, the changes identified here are consistent with the impact of the National Minimum Wage and this policy is likely to have had the most direct influence on pay. Hence it seems robust to conclude from here that the identified changes are primarily due to the introduction of minimum rates of pay for workers aged 18 and above.
The level and distribution of pay by main activity
We can investigate the data a little more closely by considering changes in the wage structure by the main activity of the respondent; see Table 3.4a for these changes at age 18/19 and Table 3.4b for changes at age 16/17. The estimates for those in GST at age 18/19 and in part-time jobs at ages 16/17 and 18/19 are based on quite small sample numbers so should be treated with some caution, particular when considering the extremes of the pay distribution.
Comparing mean real hourly earnings at age 18/19 by main activity shows that those in GST received on average the lowest pay. Mean earnings for those in GST in 1998 were just £2.75 per hour, below the NMW rate, whilst the mean for the other main activities were well above the NMW rate. In line with the analysis presented in Table 3.3 the increase in mean wages between 1998 and 2000 was largest for those with the lowest wage in 1998, that is young people in GST. Mean hourly earnings for these people increased by 13 per cent compared to seven, one and one per cent for those whose main activities were a full-time job, a part-time job and full-time education respectively.
Again the largest increases were at the 10th percentile for the categories which had
hourly earnings at the 10th percentile below £3.00 per hour in 1998. For GST hourly
25
part-time job 11 per cent. There was little change in hourly earnings at the 10th
percentile for those in full-time education, but this is the only activity where hourly
earnings at the 10th percentile were already above £3.00 per hour in 1998.
Moving further up the earnings distribution, median earnings in GST were also well below £3.00 per hour in 1998 and the earnings at this point of the distribution increased substantially by 17 per cent. Median earnings for all the other main
activities were already well above £3.00 per hour in 1998 and generally showed little change, the exception being the six per cent increase in median earnings for those in a
full-time job. Similarly earnings at the 90th percentile were well above £3.00 per hour
for all activities so we would not expect the NMW to have had much impact here.
However, earnings at the 90th percentile still rose by six per cent for those in GST and
by seven per cent for those in full-time education.
A similar pattern emerges at age 16/17. GST is associated with the lowest pay levels and the largest increases in pay between 1998 and 2000. In 1998, even hourly
earnings at the 90th percentile for those in GST were below £3.00, hence the increases
in GST earnings were found across the distribution. However, the increase at the 10th
percentile was smaller than at the 90th percentile, highlighting the existence of some
very low paying GST jobs for 16/17 year-olds. There was little change in the
distribution of earnings at age 16/17 for those whose main activity was a full-time job,
despite the fact that earnings at the 10th percentile in 1998 were only £1.74 per hour. It
seems that the NMW has not impacted on pay rates here and there remain many full-time jobs for young people with very low pay. For part-full-time jobs there was a large
increase in 10th percentile earnings of 23 per cent from £1.88 to £2.32 and the largest
increase for those whose main activity was full-time education was also at the 10th
percentile.
26
27
Table 3.4a The mean and distribution of real1 earnings2 and hours at age 18/19 by main activity
Weekly Earnings £ Usual Weekly Hours Hourly Earnings £ Weighted (Unweighted) N Percentage Increase in Hourly Earnings
GST 1998
Mean 105 39 2.75 464
10th percentile 49 32 1.27 (402)
Median 100 40 2.57
90th percentile 163 48 4.26
GST 2000
Mean 122 39 3.10 296 13
10th percentile 60 35 1.65 (275) 30
Median 120 40 3.00 17
90th percentile 182 45 4.50 6
Full-time Job 1998
Mean 149 40 3.80 2636
10th percentile 100 35 2.51 (2538)
Median 141 40 3.62
90th percentile 206 48 5.23
Full-time Job 2000
Mean 158 39 4.08 1343 7
10th percentile 114 35 2.87 (1383) 14
Median 150 39 3.85 6
90th percentile 205 45 5.38 3
Part-time Job 1998
Mean 87 21 4.21 527
10th percentile 43 12 2.71 (541)
Median 84 20 4.00
90th percentile 130 30 5.80
Part-time Job 2000
Mean 88 21 4.27 312 1
10th percentile 46 12 3.00 (329) 11
Median 87 20 4.02 1
90th percentile 130 30 5.77 -1
Full-time Education 1998
Mean 56 13 4.26 1761
10th percentile 22 6 3.11 (2010)
Median 49 12 4.07
90th percentile 95 21 5.43
Full-time Education 2000
Mean 59 14 4.31 1195 1
10th percentile 25 6 3.08 (1371) -1
Median 50 12 4.00 -2
90th percentile 100 21 5.83 7
1. The earnings figures are adjusted by the average earnings for April to June in each year. This means that the 1998 figures are increased by 8.6 per cent, the equivalent of 4.2 per cent each year.
28
Table 3.4b The mean and distribution of real1 earnings2 and hours at age 16/17 by main activity
Weekly Earnings £ Usual Weekly Hours Hourly Earnings £ Weighted (Unweighted) N Percentage Increase in Hourly Earnings
GST 1998
Mean 67 38 1.82 1303
10th percentile 38 31 1.05 (1111)
Median 55 39 1.55
90th percentile 107 45 2.80
GST 2000
Mean 70 36 2.15 833 18
10th percentile 40 24 1.13 (703) 8
Median 64 39 1.74 12
90th percentile 112 45 3.49 25
Full-time Job 1998
Mean 123 40 3.14 1260
10th percentile 65 35 1.74 (1055)
Median 118 40 3.00
90th percentile 175 49 4.56
Full-time Job 2000
Mean 122 39 3.15 914 +
10th percentile 67 32 1.76 (725) 1
Median 120 40 3.08 3
90th percentile 175 48 4.56 0
Part-time Job 1998
Mean 67 22 3.36 317
10th percentile 31 10 1.88 (268)
Median 65 20 3.22
90th percentile 109 36 5.05
Part-time Job 2000
Mean 71 21 3.58 232 7
10th percentile 32 10 2.32 (191) 23
Median 60 19 3.39 5
90th percentile 126 39 4.94 -2
Full-time Education 1998
Mean 38 11 3.48 4111
10th percentile 16 5 2.20 (4681)
Median 33 10 3.26
90th percentile 65 19 4.75
Full-time Education 2000
Mean 39 11 3.51 3755 1
10th percentile 16 5 2.31 (4386) 5
Median 33 10 3.33 2
90th percentile 67 19 4.90 3
1. The earnings figures are adjusted by the average earnings for April to June in each year. This means that the 1998 figures are increased by 8.6 per cent, the equivalent of 4.2 per cent each year.
29
4 TRAINING RECEIPT FOR THOSE IN WORK
Introduction
The wage structure for young people has changed significantly between 1998 and 2000, and the changes are broadly consistent with what we would expect as a result of the introduction of the NMW. One of the main concerns about these increases in earnings for young workers is that employers may offset having to pay higher wages by reducing the amount of training available for young workers. It is well known that young people in work receive lower wages whilst they are in training. This may be because they are less productive whilst training, but there is also a risk for employers that trainees may change employers once they are fully trained. In these
circumstances employers would not recoup their investment in training, hence they offer lower wages to offset the risk that employees move to a new employer once they are fully trained. Therefore, if employers are paying higher wages to young workers as a result of the NMW, then it is important to assess whether young workers are also less likely to receive training.
Training receipt by main activity
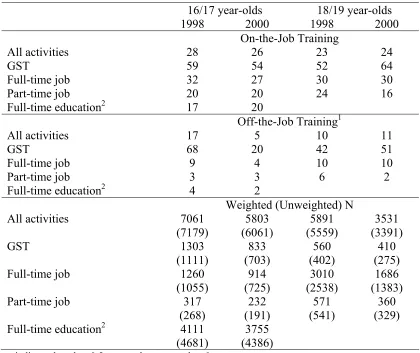
The YCS allows a separate assessment of both on-the-job and off-the-job training. Table 4.1 gives the percentage of young people receiving training in the four weeks
prior to the survey in 1998 and 2000 by age group and by main activity.11 Questions
about training receipt are only asked at age 18/19 for those whose main activity was a job or GST so there is no information for those in work whilst in full-time education. Training receipt for these young people is less important than for those in jobs because they can add to their human capital through continued education rather than through work-based training.
11 The numbers in Table 4.1 differ from those given in Payne (2001) for a number of reasons. First,
30
There is also an inconsistency in the questions asked at age 16/17 between 1998 and
[image:35.595.83.503.173.526.2]200012 such that it is not possible to analyse off-the-job training at age 16/17.
Table 4.1 Percentage of young people receiving training in the last four weeks by age and main activity
16/17 year-olds 18/19 year-olds
1998 2000 1998 2000
On-the-Job Training
All activities 28 26 23 24
GST 59 54 52 64
Full-time job 32 27 30 30
Part-time job 20 20 24 16
Full-time education2 17 20
Off-the-Job Training1
All activities 17 5 10 11
GST 68 20 42 51
Full-time job 9 4 10 10
Part-time job 3 3 6 2
Full-time education2 4 2
Weighted (Unweighted) N
All activities 7061
(7179) 5803 (6061) 5891 (5559) 3531 (3391) GST 1303
(1111) (703) 833 (402) 560 (275) 410
Full-time job 1260
(1055) 914 (725) 3010 (2538) 1686 (1383)
Part-time job 317
(268) 232 (191) 571 (541) 360 (329)
Full-time education2 4111
(4681)
3755 (4386)
+ indicates less than 0.5 per cent but greater than 0.
1. The fall in the percentage receiving off-the-job training at age 16/17 is due to change in the questionnaire between Cohorts 9 and 10, see footnote 2 for details.
2. Questions about training receipt are not asked for people in full-time education at age 18/19.
Roughly a quarter of young people of both ages received some on-the-job training in the last four weeks in both years. There is considerable variation by main activity with those in GST most likely to have received on-the-job training. At age 16/17 the
percentage receiving on-the-job training in GST fell from 59 in 1998 to 54 per cent in
12 In cohort 9 the questions asked are as follows: "Since the end of year 11, have you received any
31
2000, with a similar fall for those in a full-time job from 32 to 27 per cent. Receipt of on-the-job training at age 16/17 rose for those in full-time education.
At age 18/19 there was a large rise in the percentage receiving on-the-job training when in GST from 52 in 1998 to 64 per cent in 2000, whilst for those who were in a part-time job there was a fall in training receipt from 24 to 16 per cent. Training receipt whilst in a full-time job remained stable at 30 per cent. There was a similar pattern for the-job training at age 18/19. More young people in GST received off-the-job training in 2000 than in 1998, whilst fewer received off-off-the-job training whilst in a part-time job in 2000 than 1998. In addition, the percentage receiving off-the-job training was very low whilst in a part-time job at just six per cent in 1998 and two per cent in 2000.
Models of training receipt
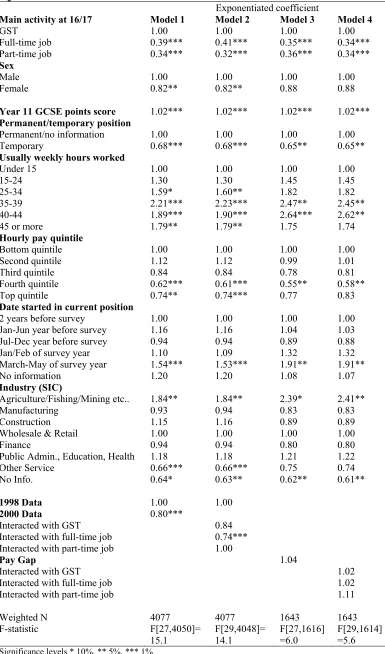
Sample sizes are not sufficient to fully investigate changes in training receipt by main activity, however we can consider aggregate training receipt controlling for other determinants of training receipt and consider interactions between this aggregate effect and main activity. Statistical models are estimated for the probability of receiving each of the types of training at each age. The estimated models are broadly similar to those estimated in Payne (2001) which includes a detailed description of these determinants. The results presented in Tables 4.2a, 4.2b and 4.2c are broadly similar to Payne's and will not be discussed here in any detail.
There are two groups of variables to focus on. The first identifies the quintile of the earnings for each individual. Here we find that for on-the-job training at age 16/17 the higher earners were less likely to receive training, whilst at age 18/19 for both types of training the earnings quintile has no effect on training receipt. This effect at age 16/17 may be because these people are either prepared to accept a lower pay in exchange for training or because employers offer lower pay whilst employees are trained because they are less productive.
The other key variables are at the bottom of the Tables. They capture changes
32
table. In the first column, changes between 1998 and 2000 that are not controlled for by the other determinants are identified by a simple dummy variable indicating the cohort to which the individual belongs. In the three tables the difference between the two cohorts is only significant in the case of on-the-job training at age 16/17. Here the reported odds ratio of 0.8 indicates that, other things being equal, in 2000 young people were less likely to receive training than in 1998. This effect could be a result of the higher wages for these workers identified above or some other effect not identified in the model.
In column two of the tables we interact the aggregate effect by main activity and get some interesting results. For on-the-job training at age 16/17, the drop in training is for those in a full-time job. When we look at these more detailed estimates at age 18/19 we find that for both types of training, training receipt for those in GST has increased, whilst training receipt for those in part-time jobs has fallen.
The next step is to try to identify whether this effect is due to higher wages or something else. The third column presents estimates from a similar equation just for 2000 data. This time a variable is included that identifies how hourly earnings have been affected by changes in the wage structure between 1998 and 2000.
A model of hourly earnings is estimated using 1998 data; see Appendix Two for the full specification. The coefficients from this model are then applied to 2000 data to give a prediction of what wages would be in 2000 if the world were the same as it was in 1998, that is before the NMW. The pay gap is then calculated as the difference between hourly earnings in 2000 and the prediction of hourly earnings. The interpretation of the variable is that it captures the change in pay as a result of the NMW.
33
34
INTERPRETING THE COEFFICIENTS OF A LOGISTIC REGRESSION MODEL
The coefficients of a logistic regression model, when exponentiated, represent the multiplicative effect of each predictor variable on the odds of the outcome being modelled - in this case getting on-the-job training (Tables 4.2a and 4.2b) or off-the-job training (Table 4.2c). The 'base' or 'reference' category of each categorical predictor variable is set to 1.00, and the effects of the other categories are assessed relative to this. Estimates less than 1.00 indicate a reduction in the odds of getting training relative to the base category, and estimates greater than 1.00 indicate an increase in the odds, after taking into account the effects of all the other variables included in the model. Thus for example, other things being equal, the odds of women receiving on-the-job training at age 16/17 are estimated to be a little over four-fifths of the odds for men.
For a continuous predictor variable like Year 11 GCSE points score, the estimate represents the multiplicative effect of a unit change in the variable. Thus in Table 4.2a each extra point of Year 11 GCSE score increases the odds of getting training by a factor of 1.02.
Note that we have talked about the odds of getting training, not the probability. Odds are an
alternative way of expressing probabilities; thus
odds=probability/(1-probability)
and probability=odds/(1+odds).
For example, if 75 out of 100 young people got training, their probability of getting training would be 0.75 or 75%, but their odds of getting training would be three to one on (3/1, or 3.00). If only 25 got training, then their probability of getting training would be 0.25 or 25%, while their odds of getting training would be three to one against (1/3, or 0.33).
It follows that the multiplicative effect of a predictor variable on the odds of getting training
is not the same as its multiplicative effect on the percentage probability of getting training.
Consider for example a hypothetical case where 75 out of 100 males and 50 out of 100 females get training. For males the odds of getting training are 75/25=3.00, while for females the odds of getting training are 50/50=1.00 (evens). In this imaginary case, being male
increases the percentage probability of getting training by a factor of 1.5 (75/50), but
increases the odds of getting training by a factor of 3.00 (3.00/1.00).
35
Table 4.2a Logistic regression model for receipt of on-the-job training in the previous four weeks: young people whose main activity at age 16/17 was GST or a job
Exponentiated coefficient
Main activity at 16/17 Model 1 Model 2 Model 3 Model 4
GST 1.00 1.00 1.00 1.00
Full-time job 0.39*** 0.41*** 0.35*** 0.34***
Part-time job 0.34*** 0.32*** 0.36*** 0.34***
Sex
Male 1.00 1.00 1.00 1.00
Female 0.82** 0.82** 0.88 0.88
Year 11 GCSE points score 1.02*** 1.02*** 1.02*** 1.02***
Permanent/temporary position
Permanent/no information 1.00 1.00 1.00 1.00
Temporary 0.68*** 0.68*** 0.65** 0.65**
Usually weekly hours worked
Under 15 1.00 1.00 1.00 1.00
15-24 1.30 1.30 1.45 1.45
25-34 1.59* 1.60** 1.82 1.82
35-39 2.21*** 2.23*** 2.47** 2.45**
40-44 1.89*** 1.90*** 2.64*** 2.62**
45 or more 1.79** 1.79** 1.75 1.74
Hourly pay quintile
Bottom quintile 1.00 1.00 1.00 1.00
Second quintile 1.12 1.12 0.99 1.01
Third quintile 0.84 0.84 0.78 0.81
Fourth quintile 0.62*** 0.61*** 0.55** 0.58**
Top quintile 0.74** 0.74*** 0.77 0.83
Date started in current position
2 years before survey 1.00 1.00 1.00 1.00 Jan-Jun year before survey 1.16 1.16 1.04 1.03 Jul-Dec year before survey 0.94 0.94 0.89 0.88 Jan/Feb of survey year 1.10 1.09 1.32 1.32 March-May of survey year 1.54*** 1.53*** 1.91** 1.91**
No information 1.20 1.20 1.08 1.07
Industry (SIC)
Agriculture/Fishing/Mining etc.. 1.84** 1.84** 2.39* 2.41**
Manufacturing 0.93 0.94 0.83 0.83
Construction 1.15 1.16 0.89 0.89
Wholesale & Retail 1.00 1.00 1.00 1.00
Finance 0.94 0.94 0.80 0.80
Public Admin., Education, Health 1.18 1.18 1.21 1.22
Other Service 0.66*** 0.66*** 0.75 0.74
No Info. 0.64* 0.63** 0.62** 0.61**
1998 Data 1.00 1.00
2000 Data 0.80***
Interacted with GST 0.84
Interacted with full-time job 0.74*** Interacted with part-time job 1.00
Pay Gap 1.04
Interacted with GST 1.02
Interacted with full-time job 1.02
Interacted with part-time job 1.11
Weighted N 4077 4077 1643 1643
F-statistic F[27,4050]=
15.1 F[29,4048]=14.1 F[27,1616]=6.0 F[29,1614]=5.6
36
Table 4.2b Logistic regression model for receipt of on-the-job training in the previous four weeks: young people whose main activity at age 18/19 was GST or a job
Exponentiated coefficient
Main activity at 18/19 Model 5 Model 6 Model 7 Model 8
GST 1.00 1.00 1.00 1.00
Full-time job 0.27*** 0.33*** 0.22*** 0.22***
Part-time job 0.20*** 0.28*** 0.14*** 0.14***
Sex
Male 1.00 1.00 1.00 1.00
Female 0.94 0.95 0.90 0.90
Exam points score 1.01*** 1.01*** 1.01*** 1.01***
Usually weekly hours worked
Under 15 1.00 1.00 1.00 1.00
15-24 1.41 1.40 1.22 1.22
25-34 1.71* 1.71* 2.52* 2.52*
35-39 2.16** 2.11** 2.56 2.56
40-44 1.74 1.69 2.00 2.00
45 or more 1.86* 1.81* 2.24 2.24
Hourly pay quintile
Bottom quintile 1.00 1.00 1.00 1.00
Second quintile 0.85 0.84 0.73 0.73
Third quintile 0.90 0.90 0.78 0.78
Fourth quintile 1.08 1.07 1.06 1.06
Top quintile 1.07 1.07 1.03 1.03
Date started in current position
2 years before survey 1.00 1.00 1.00 1.00 Jan-Jun year before survey 0.83 0.83 0.79 0.79 Jul-Dec year before survey 1.25** 1.26** 1.00 1.00 Jan-May of survey year 2.47*** 2.46*** 1.93*** 1.93***
No information 0.82 0.81 0.48 0.48
Industry (SIC)
Agriculture/Fishing/Mining etc.. 0.54** 0.55** 0.40 0.40
Manufacturing 0.73*** 0.73*** 0.67* 0.67*
Construction 1.19 1.22 1.48 1.48
Wholesale & Retail 1.00 1.00 1.00 1.00
Finance 0.97 0.97 0.96 0.96
Public Admin., Education, Health 0.92 0.91 0.99 0.99
Other Service 0.85 0.84 0.87 0.87
No Info. 0.64*** 0.63*** 0.69 0.69
1998 Data 1.00 1.00
2000 Data 1.05
Interacted with GST 1.72***
Interacted with full-time job 1.00 Interacted with part-time job 0.66*
Pay Gap 1.04
Interacted with GST 1.02
Interacted with full-time job 1.02
Interacted with part-time job 1.11
Weighted N 5468 5468 1987 1987
F-statistic F[25,5443]=
13.6 F[27,5441]=12.6 F[25,1962]=6.2 F[27,1960]=5.8
37
Table 4.2c Logistic regression model for receipt of off-the-job training in the previous four weeks: young people whose main activity at age 18/19 was GST or a job
Exponentiated coefficient
Main activity at 18/19 Model 9 Model 10 Model 11 Model 12
GST 1.00 1.00 1.00 1.00
Full-time job 0.14*** 0.17*** 0.08*** 0.10***
Part-time job 0.03*** 0.05*** 0.01*** 0.01***
Sex
Male 1.00 1.00 1.00 1.00
Female 0.81** 0.81** 0.72* 0.72*
Exam points score 1.02*** 1.02*** 1.02*** 1.02***
Usually weekly hours worked
Under 15 1.00 1.00 1.00 1.00
15-24 1.72 1.68 0.76 0.63
25-34 0.77 0.76 0.43 0.34
35-39 0.75 0.73 0.28 0.23*
40-44 0.71 0.68 0.28 0.22*
45 or more 0.71 0.69 0.20* 0.15**
Hourly pay quintile
Bottom quintile 1.00 1.00 1.00 1.00
Second quintile 1.12 1.11 1.51 1.30
Third quintile 0.89 0.89 1.57 1.29
Fourth quintile 1.02 1.00 1.21 0.93
Top quintile 1.10 1.10 1.90 1.55
Date started in current position
2 years before survey 1.00 1.00 1.00 1.00 Jan-Jun year before survey 0.64*** 0.63*** 0.82 0.81 Jul-Dec year before survey 0.72*** 0.72*** 0.89 0.90 Jan-May of survey year 0.60*** 0.60*** 0.66 0.68
No information 0.33** 0.32** 0.40 0.32
Industry (SIC)
Agriculture/Fishing/Mining etc.. 0.68 0.70 0.90 0.89
Manufacturing 0.88 0.88 0.92 0.92
Construction 1.29 1.31 1.25 1.31
Wholesale & Retail 1.00 1.00 1.00 1.00
Finance 1.13 1.12 1.15 1.19
Public Admin., Education, Health 1.22 1.21 1.18 1.15
Other Service 0.72 0.70 0.61 0.61
No Info. 0.97 0.96 0.75 0.78
1998 Data 1.00 1.00
2000 Data 1.08
Interacted with GST 1.54**
Interacted with full-time job 0.95 Interacted with part-time job 0.41**
Pay Gap 0.89
Interacted with GST 1.25
Interacted with full-time job 0.82
Interacted with part-time job 0.64
Weighted N 5468 5468 1987 1987
F-statistic F[25,5443]=
19.0 F[27,5441]=17.8 F[25,1962]=10.0 F[27,1960]=9.2
38
5 PAY EXPECTATIONS AND RESERVATION PAY
Introduction
Another concern about the introduction of the NMW was that an increase in wages would make work more attractive to young people as opposed to staying on in full-time education. It is very difficult to determine whether there has been any change in participation rates as a result of the introduction of the NMW just from studying aggregate time trends because many other factors have influenced changes in participation in full-time education.
However, the YCS data does allow some investigation of two measures that are related to the choice about whether to take up a full-time job. Young people who were not currently in a full-time job and who were looking for a full-time job were asked the following:
"If you were to start a full-time job in the next few months, how much weekly take home pay would you expect to earn?"
and
"What is the lowest weekly take-home pay you would consider for a full-time job?"