Activity Agreement Pilots
Quantitative Evaluation
Research Report DCSF-RR096
Emily Tanner, Susan Purdon, John D’Souza
and Steven Finch
Activity Agreement Pilots
Quantitative Evaluation
Emily Tanner, Susan Purdon, John D’Souza and Steven Finch
National Centre for Social Research
The views expressed in this report are the authors’ and do not necessarily reflect those of the Department for Children, Schools and Families.
© National Centre for Social Research 2009 ISBN 978 1 84775 417 2
Contents
EXECUTIVE SUMMARY ... 1
The Activity Agreement Pilots ... 1
The evaluation of AA ... 1
The quantitative evaluation ... 1
What difference did AA make? ... 2
What was the rate of take-up of AA?... 2
Who took part in AA? ... 3
Why did young people take part in AA? ... 3
What did they do on the programme? ... 3
How important were the personal advisers? ... 4
How long did participants stay on AA? ... 4
What did participants and their parents think of the AA?... 5
Conclusions... 5
1 INTRODUCTION ... 6
1.1 The Activity Agreement Pilot (AA) ... 6
Policy aims and context... 6
AA variants and payments ... 7
Eligibility requirements ... 8
One-to-one support and activities ... 8
The AA extension ... 9
1.2 The evaluation ... 9
1.3 Research design and methodology ... 10
Overall quantitative evaluation design... 10
Sample design... 11
Timing of AA participation and interviews... 11
The follow-up (‘wave 2’) survey ... 12
1.4 The report ... 13
Report structure... 13
Reporting conventions... 13
2 CHARACTERISTICS OF AA PARTICIPANTS... 14
2.1 Key Findings... 14
2.2 Introduction... 14
2.3 Definition of participants ... 14
2.4 Personal background characteristics ... 15
2.5 Family background characteristics ... 16
2.6 School attendance and GCSE attainment... 17
2.7 Activities between school and NEET... 19
2.8 Differences between participants and non-participants... 19
3 PARTICIPANTS’ EXPERIENCES OF AA ... 21
3.1 Key Findings... 21
3.2 Introduction... 22
3.3 Motivations for taking part in AA... 22
3.4 Contact with personal advisers ... 24
3.5 Time spent on AA programme ... 27
3.6 Participation in AA activities ... 29
Work experience placements ... 30
Work-related skills ... 30
Basic skills ... 31
Personal development activities ... 31
Sport or outward bound activities ... 31
3.7 AA payments and expenditure ... 32
AA payments ... 32
Expenditure ... 33
3.8 Perceived value of AA ... 34
3.9 Conclusion... 35
4 THE IMPACT OF AA ON PARTICIPANTS... 36
4.1 Key findings ... 36
4.2 Introduction... 36
4.3 How impact is measured ... 37
4.4 The impact of AA on the experiences of NEET young people ... 38
4.5 The short-term impact of AA after participation ... 42
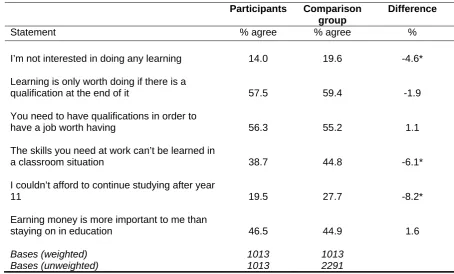
4.6 The impact of AA on attitudes towards the future, learning and work ... 44
4.7 The relationship between impact and AA participation rates... 46
4.8 Participants’ perceptions of impact... 47
4.9 Conclusions... 48
5 Conclusions ... 50
Appendix A Results tables for Chapters 2 and 3 ... 53
Appendix B Results tables for impact analysis ... 70
Appendix C Details of propensity score matching ... 77
Appendix D Impact on participants and impact on the eligible population .... 81
Appendix E The relationship between impact and the participation rate ... 83
Appendix F The NEET population: comparison between survey estimates and AA management information ... 85
Appendix G Survey methodology... 90
Acknowledgements
We would like to thank the young people and parents who gave up their time to provide information about their activities and experiences for this research. We would also like to than the staff of Connexions services who provided records of NEET young people for the sampling process and administered opt-out mailings to young people who were selected for the research.
Susanna Greenwood and Vikki McAuley managed the study for the Department of Children, Schools and Families. We are grateful for their support and for the helpful feedback that they, steering group members and other colleagues involved with the pilots provided. Our
colleagues in the consortium, particularly Jim Hillage and Claire Johnson of IES and Sue Maguire of the CEI, Warwick provided helpful comments at various stages of the process.
Within NatCen, Juliet Michaelson managed the study for most of its duration and was the lead author for the early findings report. Jenny Parfrement and Natalie Low also handled earlier stages of the study. We are also grateful to a large number of freelance face-to-face and telephone interviewers who carried out the interviews.
EXECUTIVE SUMMARY
The Activity Agreement Pilots
The Activity Agreement Pilot (AA) is an initiative aimed at testing the effectiveness of conditional financial incentives along with intensive support and brokerage of tailored activities in re-engaging young people aged 16 -17 who had been NEET for at least 20 weeks immediately prior to starting an Activity Agreement. The 2005 Budget announced an allocation of £60 million to the pilot, to support and encourage disengaged young people back into education, employment (preferably with learning) or training. The pilot was
overseen by the Department for Children, Schools and Families (DCSF) and delivered by the Connexions service in eight pilot areas in England. Each of the 8 pilot areas implemented one of three variants of the pilot, which differed in the level of the weekly payment available to the young person and in one variant a payment to the parent. The pilots began in April 2006 and initially ran for two years.
An Activity Agreement is a personally negotiated contract between a Connexions Personal Adviser and the young person. It is an individually tailored and agreed programme of activities designed to break down barriers to participation and identifies specific steps that the young person will take to move into education, employment (preferably with learning) or training. Whilst participating, young people received one-to-one support and advice and a weekly allowance - paid only if the young person fulfilled their weekly agreement.
The evaluation of AA
The evaluation of AA is being carried out by a consortium comprising the Institute for Employment Studies (IES), the Centre for Education and Industry, University of Warwick (CEI) and the National Centre for Social Research (NatCen). The evaluation has three strands:
• a quantitative evaluation, using surveys of young people to measure the impact of the pilots in comparison to a number of control areas
• a programme theory element, focusing on testing some key aspects of the policy to identify what works, what does not and the reasons for this.
• a process evaluation, examining the ways in which the pilots have been set up and delivered and the main issues associated with their implementation; and
This report presents the key findings from the quantitative evaluation which was conducted by NatCen.
The quantitative evaluation
The principal objective of the quantitative strand of the AA evaluation was to measure the effectiveness of AA in increasing young people’s participation in employment, education and training. It also included softer measures indicating ‘distance travelled’ towards this outcome. Underpinning the outcomes data, this strand also provides an insight into the experiences of young people on the AA programme, exploring their motivations for taking part, the activities they did, and the roles of personal advisers and the AA allowance in sustaining their
What difference did AA make?
The quantitative evaluation measured the impacts of AA by comparing participants with a comparison group of NEET young people with similar characteristics who lived in areas where AA did not operate. By comparing outcomes for AA participants with those for the comparison group, it was possible to infer what difference AA made, that is how many young people had outcomes that would not have otherwise happened.
The largest change that AA participation brought about was that many more NEET young people undertook personal development activities than otherwise would. With AA, around 30% of participants report doing some personal development activities (based on a description of this type of activity used in the interview) in the 12 month period after first becoming NEET. This would be just 4% without AA.
Beyond this, the impacts of AA were more modest. Around 17% of AA participants entered paid work without training in the 12 month period after first becoming NEET. This percentage would have been higher, at around 27% in the absence of AA. So AA appeared to delay some young people’s entry to paid work in the short term.
A small percentage of AA participants (around 3%) entered work-based training as a direct result of AA, and around 7% took up training towards a qualification who otherwise wouldn’t have.
The short-term (i.e. three month) post-participation impact of AA was to generate an
approximate 13 percentage point shift in outcomes: away from non-activity or employment in jobs without training and towards work-based training and studying. This was a small, but nevertheless, positive impact.
Associated with these small impacts on employment and education outcomes, AA also had a small, but positive impact on attitudes. Across a range of measures, between 5% and 10% of participants demonstrated more positive attitudes towards education, employment and the future in general as a result of their participation.
Asking AA participants directly what the impact of AA has been on them the picture is rather more positive. One plausible interpretation is that AA helps young people to attain positive outcomes even if AA is the determining factor in only a minority of cases.
What was the rate of take-up of AA?
The evaluation estimated that the take-up of AA among long-term NEET young people (the ‘eligible population’) was 19%. Thus, the 26% impact on participants’ take-up of personal development activities would imply an impact of about 5% on personal development activities for the eligible population.
Who took part in AA?
AA participants who responded to the survey were more likely to be male (58%) than female (42%). 87% were of White ethnic origin and there were similar proportions of participants who were Black (5%) and Asian (4%). Nearly all participants (96%) classified themselves as single and 83% were living with their parents. A minority were living with a partner (3%) or with others (9%). Only 9% had children, most of whom were living with them.
Of the participants who were living with their parents, a little over half (58%) had parents who had no qualifications post-16 years of age. The most common occupational classification of participants’ parents was routine and manual occupations (37%).
Less than two thirds of participants (63%) reported that they attended school regularly in their final year. 23% did not attend regularly and 14% did not attend at all. The main reasons for poor attendance were truancy (47%) and exclusion (24%).
Participants varied widely in their GCSE attainment but overall had much lower levels of attainment than the national average. Only 14% achieved 5 GCSEs at A*-C grade.
Among young people who had heard of AA, those in Variant 2 areas where the weekly allowance was highest, at £30, were more likely to take part than those in other areas.
Compared to NEET young people who did not participate in AA, participants were younger, more likely to be male and living with their parents, and less likely to have children.
Why did young people take part in AA?
When young people were asked why they took part in AA, the two most common reasons cited were to make progress towards finding a job (36%) and to have something to do (35%). A quarter of young people said that they took part to support their education, one-fifth
thought it would provide useful experience and 19% said that they took part for the money. So there was a range of motivating factors, with finding a job the most prominent among them1. Other participants sought experience that would be a first step in the direction of finding a job, such as gaining new skills and meeting people.
Although the AA payment was mentioned by some participants as a reason for taking part in the programme, it was among the less commonly mentioned reasons. When asked to give a retrospective view on the role of the payment, three quarters of participants said that they definitely or probably would have taken part without it. So only a minority of participants said that the payment had been a primary motivating factor.
Among eligible young people who decided not to take part in AA, the main reason given was the positive one that they were doing or planning to do other things (26%).
What did they do on the programme?
AA participants typically took part in a range of activities while on the programme and had positive views of the activities they took.
In a classification of activities undertaken on AA into three broad groups, job-related activities were most common (taken by 72% of participants), followed by personal development
activities (taken by 64%) and college-based activities (taken by 61%).
Among the activities undertaken by participants, work experience placements were distinctive in that they tended to last longer and were delivered to individuals on their own rather than as part of a group. Activities of this type were among those rated most positively by participants. 86% of participants of these activities said that they would be helpful for their plans for the future.
Basic skills training was also rated very positively. 85% of participants who took this training said that it would be helpful for their plans for the future.
Personal development activities varied considerably in their content and the time commitment they required but most were also rated positively. 79% of participants who attended these types of course said that they were helpful for their plans for the future.
Participants engaged in sport and outward bound activities were least likely to rate these as being helpful for future plans (44% did so). However, 77% of participants on these courses rated them as good and they gave particularly positive ratings for the leaders of the activities.
How important were the personal advisers?
The research confirmed that participants had very regular contact with their personal advisers and valued this form of individual support.
81% met their personal adviser at least once a week and the average length of session was just under an hour. Face-to-face meetings were supplemented by telephone contacts, particularly when meetings were less frequent.
91% of AA participants said that they found the support of their PA helpful.
Meetings with personal advisers were used for planning ahead and reviewing the activities of the previous week, help with looking for a job or college course and general mentoring, support or advice.
How long did participants stay on AA?
Although AA was designed to provide up to 20 weeks of support to participants, there was flexibility in the amount of time that participants stayed on it2. Only about two out of five participants stayed for the full 20 weeks.
Among participants who left AA before the 20 weeks was up, about one in three left for the positive reason of taking up work or studying while a further one in six said that they had completed the programme. The remaining half of early leavers left early for more negative reasons such as not enjoying the activities or other aspects of the package.
Participants who were involved in personal development activities stayed on the programme longer, on average, than those doing job-related activities, which is likely to be explained by those participants needing a greater level of support.
2
What did participants and their parents think of the AA?
Most AA participants had positive views of the activities they took part in and felt that they had benefited from them. A range of benefits of participation were mentioned with the most common being gaining in experience/confidence (31%), help with job preparation (26%), the advice or support from Connexions (21%), having something to do (19%), getting
qualifications or skills (18%) and getting help to find an education course (17%). This range of benefits would appear to reflect the flexible and responsive characteristics of support under AA.
Parents of participants, who were interviewed if the young person still lived in their family home, also perceived the programme to be valuable. 71% of participant’s parents thought that their son or daughter’s contacts with Connexions had been helpful for making decisions about and preparing for future activities.
Conclusions
In conclusion, the main findings were:
AA achieved a small, but positive, increase in young people’s involvement in positive activities during the first 12 months after they became NEET. The largest shift was in the proportion of young people reporting involvement in provision that met the description of personal development activities given in the interview: the findings suggest that 26% participants reported these activities who would not have done without AA. About 3% of participants entered work-based training and 7% of participants took up a qualification who would not have done without AA. On the other hand, take up of paid work without training
was lower (by about 10 percentage points) than it would have been without AA. Overall, just
29% of AA participants had done none of the activities measured (personal development activities, work-based training, other paid work, voluntary work or studying for a qualification) in the 12 months since becoming NEET compared with 42% of similar young people in comparison areas.
AA delivered a small, but positive, impact on the incidence of positive outcomes in the short-term. Among young people who completed AA within 9 months of first becoming NEET, the short-term impact of the programme (three months after leaving) was to generate a 13 percentage point positive shift in outcomes: away from non-activity or employment in jobs without training and towards work-based training and studying.
AA also achieved a small positive impact on young people’s attitudes towards the future and learning. AA participants had slightly more positive views than the comparison group about how their activities in the past year would help them in the future. They were less likely to say that their confidence had worsened in the past year and they had slightly more interest in learning. These short-term impacts on attitudes showed potential for longer-term impacts in the quality of activities taken up.
The take-up rate among the eligible long-term NEET population was between 19% and 44%. The take-up of AA among the ‘eligible population’ was 19%. However, fewer than half (44%) of the eligible population said that they had heard of AA. Of these 44% who had heard of AA, 44% took up an agreement. Therefore, over half of those eligible for AA were not aware of the programme. This will have limited the impact of AA on the whole target eligible population.
1
INTRODUCTION
The Activity Agreement Pilot (AA) is an initiative aimed at testing the effectiveness of conditional financial incentives along with intensive support and brokerage of tailored activities in re-engaging young people aged 16 -17 who had been NEET for at least 20 weeks immediately prior to starting an Activity Agreement. The 2005 Budget announced an allocation of £60 million to the pilot, to support and encourage disengaged young people back into education, employment (preferably with learning) or training. The pilot was
overseen by the Department for Children, Schools and Families (DCSF) and delivered by the Connexions service in eight pilot areas in England. Each of the 8 pilot areas implemented one of three variants of the pilot, which differed in the level of the weekly payment available to the young person and in one variant a payment to the parent. The pilots began in April 2006 and initially ran for two years.
An Activity Agreement is a personally negotiated contract between a Connexions Personal Adviser and the young person. It is an individually tailored and agreed programme of activities designed to break down barriers to participation and identifies specific steps that the young person will take to move into education, employment (preferably with learning) or training. Whilst participating, young people received one-to-one support and advice and a weekly allowance - paid only if the young person fulfilled their weekly agreement.
DCSF, formerly the Department for Education and Skills (DfES), commissioned an
evaluation of AA, carried out by the Institute for Employment Studies (IES), the Centre for Education and Industry, University of Warwick (CEI) and the National Centre for Social Research (NatCen). This consortium has evaluated AA alongside the related Learning Agreement Pilot (LAP) which is aimed at young people in jobs without training. The evaluation has three related strands: a quantitative evaluation, a programme theory evaluation and a process evaluation.
This report presents findings from the quantitative evaluation of AA, carried out by NatCen using quantitative data from a survey of eligible young people in pilot and comparison areas. It includes the findings from a follow-up survey of AA participants.
1.1 The Activity Agreement Pilot (AA)
Policy aims and context
The Government published its long term vision for a single, coherent system of financial support for 16 to 19 year olds in Supporting Young People to Achieve, alongside the 2004 Budget. The report launched a consultation including how to extend support and incentives to young people engaged in positive activities beyond formal education and training.
The following year, in the 14-19 Education and Skills White Paper (2005), the government outlined its aspiration for 90 per cent of 17 year olds to be participating in education and training by 2015, an increase of 15 per cent. The Activity Agreement policy was one of the measures designed to help meet this goal.
The stated aims of the Activity Agreement policy were:
“Re-engaging ‘long-term’ NEET by recognising and incentivising action that equips them to engage, and stay engaged, in appropriate learning and work”
“Testing the most effective financial support regime at engaging the most disaffected 16-17 year olds (those who have been NEET for 20 weeks) and informing the long-term direction of reform of financial support for 16-19s”
(AA guidance notes; DfES, 2005).
In addition to these aims, the programme theory evaluation set out to identify the theories which underpin the policymakers’ design of the programme (Simm et al, 2006).It found the following views of the main aims of AA and Learning Agreement Pilot policies among key policy stakeholders:
• Creating a more comprehensive and less divisive system of financial support for young people.
• Reaching and engaging the hardest-to-reach young people.
• Encouraging more young people into learning or training, or helping them to progress towards it.
Building on these existing policy concerns, the Leitch Review of Skills, published in
December 2006, projected a sharp decline in the number of low-skilled jobs in the economy by 2020 (HM Treasury, 2006). Following this, the government announced its plans, in the 2007 Raising Expectations: staying in education and training post-16 Green Paper, to raise the age of compulsory participation in education to 17 from 2013 and eventually to 18 (DfES, 2007). The Green Paper makes clear the government’s commitment to ‘learn from the lessons of Activity Agreements pilots’ in helping to develop future policy around participation. The commitment to raise the participation age was enshrined in the Education and Skills Act 2008. The policy focus around AA has therefore evolved from one of testing the impact of financial incentives into one of encouraging engagement within the context of raising the age of participation.
AA variants and payments
The three variants of AA were implemented in eight areas, known as the ‘pilot areas’, of which four were also implementing variants of the Learning Agreement Pilot. Under each variant, eligible young people were entitled to a weekly payment (Activity Allowance) of either £20 or £30. Under Variant 3 there were also payments of £30 a week to parents (Table 1.1).
Table 1.1 AAP variants and areas
Variant description Areas Variant 1 £20 per week to young person Kent & Medway
Tyne & Wear West Yorkshire*
Variant 2 £30 per week to young person Central London Cornwall & Devon* Greater Merseyside
Variant 3 £20 per week to young person and £30 per week to parent
Greater Manchester* London East*
While the different payment models embodied in each variant were all ‘nominally incentives to engage in the programme’ they were designed to act via different incentive and support mechanisms:
• ‘The £20 per week variant is ‘designed as an ‘incentive’ (similar to [Education
Maintenance Allowance] EMA), set at a lower amount to complement existing financial support for those who already have it’.
• The £30 per week variant is ‘designed as a ‘support’ model with a higher allowance designed to mimic an extension of JSA’.
• The combined young person and family payment variant is ‘designed as an ‘incentive and support’ model mimicking the package of financial support available to young people in full-time education from low-income households (support in the form of stable Child Benefit and Child Tax Credit paid to the parent and responsive incentive (EMA) paid to the young person)’.
(Simm et al, 2006, citing AA guidance documentation issued to Connexions).
Activity Agreement allowance payments could be paid, for a maximum of 20 weeks. Agreed short breaks of less than three weeks were allowed, but there was a non-payment sanction for absence from agreed activities which young people were told about when negotiating their agreement with their personal adviser. The process evaluation has found that most young people in fact tended to leave the programme between 12-15 weeks (Maguire et al, 2007).
Eligibility requirements
To be eligible for AA, young people needed to be aged 16 or 17 and not be in any form of employment, education or training, although they could be participating in personal development activities if not receiving a wage or allowance. To start on AA, young people must have had a continuous period of being NEET for 20 weeks or more (which could date from when they left school) immediately prior to starting an Activity Agreement. Those eligible for AA are therefore the group of ‘long-term NEET’ young people.
Young people in receipt of Jobseeker’s Allowance were not eligible for the programme. Under variants with a weekly payment of £20, young people in receipt of Income Support (because they were lone parents or disabled) were eligible to receive the Allowance
payments. Under the £30 payment variant, young people in receipt of Income Support were not eligible to receive Allowance payments although they were able to participate in AA without receiving payments. Similar rules applied to care leavers.
One-to-one support and activities
In all variants young people were offered one-to-one support from an individual Connexions Personal Adviser (PA), with whom they agreed a personally negotiated contract (the Activity Agreement) outlining a personalised plan of agreed activities to be undertaken by the young person each week. The young person’s participation in the activities was monitored weekly by the PA, and their receipt of the weekly Activity Allowance payment was contingent on their attendance at the agreed activities and monitoring sessions.
and provision that was specially commissioned. The activities might have been of a number of different types, including assessment and monitoring by the PA, personal development activities aimed at developing key skills to raise self-esteem and social and interpersonal skills, study skills including basic skills, employability skills, and activities aimed towards moving the young person towards education, employment or training (DfES, 2005).
The AA extension
The pilots were originally funded to run to March 2008. From April 2008, the programme was extended to further trial some approaches to raising post-16 participation in education and learning. In addition to the existing arrangements, three new elements were introduced:
•
Model 1: 13 and 20 week AAs - involves testing of an earlier intervention at 13 weeks.•
Model 2: AAs for those previously in receipt of EMA - targeted at those young people who had been receiving EMA immediately prior to their referral and offering an AA after an interval of 6 weeks.•
Model 3: Vulnerable groups AAs - aimed at fast tracking target groups into AA after 5 weeks (the groups are carers, Gypsies, Roma or Travellers, the homeless, looked after young people, refugees and asylum seekers, substance misusers (in treatment), those supervised by YOT and young people who have learning difficulties).The quantitative research covered in this report took place before the extension pilots began.
1.2 The
evaluation
The three strands of the evaluation of the Activity and Learning Agreement (ALA) pilots, commissioned by DCSF, are:
• a quantitative evaluation, using surveys of young people to measure the impact of the pilots in comparison to a number of control areas
• a programme theory element, focusing on testing some key aspects of the policy to identify what works, what does not and the reasons for this
• a process evaluation, examining the ways in which the pilots have been set up and delivered and the main issues associated with their implementation
1.3 Research design and methodology
Overall quantitative evaluation design
The quantitative evaluation of AA was designed to produce an estimate of the impact of the programme on participants by comparing their outcomes with those of a matched
comparison population. The key research question was whether AA participants experienced better outcomes on average than comparable long-term NEET young people who lived in non-pilot areas. The objective was to produce separate impact estimates for each of the three variants, as well as for AA overall.
The key measures of impact would be based on the activity status of young people, with positive outcomes defined as involvement in paid work, training or education activities (Table 1.2).
Table 1.2 AA outcome and success measures specified by DCSF
Outcome
(Bold indicates primary measure success)
Comments
NEET (20+ weeks)
Progress needs to be judged by identifying progress through completion of Activity Agreement and changes in behaviours and attitudes.
NEET (after period in other) Possible progress - depends on activities engaged in and changes in behaviours and attitudes.
JWT Success
E2E Success
Job - with employer funded training
Success - additional measures would be type and level of training and any achievement
Job - Apprenticeship Success
Job - plus p/t (related or unrelated) ed. & training
Success - additional measures would be type and level of training and any achievement.
Part-time education Success - need to assess impact of not being in employment and changes in behaviours and attitudes.
Full-time education Success - additional measures would be type and level of education and any achievement
The evaluation was designed to allow for impacts of AA measured across the whole of the eligible NEET population to be estimated, by comparing outcomes for NEET young people in pilot areas with similar NEET young people in comparison areas. The main difficulty with this approach relates to interpretation. The impact measurements may be lower than expected because they apply to the eligible population rather than to programme participants. A second problem arises from defining the ‘eligible population’. Appendix D explains how the criteria for eligibility varied between DCSF guidance and the evaluation study.
Sample design
The original sample design specified 4,000 interviews to be carried out in pilot areas (divided evenly between the three AA variants) and 4,000 in comparison areas, these being the numbers that would allow impacts of about 5 percentage points to be detected as statistically significant. In the event, lack of eligible sample in a number of areas meant that 3,331 full productive interviews were achieved in pilot areas and 2,291 in comparison areas.
Sample records were provided by Connexions in each pilot and comparison area on a three-monthly rolling basis. The process of ensuring eligibility and preparing the sample for the survey is outlined in Appendix G.
In order to gather accurate data on family background and to establish parents’ views of young people’s activity choices and involvement with Connexions, wherever an interviewed young person lived with a parent or parents, their parent became eligible for interview. A parent was interviewed directly wherever possible but where this was not achievable the young person was asked a set of proxy questions about their parent or parents’ level of education and employment status. Direct parent interviews were carried out in the case of 58% of interviewed young people who lived with a parent and proxy parent interviews with a further 31%.
Timing of AA participation and interviews
The eligible population for AA was the group of young people who had long-term NEET status, that is, they had been NEET for 20 weeks or more (‘NEET 20’). However, for the purposes of the quantitative evaluation, young people were regarded as eligible if they became NEET while aged 16 or 17 and remained NEET for at least 15 weeks ('NEET 15'). This alteration was made because it was thought likely that Connexions would start
approaching young people to invite participation in AA from when they were around NEET 15. Expecting to take part in the pilot, such young people may, from that point in time, have had a reduced incentive to pursue participation in education, employment and training activities for themselves.
In order to accrue sufficient numbers for impact analysis it was decided to interview young people in pilot areas who became NEET 15 during the first 15 months of the programme’s operation, between April 2006 and June 2007. These young people started their periods of NEET status between January 2006 and March 2007, and were divided into five ‘flow’ sample groups, each defined by the three-month period during which its members started their period of NEET status.
In addition, young people who started their NEET period before January 2006 and remained NEET on 1 April 2006 when AA launched were also included in the survey sample. This was because it was thought very likely that Connexions would approach this ‘stock’ of young people for involvement in the programme in the early phase of its operation. The same groups of young people were defined as eligible for the survey in seven comparison areas.
Survey interviews were carried out between January 2007 and March 2008, using a mixture of face-to-face and telephone interviewing. Fieldwork was designed so that young people in the flow groups were interviewed approximately a year after first becoming NEET. This design was based on the model, specified by DCSF, whereby young people who had
for it. In reality, some young people began their AA involvement after more than 20 weeks from the start of the NEET period and some stayed on the AA programme past 20 weeks.
To reflect this, the impact analysis investigated participation in activities during the year since becoming NEET and also the current activities of participants who had left AA 3 months prior to the interview. It should be noted, however, that the quantitative evaluation was not
designed to measure the longer-term impacts of the programme, that is those beyond the first year to 18 months after young people first became NEET. To do this, the research would need to have extended beyond 2008.
The follow-up (‘wave 2’) survey
Of the AA participants who responded to the survey, 450 were re-contacted and invited to take part in a follow-up (or ‘wave 2’) survey. The selection was made from participants interviewed in quarters 1-4 (quarter 5 respondents were not included). Prior to selection being made, the sample frame was stratified by variant and period of interview to ensure that all variants and all four periods were covered. Participants were sampled disproportionately by variant to ensure that all variants were covered equally. With a response rate of 51%, 229 young people took part.
The purpose of the wave 2 survey was to examine the experiences of participation in AA in more detail than space allowed at the first interview. For example, respondents were asked about the types of activities they undertook while on AA and evaluated them according to different criteria. The wave 2 interview also offered an opportunity to investigate the current attitudes and activities of former AA participants some time after the end of the programme. The interval between the wave 1 and wave 2 interview ranged from 15 weeks to 68 weeks (the mean interval was 42 weeks). The wave 2 interviews were carried out in April and May 2008, after the end of the main fieldwork period. The findings from the wave 2 survey are integrated into this report.
1.4 The
report
Report structure
The findings from the analysis of quantitative evaluation data are reported as follows:
• Chapter 2 describes the characteristics of participants and compares them with non-participants.
• Chapter 3 presents participants’ experiences of the AA programme.
• Chapter 4 presents the findings from the analysis of the impact of AA on participants.
• Chapter 5 discusses conclusions from the research and implications for the programme.
Some appendices provide further results tables and document aspects of the methodology:
• Appendix A provides results tables for the findings reported in Chapter 2 and 3.
• Appendix B provides results tables for the impact analysis reported in Chapter 4, broken down by variant and sub-groups of participants.
• Appendix C provides details of the propensity score matching used to match AA participants with similar young people in comparison areas.
• Appendix D compared two approaches to measuring the impact of AA: the impact on
participants approach followed in this report and the impact on the eligible population
approach that the evaluation was originally designed to use.
• Appendix E discusses the relationship between these impact measures and participation rate for AA, showing how this differs for the three variants of AA.
• Appendix F compares estimates of the NEET population that were derived from survey estimates and AA management information in order to asses how comparable they are.
• Appendix G provides further information about the sample design, fieldwork, weighting and analysis of the surveys of young people.
Reporting conventions
The report’s findings are displayed in some tables within chapters and in Appendices A and B. Which sample members are included in each table, that is the composition of the table base, is described above it. Tables show both weighted and unweighted base sizes but it is the unweighted base sizes which show the number of individuals used in the analysis. In the tables accompanying Chapter 2 and 3 (the descriptive analysis), percentages are rounded to the nearest whole number. Percentages of less than 0.5% are shown as * and those
2
CHARACTERISTICS OF AA PARTICIPANTS
2.1 Key Findings
• AA participants were more likely to be male (58%) than female (42%).
• 87% were of White ethnic origin and there were similar proportions of participants who were Black (5%) and Asian (4%).
• 96% of participants classified themselves as single and 83% were living with their parents. A minority were living with a partner (3%) or with others (9%). Only 9% had children, most of whom were living with them.
• Of the participants who were living with their parents, a little over half (58%) had parents who had no qualifications post-16 years of age.
• The most common occupational classification of participants’ parents was routine and manual occupations (37%).
• Only two thirds of participants (63%) reported that they attended school regularly in their final year. 23% did not attend regularly and 14% did not attend at all. The main reasons for poor attendance were truancy (47%) and exclusion (24%).
• Participants varied widely in their GCSE attainment but overall had much lower levels of attainment than the national average. Only 14% achieved 5 GCSEs at A*-C grade.
• Compared to non-participants, participants were younger, more likely to be male, living with their parents and to be single, and were less likely to have children.
2.2 Introduction
The focus of this chapter is on the background characteristics and activities of AA participants before they became NEET. The chapter starts by explaining how the term ‘participant’ was defined for this report and then describes the profile of participants covering socio-demographic characteristics, parental education and employment, the young person’s experiences of school and activities between leaving school and starting AA. Following this, we describe how participants differed in their background characteristics from similar young people who were eligible for AA but who did not participate in the programme.
2.3 Definition of participants
For the purpose of this report, ‘AA participants’ are defined as the young people living in pilot areas who agreed to take part in AA and who met at least one of the following criteria3: 1. took part in at least one AA activity,
2. were assigned a personal adviser, and/or
3. received AA payments.
3
While recognising that this may differ from the definition of participants used by programme administrators, within the context of a survey, combining responses to a number of questions increases the reliability of the definition. By this definition, the number of participants who responded to the survey was 1,018 at wave 2 and 229 at wave 2.
Of the young people living in pilot areas who had heard of AA, those in Variant 2 areas, where the payment to participants was highest, were significantly more likely to take part in the programme than in the other areas. This suggests that the £30 incentive acted most effectively as a ‘hook’ to get young people involved by the mechanism identified in the AA programme theory report (Johnson et al, 2007).
2.4 Personal background characteristics
Participants were more likely to be male (58%) than female (42%). 87% were of White ethnic origin and there were similar proportions of participants who were Black (5%) and Asian (4%).
The majority of participants were aged 17 (59%) or 16 (36%) when they were interviewed, which was about a year after they became NEET, so most would have been aged 16 when they became NEET. Participants’ marital status reflected their age group with 96% of participants classifying themselves as single.
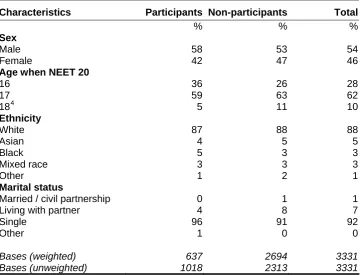
[image:21.595.72.433.439.714.2]The ethnic profiles of participants were similar to the eligible population of NEET young people in pilot areas. However, participants were more likely than non-participants to be male and single and were significantly younger (Table 2.1).
Table 2.1 Personal characteristics
Base Description: NEET 15 young people eligible for AA
Characteristics Participants Non-participants Total
% % %
Sex
Male 58 53 54
Female 42 47 46
Age when NEET 20
16 36 26 28
17 59 63 62
184 5 11 10
Ethnicity
White 87 88 88
Asian 4 5 5
Black 5 3 3
Mixed race 3 3 3
Other 1 2 1
Marital status
Married / civil partnership 0 1 1
Living with partner 4 8 7
Single 96 91 92
Other 1 0 0
Bases (weighted) 637 2694 3331
Bases (unweighted) 1018 2313 3331
As would be expected, given their age, the majority of participants (83%) were living with their parents. A minority were living with a partner (3%) or with others (9%). Only 9% had children, most of whom were living with them.
Compared to non-participants, participants were significantly more likely to be living with their parents and were less likely to have children (Tables 2.2 and 2.3).
Table 2.2 Household composition
Base Description: NEET 15 young people eligible for AA
Household characteristics Participants Non-participants Total
% % %
Household composition
Living with parents 83 76 78
Living with partner 3 7 6
Living with others 9 10 10
Living on own 5 6 6
Bases (weighted) 637 2694 3331
Bases (unweighted) 1018 2313 3331
Table 2.3 Presence of children
Base Description: NEET 15 young people eligible for AA
Whether has children Participants Non-participants Total
% % %
Has children 9 17 15
- Lives with children 8 15 14
- Does not live with children 1 2 1
Does not have children 91 83 85
Bases (weighted) 637 2694 3331
Bases (unweighted) 1018 2313 3331
2.5 Family background characteristics
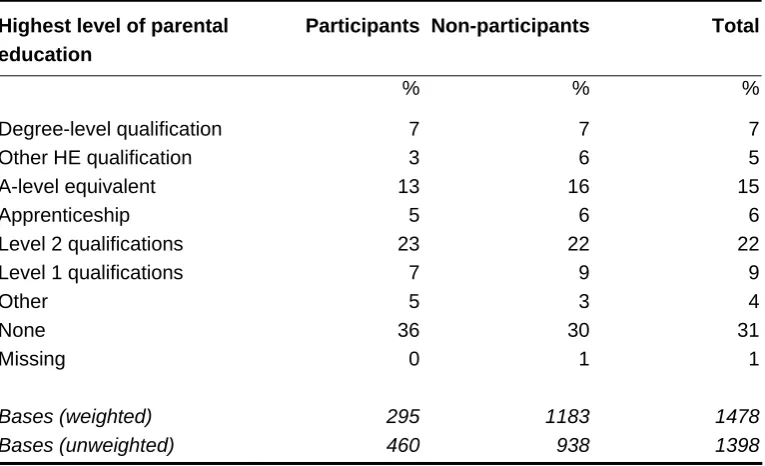
Of the participants who were living with their parents, a little over half (58%) had parents who had no qualifications post-16 years of age. 6% had a parent with a degree level qualification and 16% had a parent with another post-16 qualification (Table A.1).
The parents who were interviewed were asked about their qualifications in greater detail. Equal proportions had a level 2 qualification (23%) and a qualification that was equivalent to A-level or higher (23%). 36% of parents had no qualifications (Table A.2).
2.6 School attendance and GCSE attainment
Exploring the experiences of AA participants at school and in activities since leaving school highlights the diversity of their engagement in education and employment. Only two thirds of participants (63%) reported that they attended school regularly in their final year. 23% did not attend regularly and 14% did not attend at all (Figure 2.1). The results for non-participants were very similar5.
Figure 2.1 Attendance at school in Year 11 (W1)
Base Description: Wave 1 participants (weighted base=637, unweighted base=1018)
Attended regularly
63% Did not attend
regularly 23%
Did not attend at all 14%
Participants gave a wide range of reasons for their poor school attendance in Year 11. The main reason was truancy (47%), followed by exclusion (24%). Other reasons included illness (7%), moving out of the area (5%) and bullying (6%). Again, there were no significant
differences between participants and non-participants on this measure (Table A.5).
Participants varied considerably in their level of GCSE attainment at school as shown in Table 2.4. As would be expected, overall levels of attainment were much lower than the national average. Compared to 62% of pupils achieving 5 or more GCSEs at A*-C level across the country, only 14% of AA participants reached this level. At the other end of the spectrum, 29% did not attain any GCSEs in their final year at school compared to 1% nationally.
Table 2.4 GCSE attainment of AA participants, non-participants and all young people at the end of Key Stage 4 in England 2006/7 (source: DCSF)
Base Description: Wave 1 participants and all young people
GCSE attainment Participants
Non-participants
All young people in England Overall attainment
5+ GCSEs at A*-C 14 15 62
5+ GCSEs at A*-G (<5 at A*-C) 36 38 30
1-4 GCSEs at A*-G 17 16 7
No GCSEs attained 29 27 1
DK GCSE results 4 3 0
Bases (unweighted) 1018 2313 648,752
Overall, participants achieved at a slightly higher level in English than in Maths with 20% and 16% respectively gaining A*-C grades. Female participants attained significantly higher English GCSEs than male participants, with 26% of women attaining grades A*-C compared with 16% of men. There were no significant differences according to sex in overall GCSE attainment or Maths GCSE grade (Table 2.5).
Table 2.5 GCSE attainment at school
Base Description: Wave 1 participants
GCSE attainment Male Female Total
Overall attainment
5+ GCSEs at A*-C 11 17 14
5+ GCSEs at A*-G (<5+ at A*-G) 37 34 36
1-4 GCSEs at A*-G 17 18 17
No GCSEs attained 28 27 29
DK GCSE results 7 4 4
English
A*-C 16 26 20
D-G 43 35 39
Not attained 34 33 34
Missing 7 6 7
Maths
A*-C 15 16 16
D-G 45 47 46
Not attained 32 31 31
Missing 7 6 7
Bases (weighted) 371 266 637
2.7 Activities between school and NEET
Nearly two thirds of AA participants (63%) did not engage in any EET activities between leaving school and becoming NEET. This high proportion reflects the age profile of AA participants. Since the majority were aged 16 or 17 when interviewed, the window of opportunity for engaging in EET activities between leaving school and becoming NEET would have been short. Among those who did report some activity, most engaged in paid work (23%) and/or work-based training (26%).
Participants were significantly less likely to have engaged in EET activities between leaving school and becoming NEET than non-participants (37%, 41%) (Table 2.6).
Table 2.6 Activities since school before NEET period
Base Description: NEET 15 young people eligible for AA
Percentages do not add up to 100 since more than one answer could apply
Activities between school and NEET
Participants Non-participants
Total
% % %
Study for a qualification 6 6 6
Work-based training 26 34 33
Paid work 23 31 29
Voluntary work 7 5 5
Other courses 4 3 3
Any activity 37 41 40
No activity 63 59 60
Bases (weighted) 637 2694 3331
Bases (unweighted) 1018 2313 3331
2.8 Differences between participants and non-participants
Throughout this chapter, the background characteristics of participants have been compared with those of similar young people living in AA pilot areas who did not participate in the programme. There were a few characteristics that were associated with taking part in AA and that therefore need to be taken into account when looking at outcomes so that the true impact of AA participation can be isolated. Observing how participants differ from non-participants may also be useful for targeting the programme in the future.
Participants were significantly less likely than non-participants to have engaged in EET activities between leaving school and becoming NEET (37% compared to 41%). This is probably because they were on average younger and had therefore left school more recently (Table 2.6).
2.9 Conclusions
AA participants were predominantly White, lived with their parents and were aged 16 at the time when they became NEET. The majority were male. Compared with 16 to 18 year old NEET young people who did not take part in AA, participants were slightly younger and so had less experience of EET activities since school. They were less likely to have children.
3 PARTICIPANTS’ EXPERIENCES OF AA
3.1 Key Findings
• The primary motivation for young people taking part in AA was related to finding a job (cited as a reason for taking part by 36% of wave 1 respondents and as the most important factor by 30% of wave 2 respondents).
• Three quarters of the respondents who received payments said they definitely or probably would have taken part without the payment. The AA payment was among the less commonly mentioned reasons for taking part (mentioned spontaneously by 19% of participants).
• Participants had regular contact with a personal adviser and said that this contact was helpful. 81% of participants who were in contact with a PA met that person at least once a week. 91% said that this contact was helpful.
• Although AA was designed to provide 20 weeks of support, there was quite a lot of variation in the amount of time participants spent on it. The average amount of time spent on the programme was 15 weeks. Of those who left the programme before 20 weeks, one-third did so in order to start a job or studying. Young people who were doing personal development activities tended to stay on the programme longer than those doing job-related activities, which is likely to be explained by those participants needing more support.
• In a classification of the activities undertaken on AA into three broad groups, more young people took part in job-related activities (72%) than in personal development activities (64%) or college-based activities (61%).
• More detailed analysis of the types of activities undertaken by participants showed that there was quite a lot of diversity in the way activities were delivered and their duration. However, all types of activities were rated positively by participants.
• Work experience placements were distinctive in that they tended to last longer than other activities and were delivered to individuals on their own rather than as part of a group. These were rated at least as positively as the other activity groups.
• Participants most commonly spent their AA allowance payments on travel and transport (62%), entertainment or leisure (61%) and clothes and shoes (58%).
• Participants mentioned a wide range of benefits of taking part in AA of which the most common were gaining in experience or confidence (31%), help with job preparation (26%), advice or support from Connexions (21%), having something to do (19%), getting qualifications and skills (18%) and getting help to find an education course (17%). This range of benefits would appear to reflect the flexible and responsive characteristics of AA.
3.2 Introduction
The AA pilots were designed to prepare young people for engaging in EET activities by supporting them in three ways: regular meetings with a personal adviser, a financial incentive and activities tailored to their needs and interests. This chapter describes participants’
experiences of each of these facets of the AA programme as well as motivations for taking part, time spent on AA and perceptions of the value of taking part.
As illustrated in Chapter 2 and the other strands of the evaluation, the young people who participated in AA were not a homogenous group and varied quite considerably in social background characteristics including attainment at school, family background and previous experience of work and training. In the analysis for this chapter, we explored the extent to which pathways through the AA programme varied according to background characteristics.
In each section, the findings were also compared by variant to identify whether experiences varied according to the level of payment made to young people and their parents (see Chapter 1). Differences by variant are only reported where they were significant and of interest.
The data come from three sources: the wave 1 interview with participants, the parallel interviews with the parents of some participants and the wave 2 follow-up interview with a sub-sample of participants.
3.3 Motivations for taking part in AA
The young people who participated in AA were asked at wave 1 to say what had motivated them to take part in the programme6. The two most common reasons cited were to make progress towards finding a job (36%) and to have something to do (35%) (Table 3.1). A quarter of young people took part to support their education and one-fifth thought it would provide useful experience or money. The main reason given by young people for not taking part in AA was a positive reason that they were doing or planning to do other things (26%).
Which of the two most common reasons (finding a job and having something to do) were mentioned by participants was related to their GCSE attainment. Participants with higher GCSE attainment were more motivated by help finding a job than by having something to do. In contrast, participants with low GCSE attainment (1-4 GCSEs at A*-G) were more likely to be motivated by having something to do (Table A.6).
Male participants were significantly more likely than female participants to say that they took part in AA for help in finding a job (Table A.6).
6
Notably, money was not the primary motivating factor for taking part in AA, a finding which is supported by the similarity in responses according to variant. Help in finding a job or course and having something to do were more important reasons for taking part in AA than the AA payment, regardless of the level of financial incentive (Table 3.1)7.
Table 3.1 Reasons for agreeing to take part in AA (W1)
Base Description: Wave 1 participants
Percentages do not add up to 100 since more than one answer could apply.
Reasons for taking part
%
Help finding job 36
Something to do / bored otherwise 35
Help with education 25
For experience 20
For money 19
Advice support from CXS 10
To meet new people 2
To build confidence 1
Other specific answer 3
Bases (weighted) 637
Bases (unweighted) 1018
The AA participants included in wave 2 of the survey were asked a similar question. This time, they were asked whether each of the factors cited in Table A.7 were important in persuading them to take part. Since the reasons were pre-coded, responses were much higher than in wave 1. For almost every reason asked about, over 80% of respondents said that it was an important factor. This included help with looking for a job, the chance to attend courses and training and the chance to learn new skills. The notable exception was the ‘weekly payment’ which only 65% of respondents said was an important reason for taking part.
Although the payments were cited as one of the reasons for taking part in AA, the importance of the payments appeared to diminish over time. Retrospectively, three quarters of the
participants who received payments said they would have taken part in the programme even without the payments (Figure 3.1).
Figure 3.1 Whether would have taken part in AA without payment (W1)
Base Description: Wave 1 participants who received payments (weighted base=513, unweighted base=879)
Definitely w ould 29% Probably not
17%
Definitely not 8%
Missing 1%
Probably w ould 46%
Of all the different reasons for taking part in AA, the most important factor for the wave 2 participants was to receive help in looking for a job (30%). To learn new skills was the most important reason for 20% of participants. Only 12% thought that the weekly AA payment was the main reason (Table A.8).
The responses from both waves of the survey concur in finding that young people were motivated to take part in AA by a number of reasons, with finding a job the most prominent among them8. Young people were also motivated by a number of other factors representing a first step in that direction, such as gaining new skills and meeting people. From the vantage point of having completed the AA programme, participants did not recall the AA payment as having been a primary motivating factor.
3.4 Contact with personal advisers
The majority of AA participants reported being assigned a personal adviser to support them on the programme (90%) (Table A.9). Of the remainder, the young people may not have recognised the term ‘personal adviser’ despite the description in the interview question. The basis for this hypothesis is that in the follow-up interview, 18 of the 22 young people who had said at wave 1 that they did not have a personal adviser confirmed that in fact they did.
Of those who reported that a personal adviser was assigned to them, nearly all met with them face-to-face at least once a month (94%), with 81% meeting at least weekly (Figure 3.2). Telephone was also an important means of communication with advisers. Two thirds of participants had weekly telephone contact with their advisers and a further 18% had
telephone contact at least once a month (Table A.10).
8
Figure 3.2 Frequency of meetings with PA (W1)
Base Description: Participants who reported contact with a PA (weighted base=574, unweighted base=948)
At least once a w eek
81% Less than once a
month 5%
No contact w ith PA 2%
At least once a month
13%
A high proportion of young people communicated regularly with their personal adviser in person and by telephone. 72% of those who met with their adviser at least once a week also had telephone contact at least once a week. However, for a small minority, telephone was a useful substitute for face-to-face contact. Of those who met their personal adviser less than once a month, half had telephone contact at least once a month.
The frequency of personal adviser meetings was significantly associated with the regularity of school attendance in Year 11 (see section 2.6). Of those who attended school regularly, 82% met their personal adviser at least once a week and 96% met at least once a month. By contrast, of those who did not attend school at all in Year 11, 75% met their personal adviser at least once a week and 85% met at least once a month.
The participants who took part in the follow-up survey provided more detail about the contact with personal advisers. The length of typical meetings between participants and personal advisers varied widely from 1 minute to nearly 4 hours. The average length of a session was about 53 minutes. One quarter of participants (25%) said they would have liked more time to meet with their adviser.
According to participants in the follow-up study, the meetings with personal advisers were used for planning ahead and reviewing the activities of the previous week, help with looking for a job or college course and general mentoring, support or advice. Over 80% of
Participants rated the meetings very favourably - 63% thought they were very helpful and a further 28% thought they were fairly helpful (Figure 3.3).
Figure 3.3 Helpfulness of contact with PA (W2)
Base Description: Wave 2 participants who reported contact with a PA (weighted base=225, unweighted base=225)
Very helpful 63% Fairly helpful
28%
Not very helpful 5%
3.5 Time spent on AA programme
The quantitative study was designed so that young people would be interviewed
approximately one year after they became NEET, with the expectation being that most would have left the AA programme by this time9. The timing of programme completion in relation to the interviews for the study has implications for the impact analysis since some time needs to have lapsed in order for the young people to have had the chance to engage in activities following the programme.
By the time of the wave 1 interview, 83% of AA participants had left the programme10. At the wave 2 interview, almost all participants (98%) had left the programme (Tables A.14 and A.15).
Although AA was designed to provide 20 weeks of support to participants, the quantitative study concurs with other strands of the evaluation in detecting flexibility and variation in the amount of time young people spent on the programme (Maguire et al, 2007). At wave 2, 63% of participants had left AA before 20 weeks and 37% had continued for 20 weeks or more (Table 3.2). The average amount of time spent on the programme was 15 weeks.
Table 3.2 Whether participant finished AA before 20 weeks (Wave 2)
Base Description: Wave 2 participants
Wave 2
Left before 20 weeks 63
Continued for 20 weeks or more 37
Bases (weighted) 229
Bases (unweighted) 229
The amount of time spent on AA was significantly associated with gender and with the type of AA activities undertaken. Men were more likely than women to stay on the programme beyond 20 weeks (37%, 27%). Engaging in personal development activities was also associated with staying on AA for longer. 40% of those reporting personal development activities stayed on AA past 20 weeks compared to 34% of those doing job-related activities. This may reflect the greater need for support among young people who take part in personal development activities compared to those preparing for employment.
9
Young people were required to be NEET for 20 weeks before starting the AA programme and were then allowed to remain on AA for a further 20 weeks.
10
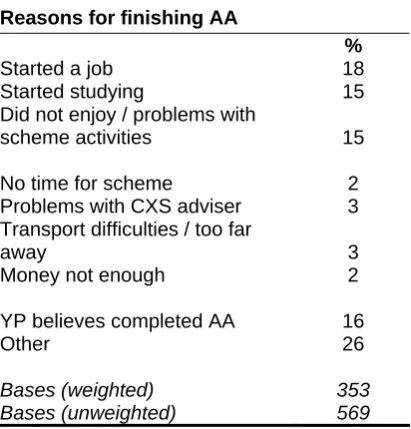
Table 3.3 shows the reasons for leaving AA before 20 weeks. A third of those who left the programme before 20 weeks had a positive reason for doing so - either because they had started a job (18%) or had started studying (15%). Men were more likely than women to leave the programme to start studying11.
A further 16% left before 20 weeks because they thought they had completed the
programme. It is unclear whether this reason should be viewed positively (as an indicator that the young people were ready to move on to other activities) or negatively (as a sign that they had misunderstood the extent of what the programme offered).
Approximately a quarter of the young people who left AA before 20 weeks had negative reasons for doing so such as not enjoying the activities (15%), having problems with transport (3%) or the Connexions adviser (3%) or finding the money inadequate (2%). Women were more likely than men to say that they left the programme because they did not enjoy the activities (20% compared with 10%). However, men were more likely to give finding the money inadequate as a reason for leaving (4% compared with 1%).
Table 3.3 Reasons for finishing AA before 20 weeks (W1)
Base Description: Wave 1 participants who had completed programme before 20 weeks Percentages do not add up to 100 since more than one answer could apply
Reasons for finishing AA
%
Started a job 18
Started studying 15
Did not enjoy / problems with
scheme activities 15
No time for scheme 2
Problems with CXS adviser 3
Transport difficulties / too far
away 3
Money not enough 2
YP believes completed AA 16
Other 26
Bases (weighted) 353
Bases (unweighted) 569
11
[image:34.595.71.277.337.552.2]3.6 Participation in AA activities
The AA programme is designed to engage young people in a wide range of activities as a first step to preparing them for further education, training or employment. For the purposes of the survey, these activities were grouped as follows:
• Job-related: work-experience placements, work-related skills, work taster courses.
• Personal development: activities, courses or training not leading to a qualification, e.g., confidence-building, healthy living, sport/outward bounds, and specific skills
development, e.g., drama.
• College-based: activities relating to going to college or doing formal qualification, basic skills.
Participants were asked about the kinds of activities they had undertaken as part of the AA. Taking responses to waves 1 and 2 together, 72% reported job-related activities, 64% did personal development activities and 61% reported college-related activities (Table 3.4).
Table 3.4 Activities undertaken on AA (W1 and W2)
Base Description: Wave 2 participants
Percentages do not add up to 100 since more than one answer could apply
AA activities (broad groups) Total
%
Job-related 72
Personal development 64
College-based 61
Other 26 None 6
Bases (weighted) 229
Bases (unweighted) 229
Of the 6% of participants who did not report participating in any activities, all but one said they were assigned a personal adviser with whom most had regular meetings or telephone calls. The programme theory strand of the evaluation (Focused Study 3) noted that for some young people their participation in AA was limited to personal adviser meetings, for example because they faced personal or structural barriers in doing the planned activities or because the engagement phase (in which young people and their advisers got to know one another) was protracted.
In the wave 2 interview, participants were asked to select up to three activities they had done as part of their AA to describe in greater detail. These were classified in the following
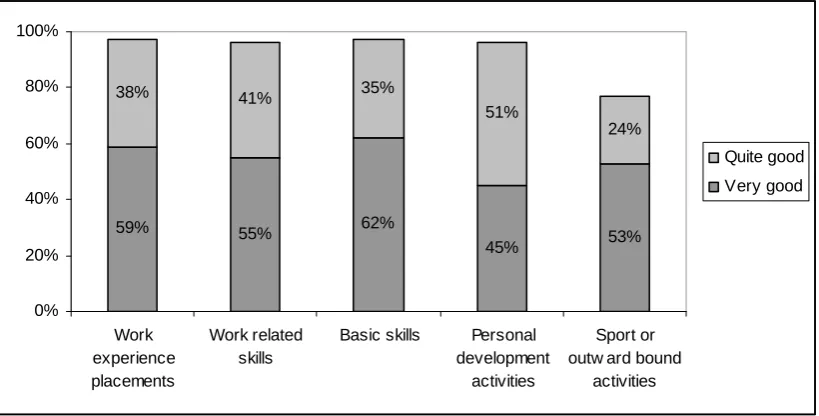
Figure 3.4 Ratings of how good activities were
Base description: Activities selected for description by Wave 2 participants (Unweighted bases for categories ranged between 33 and 69)
59% 55% 62%
45% 53%
38% 41% 35%
51%
24%
0% 20% 40% 60% 80% 100%
Work experience placements
Work related skills
Basic skills Personal
development activities
Sport or outw ard bound
activities
Quite good
Very good
Work experience placements
This category comprised work experience placements and work taster courses and findings are based on the description of 33 activities. Compared with other activities, these required a bigger time commitment and were often more highly valued.
• They typically lasted for a number of weeks or for multiple days within a single week. Very few were limited to a single day (Table A.21).
• The majority of participants (58%) took the activity on their own, rather than as part of a group (Table A.24).
• Work-experience placements received the most favourable ratings when considering all the criteria by which participants assessed AA activities. 89% or more of participants gave positive ratings for the quality of the activity, the leader of the activity and how enjoyable it was. Moreover, mos