F
COMMUNITIES IN ACTION The Handbook
90
F
F F
TIME: preparation + 2-3 hrs.
MATERIAL: photocopies, pens, paper, refreshments.
PEOPLE: the working team and all willing participants.
STEP F
F
COMMUNITIES IN ACTION The Handbook
92
F
F F
WHAT IS AN ENVIRONMENTAL ASSESSMENT
Environmental Assessment is a way of collecting opinions and ranking qualities; it is used to record subjective impressions on the quality of different issues (in our case environments such as areas, spaces, buildings and facilities).
By following the handbook step by step, the working team has generated, with the help of the community, goals and targets for the development of the
neighbourhood.
Remember that the majority of the community could have little or no knowledge of the work done and the progress that has been made so far.
Before a Neighbourhood Plan can be finalised an Environmental Assessment allows the working team to engage the community about:
n whether they feel that their needs, aspirations and
goals for the neighbourhood are properly represented by the draft Neighbourhood Plan;
n whether they want to make any additional
contribution to any of its sections;
For this second consultation of the community you need to prepare a very clear presentation of the plan, so that none of its parts and action programmes can be misunderstood.
F
COMMUNITIES IN ACTION The Handbook
94
F
F F
This session has two main objectives:
n to get the community’s consent to the draft
Neighbourhood Plan;
n to get the community’s assessment of the current
qualities and deficiencies of the priority areas.
It is important that as many members of the community as possible will participate in this final working session to generate an overall consensus with regard to the neighbourhood plan. Therefore advertise the final event as a Neighbourhood Conference.
Distribute leaflets which explain briefly that this is going to be the conclusive consultation session on the Neighbourhood Plan which the community initiated weeks earlier. Extend the invitation to representatives of local authorities, housing organisations, the planning department, professional practices and whoever might want to know about your work, or support it.
Prepare a display of the outcomes of all working sessions, including the Action Matrices of Sessions A-D, the images used for the Photographic Survey, and MST exercises. This material will explain what has happened until now.
Prepare copies of the Environmental Assessment Forms for each of the priority areas for distribution (see page 87). It would help to attach a photograph of the priority area to the relevant form. In order to get feedback from as broad a section of the community as possible, you could distribute the Action Matrices and the Environmental Assessment Forms prior to the conference. You could send a newsletter or send the material directly to organisations, distribute it in the streets, or ask members of the team to distribute it in the area. Prepare and issue a letter which clearly explains what the material is about and offers instruction on how to fill in the forms and generate feedback. An example is shown on page 96.
You might want to generate an agenda for the conference, and give your team members specific tasks for the presentation; don’t do it all yourself.
When you welcome the participants, invite them to walk around the conference room/rooms and look at the exhibits of each stage in detail.
It would also be good to have some breaks with tea and sandwiches. Keep the assembly happy!
F
COMMUNITIES IN ACTION The Handbook
96
F
97 F
Dear Community Member,
The Neighbourhood Plan: Ideas for Development
Since our first community working session, our working team has been refining the goals, action statements and priorities
for action in our neighbourhood that were generated by the community at large. It is now time for us to present the
team’s work and to ask for your support. Therefore we are holding a meeting on
(date, time, place)
when we hope to meet
with as many members of the community as possible.
We have attached two sets of documents for your information..
The first is our list of goals and priorities which have been identified and developed following closely from the original proposals discussed at the meeting held between the working
team and the community. We would appreciate it if you could look at this carefully and give us your feedback either at
the meeting, or in writing, should you be unable to attend. Please inform us if there are any goals, actions statements or
priorities that you do not entirely agree with, or if there are any additions that could be made.
Also attached are Environmental Assessment Forms which have been produced by members of the local community
in preparation for this meeting. By completing these you will provide us with a valuable personal assessment of the
strengths and weaknesses of the area. The forms ask you to give a ranking score between 1 (very weak) and 5 (very
strong).
During the meeting we will explain how these forms were generated and will ask you to fill them in. Should you be unable to attend, please read the attached Instruction
Sheet, fill in the Forms and send them back to us or drop them into our office.
We look forward to hearing from you.
Warm regards
YOUR NAME
Invite
F F
The Neighbourhood Action Plan will have identified actions required in certain locations. Now it is important to collect opinions from as many people as possible on these ‘target areas’ and actions.
Provide participants with the following instructions on how to complete the assessment forms:
COMPLETING AN ENVIRONMENTAL ASSESSMENT FORM
You have an Environmental Assessment Form for each target area. Attached is a photograph of that target area.
Please read all of the criteria that have been used to describe each one of the target areas, and the issues that relate to the target areas. We need your opinion on these descriptions.
For each description or criterion, please give a score of 1 to 5 (1 being least and 5 being best) on how adequately that description fits your view of the target area.
If you are not able to attend the conference but have the chance to do so, visit the target area before filling out the forms; if in doubt at the conference, visit the exhibition which contains a photographic survey of each target area; this will help you to choose a score you find appropriate;
When you have filled in all forms, return them to the working team.
F
COMMUNITIES IN ACTION The Handbook
98
F
99
THE PROCESS - COMMUNITY CONFERENCE
1. Presentation
¡30-45 mins
2. Filling in the forms
¡1 hr
Participants filling out Environmental Assessment forms at a community conference.
A small exhibition of the working team’s outcomes provides a useful background and focus for discussion.
Explain to the participants the nature of the Environmental Assessment Forms. It would be good at this stage to have an example with the help of which you can explain the Form and the process of assessment.
Explain that the outcome of the participants’ assessment of the quality or deficiency of their target areas will greatly support the generation of a design brief because it will indicate where the community sees design or organisational problems in the areas that need urgent improvement. Ask delegates to read the instruction sheet and find a quiet place to fill in the forms. Delegates should by now understand that filling in the forms is easy.
When all have finished their scoring, collect all the forms. Since processing of the forms takes time, you can at this stage announce the end the conference, but you should give some explanation as to how work will progress. Tell delegates that you will generate, on the basis of the Neighbourhood Plan and the Assessment Sheets a design brief which, when all organisational and financial issues
n Session 4: Behavioural Mapping
Actions Matrix illustrates any additional goals and action statements and ask for feedback, and priorities; amend matrix if necessary. Once you have achieved consensus, you have an agreed Neighbourhood Plan.
Achieving consensus is a high priority in this community conference, but ensure that discussion doesn’t sidetrack progress at this point.
Then explain Working Session E: the selection of design criteria and values (the photo sheets should be exhibited at the conference) and the Environmental Assessment sheets you have developed. Make sure that the community understands that no assessment of the design quality of your priority areas has yet been made, that all you did is to generate the Forms; the evaluation is the task of the community. The Forms make it easy to generate this assessment in a relatively short time.
Distribute the Forms and a note explaining how the Forms are filled in (see page 97).
Welcome participants and present the work that has been carried out between the first community work session and now, including the following material:
The Actions Matrix that summarised the outcomes of the first working session with the community: the strengths, weaknesses, action statements and priorities then generated.
Then explain shortly what was carried out in the following working sessions and was achieved (the gradual detailing of the original goals and action proposals):
n Session B: Mental Mapping
Action Matrix illustrates any additional goals, action statements and priorities that may have resulted from this session; you need to get consensus on this expansion; if there are any doubts, ask for comments and resolve the issue; then continue.
n Session C: Photographic Survey
F F
have been resolved, will be handed over to designers to generate a design concepts. These will be duly presented to the community for feedback.
Once all the forms have been returned, it is time for some simple arithmetic: you need to calculate the average score for each evaluation criterion on your records.
Remember that you asked them to express a value for several characteristics that you and your team considered representative of the target areas.
In the case of the neighbourhood square for example, you asked for values on the design of the space, the quality, location and distribution of seating facilities, the variety, compatibility and level of engagement and disturbance of activities, and many more issues.
Calculation A
If for example 35 people completed forms there will now be 35
personal values, represented by numbers between 1 and 5 (1 being least and 5 being best). You need to reduce the 35 views into one which is the average expressed by all the respondents on each characteristic of the square.
To find out what 35 people think of the variety of activities that can take place in the square, add up all the scores 1-5 given to the voice ‘variety of activities’ and divide it by 35. The value you obtain tells you what the 35 respondents think, together, of the variety of action that the square allows.
Do the same for each characteristic that has been identified. You will discover invaluable information: a realistic and detailed account of how a large number of people perceives the main problems, advantages, opportunities of certain spaces to be.
This information is extremely useful because it indicates with clarity what design should do to make such spaces better. At this point, you could take all
3. Interpreting the answers
F
COMMUNITIES IN ACTION The Handbook
100
F
101
the average scores and feed them directly into a design brief. Going back to our example, you asked to evaluate a public square on the basis of 38 characteristics. It is possible to feed the 38 average values into the brief, describing how each has performed and hoping that the designer will take all of them into account (See Working Session G). For clarity, we find it very useful to collect all the information and organise it before you prepare the brief.
In reality in fact, is it likely that these 38 characteristics will have effects on each other. The number and type of activities that can take place in the square will determine for example how secure it feels at different times of the day and how clean it can be kept. This in turn will affect how one feels when walking through it and the atmosphere and sense of place it can stimulate. Design should therefore be able to take into account these connections. You have, by now, all the tools to make them explicit and help designers.
Look at the form on page 87: each target area is ‘broken’ down into very detailed characteristic, which
are grouped in 4-5 main groups. It is very useful to represent the performance of each group by collecting together all the average views that belong to that group. You will be able to see how the activities in the square are perceived, by having a glance at:
n how lively they are; n how they coexist; n how varied they are;
n how much they can engage users
of the square;
n how are they managed; n how they affect safety; n how easy is for people to take
part to them.
If you do so for each group, then you have a well organised and clear idea of how the 4-5 main parts of the square work. This will in turn help you prepare an organised, precise and useful brief, where intentions are justified, explained and described with increasing detail, without ever losing the overall neighbourhood plan of sight.
As much as it is useful to know the score (the weight) of a characteristic, many people find it easier to be able to ‘see’ such score in a graphic format. We
therefore find it useful not just to look at average scores, but to represent these scores visually.
There are many ways to do so (we used both bar-charts as shown below, and ‘radar-graphs’ as shown in the example at the end of this working session; you can choose the one that better suits your team).
In theory, a space that performs exceptionally well, would score 5 on each characteristic (see page 101).
F F MAIN GROUP 5 4 3 2 1 char act eris tic a char act eris tic b char act eris tic c char act eris tic d char act eris tic e char act eris tic f char act eris tic g Main group:
NATURE OF OPEN SPACE IN THE NEIGHBOURHOOD SQUARE 5 4 3 2 1 Ov er all l
ook of the
squar e Int egr ation betw een spac es
Variety of spac
es Or ganisation of spac e Upk eep and maint enanc e Saf ety and ac ces sibility Utility Main group:
BUILDINGS SURROUNDING THE NEIGHBOURHOOD SQUARE 5 4 3 2 1 Appear anc Relationship betw een parts Variety Styl e/Quailty Maint enanc Saf ety/Security Ac ces sibility Main group:
STREETSCAPE AROUND THE NEIGHBOURHOOD SQUARE 5 4 3 2 1 Quality Dis tribution Variety Styl e Maint enanc e Saf ety Ac ces sibility/ usability Main group:
ATMOSPHERE IN THE NEIGHBOURHOOD SQUARE 5 4 3 2 1 Attr activ e Cheerful Cr eativ e W el coming Natur al Relaxing Saf e Free
Pl
easing Engaging
In this case, the overall view on the “NATURE OF THE OPEN SPACE” scored overall:
(1+3+2+3+2+4+1)/7=2.28
Draw two lines as shown (right), marking on the values 1-5 one the side, and underneath each of the characteristics that make up a group.
In this case, the overall view on the “BUILDINGS SURROUNDING the square” is:
(3+2+2+1+2+3+2)/7=2.14
In this case, the overall view on the “STREETSCAPE of the square” is:
(1+3+1+3+1+2+2)/7=1.85
For the group ATMOSPHERE, we found it more useful to describe the square using only the comments we got from the Multiple Sorting Task Exercise. Whilst for the other groups it was easy to identify detailed characteristics, the atmosphere of a place is something which can easily be described just with impressions/feelings. We collected 9, which we thought were inclusive and could capture the atmosphere of a place. Calculating the value of each emotion that it generates is done as in the previous cases. In this case, the overall view on the “ATMOSPHERE of the square” is:
(2+2+4+1+4+1+1+5+1+3)/10=2.4
HOW TO DRAW BAR CHARTS
F
COMMUNITIES IN ACTION The Handbook
102
F
103
HOW TO BUILD A RADAR DIAGRAM
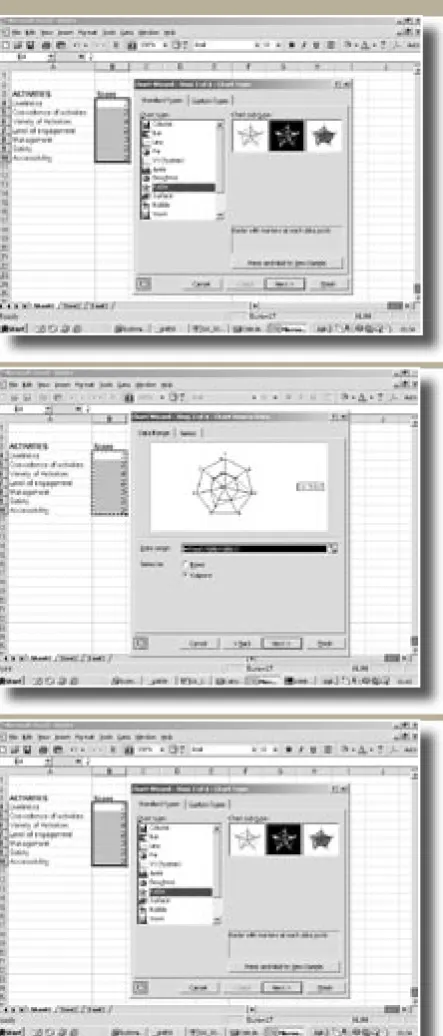
If you have been working alongside schools in the use of the handbook, or have involved other activity groups throughout the process, you might want to explore other ways to represent the data you have collected. This might serve the purpose to exercise members and participants on the use of computers and programmes, or as a way to show (children for example) how very practical issues can be studied on the computer. We found for example the programme Excel can be used to produce clear and immediate representations of the performance of the places we studied; Excel allows you to tabulate data, and then to represent them; a very useful representation that fits well our purpose, is called ‘radar graph’ (Fig 1 page 103), which allows you to present, at the same time, a comparison between an ideal performance of the priority area (for example the square) and its actual performance as assessed by the community.
If you create a spread sheet that includes the name of the group, the name of each characteristic and their score, then select the radar diagram as shown in the example (Fig 2 page 103). It is as simple as
that. You can colour the image if you wish (Fig 3 page 103). A radar is a circular graph made of as many radii as the number of criteria in each criteria group. Each radius, representing one of the criteria, is scaled between 1- 5 in correspondence with the scale of scores in the Environmental Assessment Form.
You use the radar graph to map the mean value of each criterion on the scale of the radius; once you have done this for each of them, you can graphically link all these mean values and obtain the radar, which looks like a spider’s web and shows the performance of each individual criterion.
You then colour the area inside the spider’s web; the performance of the priority area is shown by the proportion between the radar (the coloured area) and the overall area. The larger the shaded area, the better the performance and vice versa.
Do the same for all criteria groups. At this point, the performance of the priority area is completely represented, both in detail and overall. The “quality” of performance of the priority area
depends on how much the polygon tends to the fill the circle of the radar; the ideal quality is achieved when the scores for all criteria in a radar are 5. Such a complete circle radar indicates that a priority area containing all the positive attributes identified by your working team in the MST session. Ex: For example, looking at the radar ‘activities’ the factors 1, 2, 4, 6 and 7, ‘liveliness, co-existence of different activities, level of engagement, safety and accessibility, of the square seem to be weaker than factors 3 and 5, variety of activities and management. If these indications are used in the design brief, designers will be warned to take into consideration, for example, the use of new materials to influence the appearance of the space, making sure also that this improves the feeling of safety or at least does not reduce it. At the same time, intervening with the space layout and the relationships between parts of the space to improve the feeling of scale, they will be advised not to carry out changes that could affect the positive perception of ‘safety’ of the space.
F F
ACTIVITIES AVE. SCORE
Liveliness 2 Coexistence of Activities 2 Variety of Activities 4 Level of Engagement 2 Management 3 Safety 2 Accessibility 2
1 Draw a shape with as many sides as the number of criteria eg. (7 criteria = 7 sides)
2 Trace the radii of this figure. Each radii represents one criterion (lable each radii)
3 Equally subdivide each radii into 5 (to represent the score from 1 - 5)
4 Mark the score on each radii 5 Trace a line to connect all the
scores The example on this page was made using the scores as below:
F
COMMUNITIES IN ACTION The Handbook
[image:16.595.111.333.118.637.2]104
Figure 1
Figure 2
Figure 3 F