A Comparative Evaluation of Dynamic Visualisation Tools
Michael J. Pacione, Marc Roper, Murray Wood
Department of Computer and Information Sciences, University of Strathclyde,
Livingstone Tower, 26 Richmond Street, Glasgow, G1 1XH, UK
{Michael.Pacione, Marc.Roper, Murray.Wood}@cis.strath.ac.uk
Abstract
Despite their potential applications in software comprehension, it appears that dynamic visualisation tools are seldom used outside the research laboratory. This paper presents an empirical evaluation of five dynamic visualisation tools - AVID, Jinsight, jRMTool, Together ControlCenter diagrams and Together ControlCenter debugger. The tools were evaluated on a number of general software comprehension and specific reverse engineering tasks using the HotDraw object-oriented framework. The tasks considered typical comprehension issues, including identification of software structure and behaviour, design pattern extraction, extensibility potential, maintenance issues, functionality location, and runtime load. The results revealed that the level of abstraction employed by a tool affects its success in different tasks, and that tools were more successful in addressing specific reverse engineering tasks than general software comprehension activities. It was found that no one tool performs well in all tasks, and some tasks were beyond the capabilities of all five tools. This paper concludes with suggestions for improving the efficacy of such tools.
1. Introduction
This paper presents a comparison of five dynamic visualisation tools. Dynamic visualisation is the process of modelling the behaviour of software systems. The large volume of information typically generated during dynamic visualisation necessitates tool support. The complex interactions inherent in the object-oriented paradigm make dynamic analysis particularly applicable. Dynamic visualisation tools have a variety of applications in the reverse engineering and software comprehension process, including software evolution, reengineering, refactoring, reuse, redocumentation, and legacy system migration. Stroulia and Systä [1] identify three key research areas for dynamic analysis, namely: finding effective ways of presenting the results; integration with
forward engineering; and application integration and migration (e.g. to the Web). One of the motivations of this paper was beginning an investigation into the first of these areas. The aim of this paper was to compare the performance of a representative selection of dynamic visualisation tools in software comprehension tasks. This was motivated by the apparent lack of use of such tools outside the research laboratory. Section 2 discusses dynamic visualisation and proposes a scale for measuring the level of abstraction of a tool. Section 3 presents the background to the case study, and a set of questions that can be used to evaluate dynamic visualisation tools. Section 4 discusses the results of the case study and their implications. Section 5 briefly surveys related work in dynamic visualisation. Section 6 summarises the paper and draws conclusions and directions for future work from the case study results. We conclude that current dynamic visualisation tools do not provide sufficient support for software comprehension when used individually, and make suggestions for improving the efficacy of such tools.
2. Dynamic visualisation
Dynamic visualisation [2] of a software system consists of three phases: collection of data about the behaviour of the software system; analysis of the data collected; and presentation of the analysis results. These three procedures can be used to characterise dynamic visualisation tools.
Behavioural data can be extracted either statically by parsing the program code, or dynamically from an event trace of the program’s execution. An event trace can be produced by instrumenting the source code, object code, or environment, or running the system under the control of a debugger or profiler.
traces may be split to aid manageability, and tracing may be suspended and resumed.
Three principal diagramming techniques are used to present the results of dynamic visualisation. The first of these is basic graph representations. Graphs are particularly susceptible to issues of scalability. Secondly, UML diagrams represent a de facto diagramming standard that is widely understood. Thirdly, message sequence charts (MSCs) are similar to UML interaction diagrams, and representations based on these can address some of the problems associated with graph-based representations and interaction diagrams, such as scalability and ambiguity.
The preceding characteristic properties help define the level of abstraction of a dynamic visualisation tool. This paper proposes an ordinal scale with which the level of abstraction of such tools (and also other tools, diagrams, and documentation) can be categorised. This scale is shown in Fig. 1. At the microscopic end of the scale, debuggers (1) are representative of the lowest level of abstraction that a dynamic analysis tool can produce. At the opposite, macroscopic, end are tools that provide a broad overview of an entire software system at a high level of abstraction, such as aggregate information about object population, memory usage, load distribution, or deployment (5). The middle portion of the scale ascends from tools that illustrate method calls and returns (2), through tools giving an object- or class-level representation of the system (3), to tools that provide an architectural-level view of the system (4). The program code itself can be considered to be at level 0.
3. Case study
The aim of the case study was to evaluate the performance of the tools in a realistic software comprehension scenario. The available tools were evaluated by assessing their performance in a number of dynamic visualisation tasks. The tasks take the form of questions that an analyst would find it useful to be able to answer about a software system. Large-scale questions consider the entire system, and are typical of those that would be asked in a general software comprehension effort. Small-scale questions address only a part of the system, and are typical of those asked while carrying out a specific reverse engineering task. These general questions can be reused for the evaluation of any type of software comprehension tool in the context of any specific system. The large-scale questions are
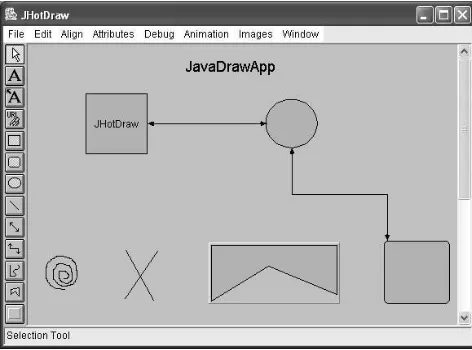
immediately reusable, while the small-scale questions can be instantiated within the context of the system being used for the evaluation. JHotDraw [3, 4] was chosen for this case study as it is a reasonably complex, real-life application framework typical of the type of system that would be subject to software comprehension and reverse engineering efforts. HotDraw is also widely used as a case study in the literature. The evaluation was carried out by a single user with a knowledge of JHotDraw and dynamic visualisation tools. It was felt that a user with reasonable JHotDraw knowledge and tool experience would give more balanced results than a user who was a novice or expert in either or both fields. A case study involving such different users may, of course, produce different results.
The tools evaluated are a representative selection of dynamic visualisation tools: almost the full range of abstraction levels introduced in Fig. 1 is represented, and a wide variety of the collection, analysis, and presentation techniques discussed in Section 2 are employed. AVID [5] and jRMTool [6] both use reflexion models to illustrate the relationships between the high-level entities in a system. The models produced by jRMTool illustrate the conformance of the analyst’s model of the system to the extracted model. The diagrams generated by AVID illustrate the system execution and object population as a series of frames that can be viewed individually, animated, and summarised. Together [7] generates UML class and interaction (sequence and collaboration) diagrams from static analysis of source code. The Together debugger (considered as a separate tool) provides the standard debugging features, including breakpoints, expression evaluation and monitoring, variable watches and modification, and program flow control. It is integrated with the source code and diagrams (where available). Jinsight [8] is a performance-focussed tool that produces a variety of dynamic diagrams that illustrate method calls, objects, and memory usage from an event trace. Further discussion and comparison of these and other dynamic visualisation tools is available in [9].
Fig. 1. The abstraction scale.
3.1. Large-scale questions
[image:3.612.187.423.499.674.2]The following questions are intended to be typical of those asked during the course of a software comprehension effort. Questions L1-L6 are inspired by the six ‘overall understanding’ questions of Systä et al. [10, p.378]. Questions L7 and L8 address issues that are particularly relevant to framework reuse, while L9 is an important software comprehension issue.
L1 What is the static structure of the software system? The static structure of an object-oriented system can be illustrated by showing the classes and their relationships.
L2 What interactions occur between objects at runtime? In an object-oriented system, object interactions can be represented as a series of method calls.
L3 What is the high-level structure/architecture of the software system? Software system architecture can be illustrated by displaying the relationships between the high-level components of the system (e.g. between the drawing and its elements in JHotDraw).
L4 How do the high-level components of the software system interact? High-level component interactions can be illustrated by representing the communications
between these components (e.g. between the tools and the drawing elements in JHotDraw).
L5 What patterns of repeated behaviour occur at runtime? Rather than representing repetitive behaviour individually, such behaviour can be abstracted and illustrated in an aggregated form.
L6 What is the load on each component of the software system at runtime? Runtime load can be measured in a number of ways, including memory or CPU usage, object population, or method call frequency.
L7 What design patterns are present in the software system's implementation? Design patterns [11] represent a general solution to a design problem in a context, and contain both structural and behavioural aspects.
L8 Where in the software system are the hotspots where additional functionality can be added? Hotspots are points in a framework where the framework designer intends extensions to be made.
L9 What impact will a change made to the software system have on the rest of the software system? Change impact analysis allows an analyst to investigate the effect of any structural and/or behavioural changes that may be made to the system.
3.2. Small-scale questions
The following questions are intended to be typical of those asked during the course of a specific reverse engineering effort. Questions S1, S2, and S6 are inspired by the ‘goal-driven reverse engineering’ and ‘object/method behaviour’ questions of Systä et al. [10, p.378]. Questions S3, S4, and S5 address issues typically encountered in framework comprehension [12] and are typical maintenance activities.
S1 What are the collaborations between the objects involved in an interaction?
S2 What is the control structure in an interaction? S3 How can a change be mapped onto the functionality provided by the software system?
S4 Where is the functionality required to implement a solution located in the software system?
S5 What alternative functionalities are available in the software system to implement a solution?
S6 How does the state of an object change during an interaction?
3.3. Small-scale questions specified for JHotDraw
The following questions instantiate the small-scale questions above for the JHotDraw domain.
J1 A common problem in JHotDraw applications is the display not being updated as desired when a change is made to the underlying model. To understand this problem, it is necessary to investigate the redraw mechanism of JHotDraw, which is an interaction consisting of a sequence of object collaborations.
J2 When a drawing element is moved or has its dimensions changed, there may be erratic changes to this and other drawing elements to which it is connected. To understand this problem, it is necessary to investigate the control structure used by JHotDraw to enforce constraints. J3 JHotDraw applications often require collision detection, so that action can be taken when two elements 'collide' (i.e. overlap in the drawing). To understand this problem, it is necessary to investigate the mechanism by which JHotDraw determines the locations of drawing elements, in order that the solution to the collision detection problem can be mapped onto the functionality available in JHotDraw.
J4 In order to implement the solution for J3, it is necessary to identify the location of the functionality in JHotDraw that returns the position of an element and how this information can be used to test whether elements overlap.
J5 To move or resize a drawing element in JHotDraw there is a choice of functionality that requires investigation and understanding as some of the alternatives may have undesired side effects.
J6 When debugging a JHotDraw application, it may be important to examine the internal state of objects in the drawing. In order to extract such information, it is necessary to investigate the way in which an object’s state changes during the course of an execution.
4. Case study results
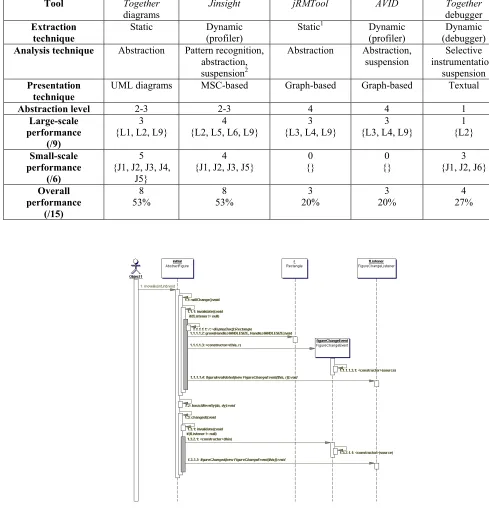
Table 1 summarises the results of the case study. For each tool, it shows the extraction, analysis, and presentation techniques employed, its abstraction level, and its performance in the tasks. It is clear form Table 1 that Together diagrams and Jinsight were able to answer the most questions, while jRMTool and AVID could answer the fewest. Comparing tools of similar abstraction levels that use different extraction techniques indicates that, in this case, the choice of statically or dynamically extracted information does not affect significantly the number of questions the tool can answer. Table 1 also shows that the reflexion model technique is unsuitable for small-scale questions whether statically or dynamically extracted information is used. It would be interesting to assess in this way the performance of a tool that combines both types of information, such as Shimba [10] (which was not available for evaluation).
Table 1 reveals that an abstraction level of around 2-3 is optimal in terms of answering the most questions. Moving away from this point, for small-scale questions, the tools become less effective as their abstraction levels move towards the higher (macroscopic) end of the scale, while for large-scale questions the opposite is true. As expected, tools that employ abstraction as an analysis technique were able to answer more large-scale questions than the tool that did not (Together debugger). However, increasing the level of abstraction still further resulted in worse performance in small-scale questions than if no abstraction were used. It should be noted that these findings may be dependent on the type of questions that were asked, but, as stated, they were intended to be representative of those that would be asked by an analyst engaged in software comprehension.
4.1.Together diagrams
impossible to measure the load on system components. There is no way to identify hotspots automatically. Some idea of change impact analysis can be obtained using the
[image:5.612.52.541.143.651.2]‘Search for Usages’ function, which identifies all code locations where an attribute, method, class, interface, or package is used.
Table 1. Tools summary comparison.
Tool Together diagrams
Jinsight jRMTool AVID Together debugger
Extraction technique
Static Dynamic (profiler)
Static1 Dynamic
(profiler)
Dynamic (debugger)
Analysis technique Abstraction Pattern recognition, abstraction,
suspension2
Abstraction Abstraction, suspension
Selective instrumentation,
suspension
Presentation technique
UML diagrams MSC-based Graph-based Graph-based Textual
Abstraction level 2-3 2-3 4 4 1
Large-scale performance
(/9)
3 {L1, L2, L9}
4
{L2, L5, L6, L9}
3 {L3, L4, L9}
3 {L3, L4, L9}
1 {L2}
Small-scale performance
(/6)
5 {J1, J2, J3, J4,
J5}
4 {J1, J2, J3, J5}
0 {}
0 {}
3 {J1, J2, J6}
Overall performance
(/15)
8 53%
8 53%
3 20%
3 20%
[image:5.612.179.450.397.648.2]4 27%
Fig. 3. A UML interaction sequence diagram produced by Together.
1 Although jRMTool can generate reflexion models using dynamically extracted information, a facility to convert the output of a Java execution trace generator into the format required by jRMTool was not available.
Together coped well with the small-scale questions J1-J5: it was able to answer the questions on object collaboration, control structure, mapping, and functionality identification. However, Together’s lack of dynamically extracted information prevents it from observing changes to the state of an object at runtime.
The strengths of Together were seen as: the comprehensiveness of its diagrams due to their generation from source code; and its ‘Search for Usages’ functionality. Together’s principal weaknesses are attributable to its lack of dynamically extracted information, namely: while the diagrams are broad in scope they lack depth; it is impossible to focus the diagrams on a particular part of the system’s execution; it is difficult to know which are the ‘interesting’ methods for which the analyst should create sequence diagrams; sequence diagram generation can be time-consuming; references to (methods of) interfaces and abstract classes cannot be resolved to objects, as the implementing/extending class cannot be determined statically; references to subtypes cannot always be fully resolved, as it is not possible to determine statically whether an object is an instance of the supertype or of one of its subtypes; and the inability to examine internal object state.
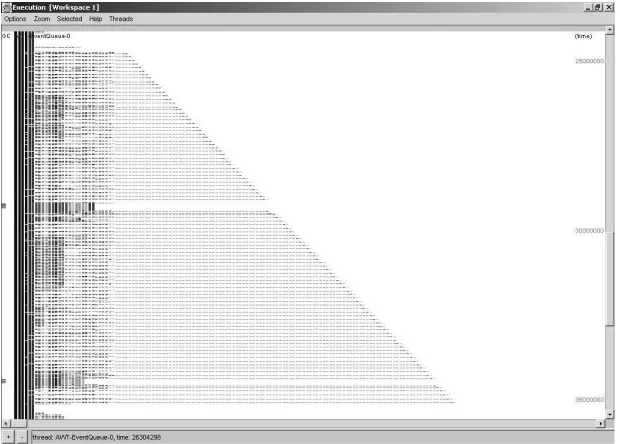
[image:6.612.152.462.440.662.2]4.2.Jinsight
Fig. 4 shows the execution view of Jinsight. Jinsight was not able to give information on the static structure or
high-level architecture of the system. It provides an array of diagrams for examining dynamic behaviour, but cannot display behavioural information for high-level components. The execution pattern view was used to identify patterns of repeated behaviour. The execution view and object population histogram can be used to identify high-activity classes and methods. Jinsight does not support the identification of design patterns or hotspots for extension. The method histogram and invocation browser can be used in conjunction with the execution view to identify where methods are used, which would be useful for change impact analysis.
Jinsight was able to answer questions on object collaboration and control structure. The size of the diagrams made it difficult to identify how a solution could be mapped onto the framework. The lack of a static view hindered the identification of framework functionality. Jinsight does not support analysis of objects’ internal state.
The strengths of Jinsight were considered to be: the variety of dynamic views; the accuracy of its diagrams due to dynamically extracted information; and automatic behavioural pattern identification. The weaknesses of Jinsight were seen as: difficulty in focussing the visualisation due to the size of the diagrams; lack of a static representation of the software system; lack of generality in its diagrams resulting from a lack of statically extracted information; and the inability to examine internal object state.
4.3.AVID and jRMTool
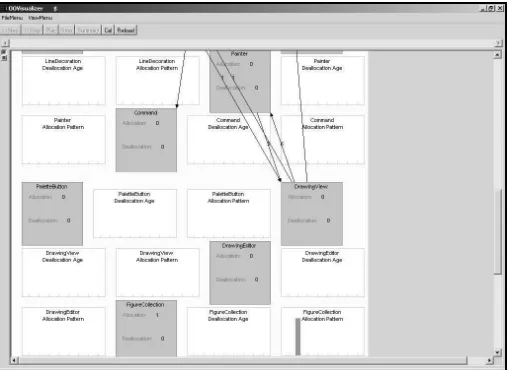
Fig. 5 shows the summary view of AVID; Fig. 6 shows the reflexion model produced by jRMTool. Reflexion models are at too high a level of abstraction to show basic static structure or object interactions. The architecture and high-level interactions were shown clearly in the reflexion models. Only a very general, aggregated impression of patterns of repeated behaviour and runtime load were evident in the reflexion model. The identification of design patterns and extension hotspots were both below the level of abstraction provided by the reflexion model. Change impact can be investigated by altering the input level model or the mapping from source to high-level entities.
Reflexion models are at too high a level of abstraction to illustrate object collaborations, control flow, alternative functionalities, or object state. They would be useful for mapping problems at a higher level of abstraction.
[image:7.612.180.435.256.441.2]The strengths of the reflexion model technique are: it illustrates the software system architecture; it illustrates the high-level interactions in the system; and it enables the analyst to validate their model of the system. The weaknesses of reflexion models were felt to be: it relies on the analyst to provide an adequately accurate high-level model as input; and it is at too high a high-level of abstraction to answer small-scale questions, such as those relating to object interactions or internal state.
[image:7.612.155.457.489.651.2]Fig. 5. The AVID summary view. Rectangles represent high-level system components. Directed arcs represent communication. Histograms illustrate object population.
Fig. 6. The reflexion model produced by jRMTool. Ovals represent high-level system components. Directed arcs represent communication; arc annotations indicate frequency. Solid arcs indicate agreement with the analyst’s model; dashed arcs indicate absences from the analyst’s model; dotted
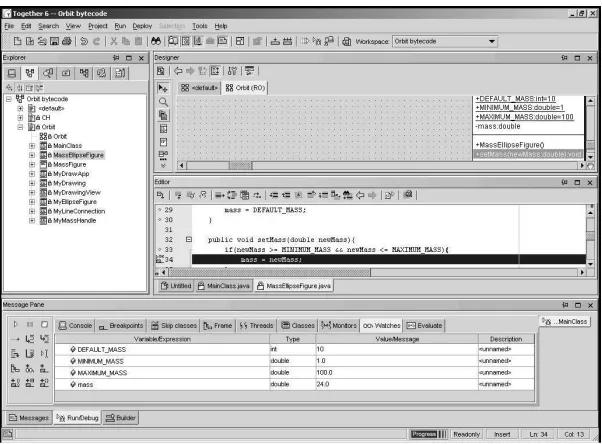
Fig. 7. The Together debugger user interface. The left pane shows packages and classes. The top-right pane shows a class diagram. The middle-top-right pane shows the program code. The bottom pane is
the debugger interface.
4.4.Together debugger
Fig. 7 shows the user interface of the Together debugger. Although static information is not shown, dynamic information can be output by setting breakpoints at ‘interesting’ methods or classes. High-level structural and behavioural information is above the low level of abstraction provided by the debugger. There is no functionality to detect repeated patterns of execution, or to show runtime component load. Questions relating to design patterns and extension hotspots are at too high a level of abstraction to be answered using a debugger. Basic change impact analysis can be performed by comparing the output from executions before and after the change.
If breakpoints can be accurately placed at ‘interesting’ methods, questions about object collaborations and control structure can be answered straightforwardly. The lack of a view of the whole system makes mapping problems and identifying functionality difficult. The dynamically extracted nature of the information means that alternative functionalities are not always apparent, and the lack of full method signatures make method identification confusing. The debugger was able to query internal object state conveniently.
The strengths of the Together debugger are as follows: the low level of abstraction would be useful for finding code-level errors; dynamically extracted information gives precise output; integration with source code makes setting and monitoring breakpoints and watches more convenient; diagram animation during debugging assists
comprehension; and the ability to examine internal object state. The weaknesses of the debugger were found to be: the low level of abstraction makes it impossible to answer many higher-level questions; the lack of statically extracted information means only a subset of possible behaviour is shown; it can be very time-consuming to set each breakpoint manually; and it is often difficult to know where to set breakpoints.
5. Related work
small-scale tasks used in this paper to typify general software comprehension and specific reverse engineering tasks, respectively, though their tasks were more straightforward. While useful results were obtained in terms of the relative usabilities of the tool interfaces, the paper concludes by identifying the need for a larger user group, more tasks, longer time, and greater experimental control.
Several taxonomies of program visualisation tools have been proposed, such as that of Price et al. [2]. Price et al. propose a detailed, multi-level taxonomy for classifying software visualisation tools. Unlike earlier taxonomies that have derived categorisations based on observations of tools, Price et al. justify their categories (Scope, Content, Form, Method, Interaction, and Effectiveness) based on the theory of visualisation tools. They then attempt to classify a selection of software visualisation tools according to this taxonomy. The software visualisation tools in this paper are categorised according to four categories that were observed from the extant dynamic visualisation tools (extraction, analysis, and presentation techniques, and abstraction level). There is some commonality between these categories and those of the taxonomy of Price et al. While this categorisation may be less detailed than the taxonomy of Price et al., it provides much of the cogent information that may be required when selecting a dynamic visualisation tool for a software comprehension or reverse engineering task.
A recent comparison of static visualisation tools by Kollmann et al. [14] compared the class diagram synthesis facility of Together with three other tools, including the commercial Rational Rose tool. While basic diagram generation results were broadly similar across the tool set, some associations were not detected by Together. The research tools in the study by Kollmann et al. were able to handle more advanced diagram concepts than the commercial tools.
In addition to the five tools evaluated in this paper, a number of other dynamic visualisation tools have been developed, most notably Shimba [10] by Systä et al. This tool incorporates both statically and dynamically extracted information. Statically extracted information is displayed using a graph representation. Dynamically extracted information is displayed using UML sequence diagrams. The sequence diagrams can be used to slice the static graphs, thus focussing the visualisation on the area of interest. The static graphs can be used to generate sequence diagrams at a higher level of abstraction. UML statechart diagrams can also be generated to illustrate the runtime behaviour of individual objects or methods. With an abstraction level of 2-4, Shimba addresses a wider range of abstraction levels than any of the other tools in this paper. This range of abstraction levels, combined with the inclusion of both statically and dynamically extracted information, should allow Shimba to perform
well in both the large- and small-scale questions. Shimba would be expected to be useful in answering a higher proportion of questions than any of the other tools considered in this paper. Unfortunately, as stated previously, Shimba was not available for evaluation.
An in-depth discussion of dynamic visualisation concepts, techniques, and tools is available in [9].
6. Summary and conclusions
Table 1 shows that the tools were more successful in answering the small-scale questions and that, on average, a tool could answer only a third of the questions. This may imply that a single software comprehension tool may not be adequate for all tasks. Kazman and Carrière [15] posit that this is the case for architectural extraction, and Richner and Ducasse [16] say this with regard to design recovery. However, it may also suggest that tools are not powerful enough and require a combination of both statically and dynamically extracted information to perform well in all tasks.
No tools were able to answer either of the large-scale questions L7 (What design patterns are present in the software system's implementation?) and L8 (Where in the software system are the hotspots where additional functionality can be added?). While it must be stressed that these problems may be specific to frameworks and not anticipated by the tool developers, work by Keller et al. [17] and others on identifying design patterns, and by Schauer et al. [18] and others on identifying hotspots, stress the role of the human analyst and reveal that detecting design patterns and hotspots is a non-trivial task that can benefit from tool support.
but shallow, while dynamically extracted visualisations are narrow but deep. The lack of a single dynamic visualisation tool that performs well in all tasks is likely to be a large contributory factor in the lack of use of dynamic visualisation tools outwith the context of research. Analysts are evidently using alternative types of tool to obtain the information they require for software comprehension.
A larger case study involving more tools is required before further conclusions can be drawn regarding the effectiveness of the presentation techniques, analysis techniques (other than abstraction), or dynamic extraction techniques. Future work should investigate tools that incorporate both statically and dynamically extracted information and allow the analyst to move conveniently between abstraction levels; such tools would have the potential to address many of the issues identified in this paper. Dynamic visualisation tools that incorporate design pattern and hotspot recovery provide another interesting research prospect.
References
[1] E. Stroulia and T. Systä, “Dynamic Analysis for Reverse
Engineering and Program Understanding”, ACM SIGAPP
Applied Computing Review 10(1), ACM Press, New York, NY, 2002, pp. 8-17.
[2] B.A. Price, R.M. Baecker, and I.S. Small, “A Principled
Taxonomy of Software Visualization”, Journal of Visual
Languages and Computing 4(3), Elsevier, Amsterdam, 1993, pp. 211-266.
[3] R. E. Johnson, “Documenting Frameworks using Patterns”,
Proceedings of the 7th Conference on Object-Oriented
Programming, Systems, Languages, and Applications, ACM
Press, New York, NY, 1992, pp. 63-76.
[4] E. Gamma and T. Eggenschwiler, JHotDraw 5.1,
http://members.pingnet.ch/gamma/JHD-5.1.zip, 1998.
[5] R.J. Walker, G.C. Murphy, B. Freeman-Benson, D. Wright, D. Swanson, and J. Isaak, “Visualizing Dynamic Software
System Information through High-Level Models”, Proceedings
of the 13th Conference on Object-Oriented Programming,
Systems, Languages, and Applications, ACM Press, New York, NY, 1998, pp. 271-283.
[6] G.C. Murphy, D. Notkin, and K.J. Sullivan, “Software Reflexion Models: Bridging the Gap between Design and
Implementation”, Transactions on Software Engineering 27(4),
IEEE CS Press, Los Alamitos, CA, 2001, pp. 364-380.
[7] TogetherSoft Corporation, Together ControlCenter,
http://www.togethersoft.com/products/controlcenter/, 2001.
[8] W. De Pauw, E. Jensen, N. Mitchell, G. Sevitsky, J. Vlissides, and J. Yang, “Visualizing the Execution of Java
Programs”, Proceedings of the International Seminar on
Software Visualization, LNCS 2269, Springer-Verlag, Berlin, 2001, pp.151-162.
[9] M.J. Pacione, “A Review and Evaluation of Dynamic Visualisation Tools”, Technical Report EFoCS-50-2003, Department of Computer and Information Sciences, University of Strathclyde, Glasgow, 2003.
[10] T. Systä, K. Koskimies, and H. Müller, “Shimba – an Environment for Reverse Engineering Java Software Systems”, Software – Practice and Experience 31(4), Wiley, New York, NY, 2001, pp. 371-394.
[11] E. Gamma, R. Helm, R. Johnson, and J. Vlissides, Design
Patterns: Elements of Reusable Object-Oriented Software, Addison Wesley, Boston, MA, 1995.
[12] D. Kirk, M. Roper, and M. Wood, “Understanding Object-Oriented Frameworks – An Exploratory Case Study”, Technical Report EFoCS-42-2001, Department of Computer and Information Sciences, University of Strathclyde, Glasgow, 2001.
[13] M.-A.D. Storey, K. Wong, P. Fong, D. Hooper, K. Hopkins, and H.A. Müller, “On Designing an Experiment to
Evaluate a Reverse Engineering Tool”, Proceedings of the 3rd
Working Conference on Reverse Engineering, IEEE CS Press, Los Alamitos, CA, 1996, pp. 31-40.
[14] R. Kollmann, P. Selonon, E. Stroulia, T. Systä, and A. Zündorf, “A Study on the Current State of the Art in Tool-Supported UML-Based Static Reverse Engineering”,
Proceedings of the 9th Working Conference on Reverse
Engineering, IEEE CS Press, Los Alamitos, CA, 2002, pp. 22-33.
[15] R. Kazman and S. J. Carrière, “Playing Detective: Reconstructing Software Architecture from Available
Evidence”, Journal of Automated Software Engineering 6(2),
Kluwer, Dordrecht, 1999, pp. 107-138.
[16] T. Richner and S. Ducasse, “Using Dynamic Information for the Iterative Recovery of Collaborations and Roles”, Proceedings of the 18th International Conference on Software Maintenance, IEEE CS Press, Los Alamitos, CA, 2002, pp. 34-43.
[17] R.K. Keller, R. Schauer, S. Robitaille, and P. Pagé, “Pattern-Based Reverse-Engineering of Design Components”, Proceedings of the 21st International Conference on Software Engineering, ACM Press, New York, NY, 1999, pp. 226-235.
[18] R. Schauer, S. Robitaille, F. Martel, and R.K. Keller, “Hot Spot Recovery in Object-Oriented Software with Inheritance
and Composition Template Methods”, Proceedings of the 15th