Int. J. Electrochem. Sci., 12 (2017) 8552 – 8563, doi: 10.20964/2017.09.60
International Journal of
ELECTROCHEMICAL
SCIENCE
www.electrochemsci.org
Creatine Kinase Determination Based on an Electrochemical
Impedance Immunosensor
Tao Geng, Zhiyuan Song, Jiangang Zhang and Zesheng Xu*
The Second Department of Cangzhou Cardiovascular Institute, No.16 West Xinhua Rd, Cangzhou, Hebei, 061000, P.R. China
*
E-mail: [email protected]
Received: 23 May 2017 / Accepted: 20 July 2017 / Published: 13 August 2017
With biosynthesized gold nanoparticles (Au NPs) as the basis, a new electrochemical impedance immunosensor is proposed in this study to determine the concentration of creatine kinase (CK), a cardiac biomarker. This sensor has an extended detecting range of 10 ng/mL to 0.5 μg/mL. Moreover, it features a notable anti-interference trait making this bio-fabricated immunosensor potentially employable in CK detection.
Keywords: Creatine kinase; Electrochemical impedance immunosensor; Gold nanoparticle; Acute myocardial infarction; Clinical measurement
1. INTRODUCTION
functioning as a biomarker of acute myocardial infarction (AMI), CK concentration/activity is determined in contemporary clinical diagnosis to confirm other AMI-related symptoms. Succeeding the outbreak of AMI, there is an instant rise in CK levels in the blood, and after 4–6 h it turns unusual, with the peak value of CK activity occurring 18–24 h after the outbreak of AMI [3]. The seriousness of the AMI is assessed using the measurement of the CK rise, which determines the appropriate therapeutic action to take [4]. Furthermore, CK measurement in the blood serum is used in the evaluation of athletes’ physical qualities.
CK is normally determined by medical laboratories with inexpensive and complicated spectrophotometric approaches. The production rate of the products of the CK-catalysed reaction are measured to evaluate CK activity [5, 6]. Usually, a hexokinase and glucose-6-phosphate dehydrogenase based enzymatic system is employed. CK-synthesized ATP is employed by hexokinase to synthesize glucose-6-phosphate. The formation of NADH is achieved by the oxidation of the latter with glucose-6-phosphate dehydrogenase. NADH concentration is determined through spectroscopy at 340 nm and used to calculate the activity of CK in the sample. This approach is unable to differentiate between diverse CK isoforms, with the total activity of all isoforms being measured.
[21, 22]. In this work, a bioelectrode was fabricated to detect CK with biosynthesized Au NPs utilizing the EIS technique. An indium-tin-oxide (ITO)-glass plate provides a platform for the covalent anchoring of biosynthesized Au NPs on the self-assembled monolayer (SAM) of 3-aminopropyltriethoxy silane (APTES). The carbodiimide coupling reaction contributes to the covalent attachment of Ab-CK (CK antibody) to APTES/ITO-glass plates modified by carboxyl-functionalized Au NPs. Diverse microscopic approaches were employed for a systematic characterization of the bioelectrode. Additionally, EIS ([Fe (CN)6]3−/4− as a redox probe) is employed for the investigation of this bioelectrode’s capacity to quantitatively estimate Ag-CK in phosphate buffer saline (PBS) with a pH of 7.4.
2. EXPERIMENTS
2.1. Chemicals
PBS containing NaCl (140 mM), KCl (2.7 mM), Na2HPO4(0.1 mM) and KH2PO4 (1.8 mM), pH 7.2 was employed in the whole set of experiments as the buffer solution. K3[Fe(CN)6]/K4[Fe(CN)6] (10 mM) was added to the buffer where a redox mediator was necessary. 3-mercaptopropionic acid (MPA), bovine serum albumin, creatine kinase (CK), 2-mercaptoethylamine (2-MEA) hydrochloride and HAuCl4 were purchased from Sigma-Aldrich Corp. To remove impurities, fresh Pithophora oedogonia was washed with Mill-Q water. The wet sample went through 3 days of shade drying, followed by a complete 70 °C oven drying. Eventually, the final Pithophora oedogonia sample was obtained as a fine powder through grounding. Being of analytical grade, the rest of the chemicals were used without further purification.
2.2. AuNPs synthesis
2.3. Characterizations
A UV-2550 spectrophotometer (SHIMADZU, Japan) was employed to obtain UV absorption spectra. X-ray diffraction (XRD) was employed to carry out the qualitative phase analysis of the electro-catalyst with the Philips XPERT PRO system. The Fourier-transform infrared spectra (FT-IR) of the samples were recorded using a Bruker Equinox 55. An ESCALab220i-XL electron spectrometer purchased from VG scientific was used to measure the X-ray photoelectron spectroscopy (XPS) data with Al Kα radiation of 300 W, where the base pressure was approximate 3 × 10⁻⁹ mbar.
2.4. Immunosensor fabrication
The glass plates coated with ITO were ultrasonically cleaned and subsequently vacuum dried. Cleaned ITO glass plates were exposed to oxygen plasma in a plasma chamber for 5 minutes to increase the hydroxyl species on the surface. Then an SAM of APTES was generated by 1.5 h immersion of ITO-glass plates into 2% APTES solution prepared in ethanol in ambient conditions. For the non-bonded APTES to be removed from the substrate surface, the plates went through ethanol rinsing. Then, N2 gas flow drying was conducted on them. 3 h immersion of these APTES-modified ITO glass plates was performed in the as-prepared mixture of functionalized Au(MPA) nanoparticles. The immunosensor (Au(MPA)/APTES/ITO-glass) was fabricated after the following double-distilled water washing and N2 gas flow drying. The immobilization of Ab-CK on as-prepared electrode was achieved after it went through 4 °C treatment with PBS containing 100 μg/mL Ab-CK overnight, PBS washing and N2 flow drying (denoted as Ab-CK/Au(MPA)/APTES/ITO-glass). For the nonspecific binding sites to be impeded on the surface of the electrode, 30 min incubation of this Ab-CK-immobilized electrode was performed in the solution of BSA (1%). The electrode then went through PBS washing for the removal of any physically adsorbed antibodies, followed by N2 flow drying.
2.5. Electrochemical determination
relevant parameters concerning EIS were assessed after the equal portions of Ag-CK with diverse concentrations were successively added.
3. RESULTS AND DISCUSSION
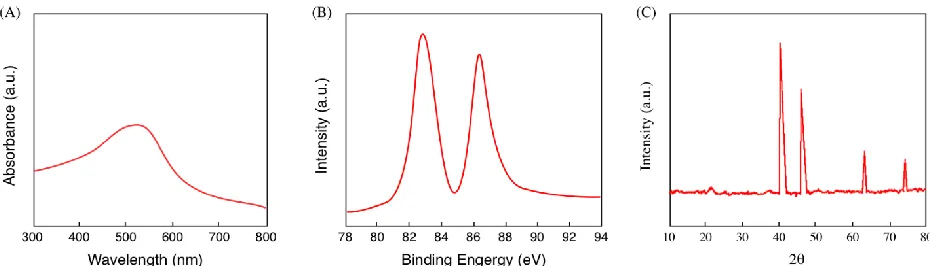
As soon as Pithophora oedogonia extract was mixed into HAuCl3 solution, the biosynthesis reaction was initiated. Au nanoparticles began nucleating, denoted by the change in the dispersion colour from the original light yellow to purplish yellow. Light at certain wavelength could be absorbed by the scattered metallic nanoparticle. In this way, in the as-prepared Au NPs dispersion, the surface plasmon resonances of the Au NPs would be monitored. Note that several elements such as size, solvent and morphology would influence the optical trait of Au NPs [23]. The Pithophora oedogonia prepared Au NPs were characterized via UV-vis spectrometry in Figure 1A. That the metallic Au material was formed could be verified through the surface plasmon resonance of the Au NPs represented by the 525 nm absorption peak. The mean size of the synthesized Au NPs was determined by the location of the surface plasmon resonance peak. XPS also verified the fabrication of the Au NPs. The biosynthesized Au NPs were characterized by Au4f high resolution XPS scan, as indicated in Figure 1B, with 83.5 and 87.2 eV obtained respectively for Au4f 7/2 and Au4f 5/2 peaks. These peaks indicated a transfer from the theoretical Au0 values of 84.0 and 87.7 eV due to the surface attachment of biomolecules coming from the Pithophora oedogonia extract. The biosynthesized Au NPs were characterized by an XRD profile in Figure 1C. The (311), (220), (200) and (111) planes of face-centred-cubic (fcc) crystallographic structure of Au (JCPDS 4-0783) were denoted respectively by the 81.9°, 67.7°, 45.9° and 39.3° diffraction peaks of the biosynthesized Au NPs shown in the XRD spectrum. That the metallic Au was successfully fabricated was further verified by the results of XRD analysis.
Figure 1. (A) UV-vis spectrum of biosynthesized Au nanoparticles, (B) High resolution Au 4f XPD scan of biosynthesized Au nanoparticles. (C) XRD profile of the biosynthesized Au nanoparticles.
[image:5.596.63.528.503.636.2]
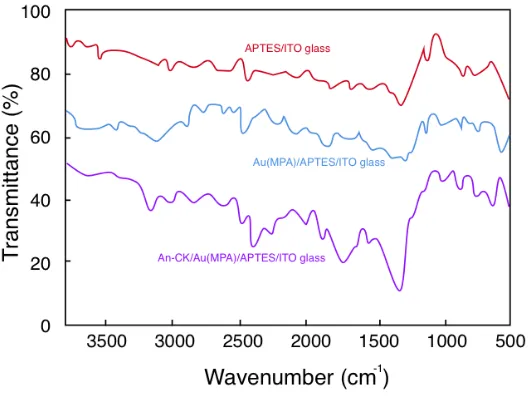
stretching vibrations in the MPA-functionalized Au NP carboxylic species accounts for the peak at 1745 cm−1. The –OH stretching and bending vibrations of the carboxylic acid species are apparent from the 2964 and 931 cm−1 peaks. N–H stretching and bending vibrations could be, respectively, described by the extra 3387 and 1611 cm−1 peaks after the Ab-CK was immobilized. The generation of the amide bond between Ab-CK molecules and Au(MPA) nanoparticles is supported by the above results.
[image:6.596.154.418.421.619.2]The capacity of measuring the property of monolayer films is a remarkable advantage of Cyclic voltammetry. These films would impede the shift reactions at the interface of electrolyte and the electrode modified by APTES. Note that in this blocking mechanism, a redox couple was employed as a probe molecule. The peak-to-peak potential separation (ΔEp) was about 50 mV at and the ratio of the redox peak current Ipa/Ipc was about 1 suggesting that the electrochemical reaction is reversible as a result of the construction of the AuNPs and the small peak-to-peak separation indicated a fast electron transfer rate [24, 25]. EIS is an efficient instrumental technique capable of quantitatively and qualitatively characterizing the electrochemical courses at the interface of an electrode and a solution (modified electrodes), and is regarded as a major method of immunosensor behaviour evaluation. The response of the this system after AC signal with insignificant amplitude at diverse frequencies is observed via EIS. Data regarding significant reaction rates can be gathered at the interface of electrode/solution, though chemical bonds or intermediates identification cannot be achieved via this method.
Figure 2. FTIR spectra of APTES/ITO-glass Au(MPA)/APTES/ITO-glass and Ab-CK/Au(MPA)/APTES/ITO-glass.
electrode and (iv) electron-transfer resistance. The second one is attributed to ion diffusion from bulk electrolyte into the interface of the electrode, and the third one is associated with the electrode surface condition. Replacing the classical capacitance with a constant phase element (CPE) contributes to the modification of the equivalent circuit model; thus, surface heterogeneity or roughness of the electrode could be incorporated with Helmholtz double layer. The real component of impedance (Z′) generally indicates electron transfer resistance (Ret) which has been observed to be favorable than capacitive changes. Moreover, the responses of the antibody–antigen interaction are most desirably reflected by the real component of impedance (Z′) in sensitiveness and directness. Despite the possible similar performance of the imaginary component (−Z″) (not shown), this work employed the real component of the impedance as the sensor signal to recognize analyte [26]. CPE is also arranged parallel to Zw and Ret. In addition, the three circuits are arranged in series with Rs. The CPE associated impedance is presented in the equation as follows:
0
( ) 1/ (
)
nCPE
Z
Y j
modified by a non-carboxyl-functionalized Au NPs in the absence of MPA capping. The unbound electrons transport from the probe to the surface of the electrode is revealed from the substantial Ret decline to 9.0 Ω cm2
. This variation coincides with the decline in the semicircle diameter, as revealed in the Nyquist plot. The large amount of unbound carboxyl species on the Au/(MPA)/APTES/ITO-glass electrode surface is confirmed by the utmost significant relative signal variation in terms of the Au(MPA)-NP-modified electrode in comparison with the Au NP-modified electrode. Moreover, Y0 declining to 2.36 μF/cm2 and the value of Ret increasing to 188.1 Ω cm2 (ina remarkable degree) occurred presumably because the antibody of cardiac myoglobin protein is covalently immobilized on the Au(MPA) NPs over the surface of the electrode, and BSA blocks non-specific binding sites. The data support the idea that the protein molecule is functioning as insulation, impeding the probe in its mass and charge transport to the surface of the electrode.
Figure 3. Nyquist plots determined for the original ITO glass plate; APTES/ITO-glass; Au(MPA)/APTES/ITO-glass; Au/APTES/ITO-glass and Ab-CK/Au(MPA)/APTES/ITO-glass in 2 mM [Fe(CN)6]3−/4− with 0.1 M KCl (voltage: 0.05 V; Frequency range: 1 Hz - 100 kHz.).
[image:8.596.208.371.276.433.2]
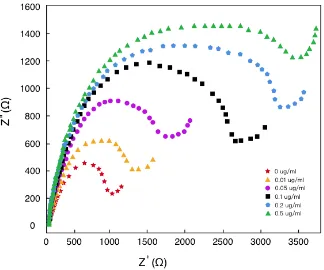
Figure 4. Faradaic impedance spectra of the Ab-CK/Au(MPA)/APTES/ITO-glass electrode preceding and succeeding incubation with diverse concentrations of Ag-CK in PBS (pH 7.4) with 0.1 M KCl solution containing 2 mM [Fe(CN)6]3−/4− (voltage: 0.05 V; Frequency range: 1 Hz - 100 kHz).
The variation in specific electron charge transfer resistance (ΔRet = (Ret)after immunoreaction − (Ret)control) vs. the logarithmic value of Ag-CK concentration (10 ng/mL - 0.5 μg/mL) was plotted to assess the sensitivity of the as-biosynthesized electrode (Figure 5). Herein, 3.7 ng/mL was determined to be the detection limit, which is triple the ratio of signal-to-noise. In addition, the proposed Ab-CK/Au(MPA)/APTES/ITO-glass electrode was utilized to analyze the CK in serum sample. The results of CK content determination in these serum samples were showed in Table 1. As shown, the Ab-CK/Au(MPA)/APTES/ITO-glass electrode has an excellent performance of CK detection for real samples. Additionally, we have compared this electrode with some other modified electrodes for the determination of CK, as summarized in Table 2.
Table 1. The contents and recoveries of Ab-CK/Au(MPA)/APTES/ITO-glass electrode for CK determination in serum (n=3).
No. Added (μg/mL) Found (μg/mL) Chromatographic detection (μg/mL)
Recovery (%) RSD (%)
Serum 1 0.05 0.0487 0.0519 97.40 2.74
[image:9.596.145.469.81.351.2] [image:9.596.50.552.665.752.2]
Table 2. CK determination performance comparison between Ab-CK/Au(MPA)/APTES/ITO-glass electrode and other reports.
Detection method LR (μg/mL) DL (μg/mL) Reference
Enzymes catalytic activity concentrations method
0.4-200 0.05 [28]
chromatographic technique ― 0.05 [29]
ELISA ― 0.42 [30]
Ab-CK/Au(MPA)/APTES/ITO-glass 0.01-0.5 0.0037 This work
Figure 5. Relationship between logarithm of concentration and Faradaic impedance spectra.
Under no competition circumstances, the selectivity of the sensor was evaluated. Myoglobin (Myo), BSA, troponin T (TnT) and other biological fluids are potential materials for interference, thus they were chosen as the interfering groups to be tested. Concentrations of 50 ng/mL Myo, 50 ng/mL of TnT, together with 100 ng/mL of CK were tested in the non-competition assay. The concentration levels of cardiac biomarkers which are typically present in the serum during ischaemic heart episodes are employed for this experiment. The peak current in terms of Myo varied by +3.1%, while that of TnT by +5.5%. To make sure of desirable reproducibility, triple assays were conducted by means of diverse Au SPE.
4. CONCLUSION
[image:10.596.47.536.111.241.2] [image:10.596.185.422.280.480.2]
EIS biosensor capable of rapid diagnosis of injuries concerning muscles and AMI. This designed EIS sensor features a linear CK concentration detection in the range of 10 ng/mL to 0.5 μg/mL (with 5.3 ng/mL as the limit of detection).
References
1. C. Liu, L. Jiang, H. Wang, Z. Guo and X. Cai, Sensors and Actuators B: Chemical, 122 (2007) 295. 2. G. Davis, M. Green and H. Hill, Enzyme and microbial technology, 8 (1986) 349.
3. F. Moreira, R. Dutra, J. Noronha and M. Sales, Biosensors and Bioelectronics, 56 (2014) 217. 4. R. Lopes, Y. Lokhnygina, V. Hasselblad, K. Newby, E. Yow, C. Granger, P. Armstrong, J.
Hochman, J. Mills and W. Ruzyllo, Trials, 14 (2013) 123.
5. R. Mani, O. Herasymowych and C. Kay, International Journal of Biochemistry, 11 (1980) 207. 6. V. Glaser, G. Leipnitz, M. Straliotto, J. Oliveira, V. dos Santos, C. Wannmacher, A. de Bem, J.B.T.
Rocha, M. Farina and A. Latini, Neurotoxicology, 31 (2010) 454.
7. T. Hoshino, Y. Sakai, K. Yamashita, Y. Shirahase, K. Sakaguchi, A. Asaeda, K. Kishi, U. Schlattner, T. Wallimann and M. Yanai, Scandinavian Journal of Clinical and Laboratory Investigation, 69 (2009) 687.
8. T. Toyoda, S. Kuan and G. Guilbault, Anal. Chem., 57 (1985) 2346.
9. T. Costa, C. Strunz, J. Nicolau and P. Gutierrez, The American Journal of Cardiology, 101 (2008) 311.
10.T. Kurihara, A. Yanagida, H. Yokoi, A. Koyata, T. Matsuya, J. Ogawa, Y. Okamura and D. Miyamoto, Analytical Biochemistry, 375 (2008) 144.
11.K. Lo, S. Hurst, K. Atkinson, T. Vandenbogaerde, C. Beaven and J. Ingram, Journal of Science and Medicine in Sport, 13 (2010) 117.
12.J. Vidal, J. Bertolín, L. Bonel, L. Asturias, M. Arcos-Martínez and J. Castillo, Journal of Pharmaceutical and Biomedical Analysis, 125 (2016) 54.
13.V. Lattanzio, B. Ciasca, S. Powers and C. von Holst, TrAC Trends in Analytical Chemistry, 76 (2016) 137.
14.G. Liu and C. Chai, Analytical Methods, 7 (2015) 1572.
15.Q. Fang, L. Wang, Q. Cheng, Y. Wang, S. Wang, J. Cai and F. Liu, Food Anal. Methods, 8 (2015) 1248.
16.L. Du, W. Ji, Y. Zhang, C. Zhang, G. Liu and S. Wang, The Analyst, 140 (2015) 2001. 17.Q. Yu, H. Li, C. Li, S. Zhang, J. Shen and Z. Wang, Food Control, 54 (2015) 347.
18.C. Song, C. Liu, S. Wu, H. Li, H. Guo, B. Yang, S. Qiu, J. Li, L. Liu and H. Zeng, Food Control, 59 (2016) 345.
19.J. Zhang, P. Shi, P. Yan, M. Wang, Q. Tang, A. Deng and J. Li, Journal of The Electrochemical Society, 162 (2015) B22.
20.N. Khunrattanaporn, P. Rijiravanich, M. Somasundrum and W. Surareungchai, Biosensors and Bioelectronics, 73 (2015) 181.
21.Z. Farka, T. Juřík, M. Pastucha, D. Kovář, K. Lacina and P. Skládal, Electroanalysis, 28 (2016) 1803.
22.L. Yu, Y. Zhang, C. Hu, H. Wu, Y. Yang, C. Huang and N. Jia, Food Chemistry, 176 (2015) 22. 23.V. Vilas, D. Philip and J. Mathew, Journal of Molecular Liquids, 221 (2016) 179.
24.S. Pakapongpan, R. Palangsuntikul and W. Surareungchai, Electrochimica Acta, 56 (2011) 6831. 25.Y. Lin and P. Peng, Anal. Chim. Acta., 869 (2015) 34.
26.Y. Lin, J. Luo, C. Chiou, C. Yang, C. Wang, C. Chou and C. Lai, Sensors and Actuators B: Chemical, 186 (2013) 374.
27.S. Radke and E. Alocilja, Biosensors & bioelectronics, 20 (2005) 1662.
Nutrition, and Metabolism, (2017) 1.
29.C. Smith, L. Bernstein, R. Davis, D. Rind and R. Shmerling, Archives of Internal Medicine, 163 (2003) 688.
30.M. Levy, D. Heels-Ansdell, R. Hiralal, M. Bhandari, G. Guyatt, S. Yusuf, D. Cook, J. Villar, M. McQueen and E. McFalls, The Journal of the American Society of Anesthesiologists, 114 (2011) 796.
![Figure 3. Nyquist plots determined for the original ITO glass plate; APTES/ITO-glass; Au(MPA)/APTES/ITO-glass; Au/APTES/ITO-glass and Ab-CK/Au(MPA)/APTES/ITO-glass in 2 mM [Fe(CN)6]3−/4− with 0.1 M KCl (voltage: 0.05 V; Frequency range: 1 Hz - 100 kHz.)](https://thumb-us.123doks.com/thumbv2/123dok_us/1820102.137634/8.596.208.371.276.433/figure-nyquist-determined-original-aptes-aptes-voltage-frequency.webp)