Int. J. Electrochem. Sci., 13 (2018) 11375 – 11387, doi: 10.20964/2018.12.22
International Journal of
ELECTROCHEMICAL
SCIENCE
www.electrochemsci.org
Potentiometric Studies of a New Solid-state Contact Iron(III)-
Selective Electrode Based on Morin-Fe
2+Shiff Base Complex.
Tugba Ozer, Ibrahim Isildak*
Faculty of Chemistry-Metallurgy, Department of Bioengineering, Yildiz Technical University, 34220, Istanbul, Turkey
*
E-mail: [email protected]
Received: 31 July 2018 / Accepted: 20 August 2018 / Published: 5 November 2018
In this study, we focused on developing a new miniaturized solid-state contact PVC based iron(III)-selective electrode using morin-Fe2+ shiff-base complex as the sensing material for environmental monitoring of iron(III) ions. The membrane composition of the electrode was optimized and the potentiometric performance characteristics of the electrode including selectivity, detection limit, pH range, response time, concentration range and potential stability were investigated. The results indicated that the electrode showed super Nernstian response of 56.14 ± 0.22 mV/decade over the wide linear concentration range 1.0×10⁻⁶ to 1.0×10⁻¹ M, and a very low detection limit of 4.5×10⁻⁷ M. The potentiometric response of the fabricated electrode was independent at pH 5-10 and the electrode showed a very short response time (<10 s). It exhibited excellent selectivity towards iron(III) ion over various cations including iron(II) ions. The proposed electrode was successfully applied for rapid inexpensive in-situ analysis of iron(III) ion in acid mine drainage and soil samples with comparison to inductively coupled plasma optical emission spectrometry (ICP-OES) analysis method, and the results obtained were agreeable with each other.
Keywords: PVC membrane, solid-state contact electrode, iron(III), potentiometry, environmental monitoring
1. INTRODUCTION
compared with other transition metals and may enter into natural waters as pollutant due to its various industrial applications [6]. Although its presence has adverse effects in environment, it can lead phytoplanktons to grow as a limiting growth nutrient in southern oceans [7]. Since the quantitative detection of iron(III) ions is crucial in both environmental and biological samples, ion selective electrodes (ISEs) as mobile, miniaturized, simple, rapid, and low cost devices can be used to monitor iron(III) ions. Yet, the number of reports on developing iron(III)-selective electrodes are limited [8-14, 41-47]. Thus, it is challenging and still interest to design iron(III)-selective electrodes. Solid state-contact poly (vinyl chloride) (PVC) based polymeric membrane electrodes offer an alternative platform by eliminating inner reference solution to achieve better response properties as compared to conventional PVC based polymeric membrane electrodes [15-19].
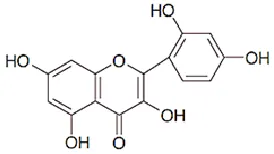
[image:2.596.232.369.509.586.2]Shiff-base compounds can form durable and selective complexes with metal ions, and it is possible to use them for their separation and determination [20-22]. They have been applicable to construct membrane sensors for detection of metal ions [23, 24]. Morin (Figure 1) is a flavonoid compound that has chelating properties to metal cations, e.g. iron. [25-27]. Carbonyl and hydroxyl groups present in flavonoids molecules help to occur chelation [28]. There are some of previously reported methods found in the literature about morin and its metal complexes [28-30]. In addition, metal ions react with morin in aqueous medium in the range pH: 2.0-7.0 forming colored complexes with different stoichiometry [31]. However, in some previous studies, morin has been used for the spectrophotometric determination of iron based on the reaction of morin in slightly acidic solution with iron(II) resulting in a highly absorbent light green chelate product [32]. Hence, in the present study, we decided to use morin-Fe2+ complexation as a carrier for constructing a polymeric membrane for the potentiometric detection of iron(III) ion and investigated the effects of the membrane compositions to attain better electrode response characteristics. The developed electrode was successfully applied for the determination of iron(III) ions in complex environmental samples.
Figure 1. Chemical structure of morin
2. EXPERIMENTAL 2.1 Reagents
phthalate (DBP), dioctyl phthalate (DOP) were purchased from Fluka (Bucks, Switzerland). Epoxy (Macroplast Su 2227) and hardener (Desmodur RFE) were purchased from Henkel (Istanbul, Turkey) and Bayer AG (Darmstadt, Germany) respectively. All solutions were freshly prepared by suitable dilution with using water purified in a Millipore Milli-Q system from their stock solution of 0.1 M and kept in dark. The pH of the solutions was adjusted with (0.01-0.1 M) HNO3 and NaOH (Merck, Germany). For potentiometric titration, ethylenediaminetetraacetic acid disodium salt (EDTA) (Sigma-Aldrich, Germany) was used. All of the cationic solutions were prepared from nitrate and chloride salts and used without any further purification except for vacuum drying over P2O5. All glass apparatus was acid washed in 1.0 mol L-1 nitric acid when not in use.
2.2 Apparatus
A computer-controlled high-input impedance multi-channel potentiometric measurement system (sensitivity ±0.1 mV) with a custom-made software program (Medisen Ar-Ge, Turkey) was used in order to carry out the potentiometric measurements. All electrode potentials were measured against the potential of a Ag/AgCl reference electrode (RE) (MF-2052 model, BASi) with a 3 M NaCl aqueous filling solution that has been saturated with AgCl. HI9126 (Hanna Instruments) waterproof portable pH/mV meter including the HI1230B double junction pH electrode was used to monitor the pH of the solutions. The pH-electrode was calibrated by using pH standard buffer solutions (Hanna Instruments) for pH 4, 7 and 10 before each experiment. Branson ultrasonic bath (USA) was used to homogenize solutions at essential concentrations. Dissolved oxygen (DO) was measured using an Oakton DO 300 Series field meter; temperature, pH, and oxidation-reduction potential (ORP) were measured with Beckman U265 pH/Temp/mV meters; and an Oakton CON 400 series field meter was used to measure conductivity. Inductively coupled plasma optical emission spectrometry (Optima 7300DV ICP-OES, Perkin Elmer, USA) was applied for analysis of environmental samples.
2.3 Electrode preparation and measurements
The all-solid-state micro-sized electrodes were constructed via a dip-coating method based on our previous works [15, 33, 34]. Afterwards, the Fe(II)-morin complex as the ionophore was synthesized according to the procedure described before [31, 32]. The membrane composition, listed in Table 1, consisting of 32% (w/w) high molecular poly (vinyl chloride), 4% (w/w) of ionophore, 63.5% (w/w) DOS as plasticizer, 0.5% (w/w) KTpClPB as anion excluder were dissolved in 4 mL of dry freshly distilled THF. The conductive material of the electrode was dipped into this oily mixture solution for about 10 s in order to form a PVC membrane. The electrode was left to dry at room temperature for 4 h and then, conditioned into a 1×10⁻² M FeCl3 solution for 12 h before utilization. Before each measurement of test solutions, the electrodes were rinsed with deionized water and stored in the laboratory conditions when it is no longer in use.
electrode at steady-state were measured for different concentrations of standard solutions of Fe3+ respectively. All measurements were carried out under zero-current flow and at 25 °C with cell of the type:
Micro-sized Ag/AgCl RE | Test solution | PVC membrane | Conductive material | Cu wire.
2.4 Preparation of sample solution
The acid mine drainage sample was collected from Brubaker Run (Pennsylvania, USA) and the Pahokee peat soil was obtained from International Humic Substances Society (IHSS), Florida, USA. All samples were filtered through 0.45 µm cellulose membrane filter before analysis and kept in bottles. Afterwards, pH of the sample solutions was measured with pH meter. 15 mL aliquots of 10-6 -10-2 mol L-1 iron(III) solution were transferred into 25 mL beaker at 250C and the pH of each solution adjusted to the required acidity using small amount of NaOH/HNO3. Then, the calibration curves were obtained by immersing the electrode in conjugation with micro-sized Ag/AgCl reference electrode in the solutions. The emf measurements were plotted versus the logarithm of iron(III) concentration to determine iron(III) content of the sample solutions.
3. RESULTS AND DISCUSSION
3.1 Response Characteristics of the Electrodes
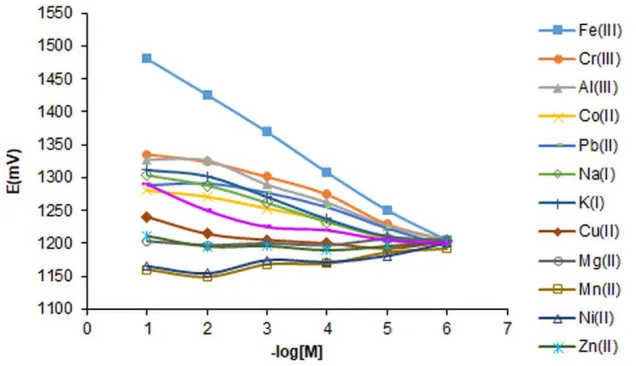
Figure 2. The potential response of all solid-state contact PVC membrane Fe3+-selective electrode against Fe3+ and some cations.
[image:4.596.141.459.447.630.2]
interactions with the ionophore used. Consequently, morin-Fe2+ shiff base complex was employed as an ionophore for the fabrication of iron(III)-selective electrode.
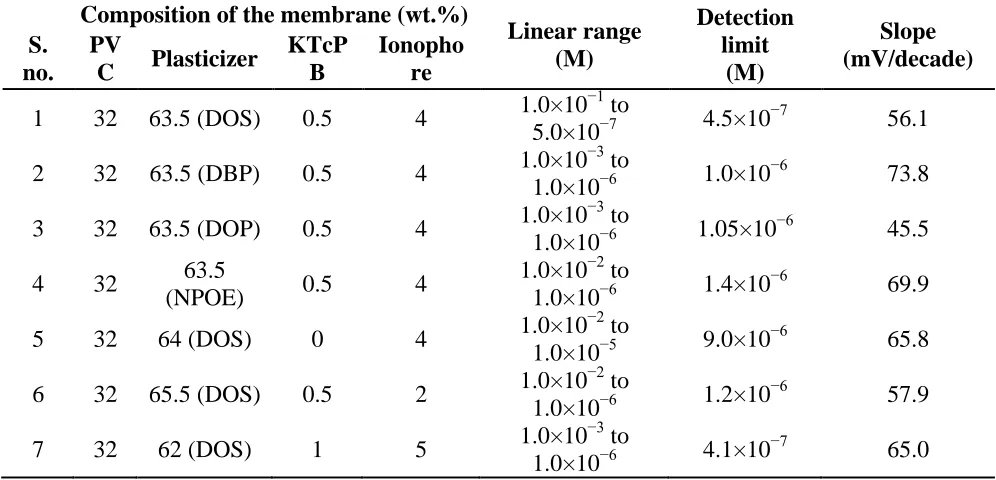
It is well known that the membrane composition and the nature of solvent mediator and additives used significantly affect the sensitivity and selectivity of the electrode [18, 35, 36]. Thus, the effect of different membrane compositions on the response characteristics of fabricated Fe3+ ion-selective electrode were investigated in order to determine the best electrode composition and the results were summarized in Table 1.
[image:5.596.49.547.426.666.2]Plasticizer is an important component of the electrode and has effects on the dielectric constant of membrane, mobility of ionophore molecules and the state of ionophore. The plasticizers not only enhance the workability of the membranes, but also improve the working concentration range, stability and life span of the electrode [37, 38]. In this research, four plasticizers namely NPOE, DOS, DBP, DOP were tested. The effect of plasticizers on the characteristics of iron(III) selective electrode is also shown in Table 1. The results displayed that the membrane containing DOS as plasticizer has the widest concentration range 1×10⁻¹ to 1×10⁻⁶ M with the lowest detection limit for iron(III) ions among the other plasticizers. Besides plasticizer, the presence of lipophilic negatively charged additives enhances the potentiometric behavior of certain selective electrodes. It reduces the ohmic resistance and improve selectivity and sensitivity of the membrane electrode as well. The optimum KTpClPB amount was found to be 0.5 mg for the preparation of the membrane mixture.
Table 1. Composition and response characteristics of solid-state contact iron(III) selective electrodes. Composition of the membrane (wt.%)
Linear range (M) Detection limit (M) Slope (mV/decade) S. no. PV
C Plasticizer
KTcP B
Ionopho re
1 32 63.5 (DOS) 0.5 4 1.0×10
−1 to
5.0×10⁻⁷ 4.5×10
−7
56.1
2 32 63.5 (DBP) 0.5 4 1.0×10
−3 to
1.0×10⁻⁶ 1.0×10
−6
73.8
3 32 63.5 (DOP) 0.5 4 1.0×10
−3 to
1.0×10⁻⁶ 1.05×10 −6
45.5
4 32 63.5
(NPOE) 0.5 4
1.0×10⁻² to
1.0×10⁻⁶ 1.4×10
−6
69.9
5 32 64 (DOS) 0 4 1.0×10
−2 to
1.0×10⁻⁵ 9.0×10
−6
65.8
6 32 65.5 (DOS) 0.5 2 1.0×10
−2 to
1.0×10⁻⁶ 1.2×10
−6
57.9
7 32 62 (DOS) 1 5 1.0×10
−3 to
1.0×10⁻⁶ 4.1×10
−7
65.0
detection limit of the electrode was determined from the intersection of the two extrapolated segments of the calibration graph and found to be 4.5×10⁻⁷ mol L-1.
Figure 3. Calibration curve of all solid-state contact PVC membrane Fe3+-selective electrode.
3.2 Effect of pH
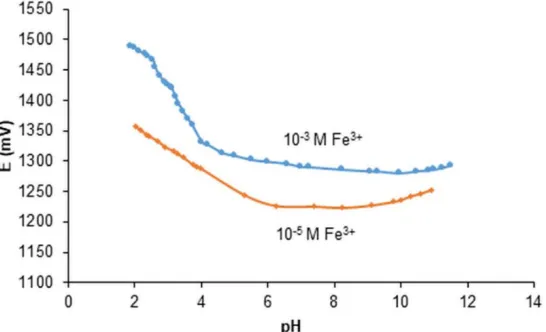
The pH dependence of the electrodes was investigated over the pH range 2-11 at a 1.0×10⁻³ mol L-1 and 1.0×10⁻⁵ mol L-1 Fe3+ ion concentration by using concentrated HNO3 or NaOH solutions, and a typical pH behavior for the electrode is shown in Figure 4. The potential response of the electrode was stable in the pH range 5.0-10.0. The observed potential deviation at higher pH values could be on account of the formation of some hydroxyl complexes of Fe3+ such as Fe(OH)3 and Fe(OH)2 in the solution where the population of iron(III) ions decreases [39, 40]. In addition, the electrode potential increased at pH values lower than 5.0 due to the protonation of ionophore. In this case, the electrode give response to hydrogen ions. Thus, the pH range of 5.0-10.0 was chosen for the working pH range of the electrode assembly in further experiments.
Figure 4. Effect of pH on the potential response of the electrode in the presence of 1×10⁻³ M and 1×10 -5
[image:6.596.143.451.135.308.2] [image:6.596.162.435.560.726.2]
3.3 Potentiometric selectivity of all solid-state contact Fe3+-selective electrode
The selectivity behavior, which indicates ion-selective electrode specificity of the target ion in the presence of interfering ions, is one of the most important characteristics of an ion selective electrode. The selectivity coefficients of the prepared electrode were determined for a number of transition and heavy metal ions using the separate solution method (SSM) [41]. One of the solution includes the main ion i at the activity ai, and the other one includes only the interfering ion j at the activity aj. Where E1, E2 and zi, zj are the measured potentials and charges on the ions i and j respectively. can be calculated using the following equation (I):
( ) (I)
In this study, a variety of mono, di, and trivalent cations were investigated as interfering ions. The selectivity coefficient values ( ) given in Table 2 show that the electrode has a high selectivity towards iron(III) satisfactorily in the presence of Na+, K+, Ca2+, Fe2+, Cu2+, Zn2+, Mn2+ Mg2+, Ni2+, Pb2+, Co2+,Cr3+, Al3+.
Table 2. Selectivity coefficients of various ions (J) for the electrode. interfering ions
(j)
Cr3+ -3.34
Al3+ -2.71
Co2+ -4.38
Pb2+ -3.60
Cu2+ -5.49
Mg2+ -5.00
Mn2+ -5.50
Ni2+ -5.50
Zn2+ -5.66
Na+ -3.74
K+ -2.54
Fe2+ -4.32
3.4 Response time and lifetime
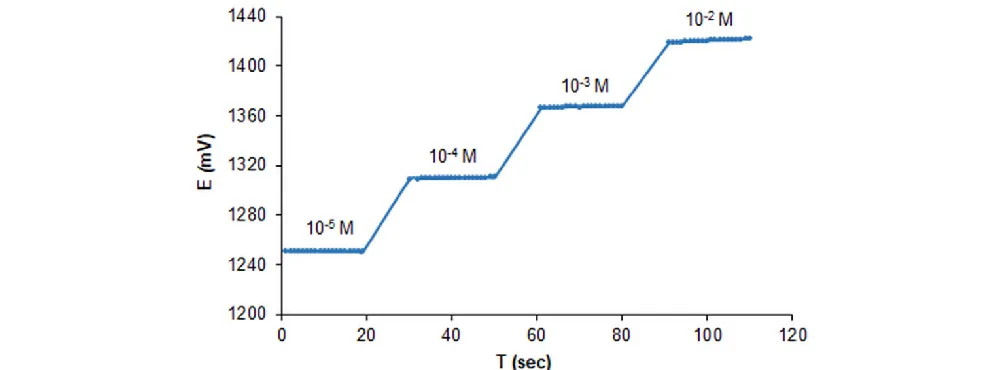
The response time of an ion-selective electrode is also another critical parameter in terms of analytical application. The dynamic response time of the electrode was tested by measuring the average time required to achieve a 95% value of steady potential for an iron solution, after the electrode was submerged sequentially in a series of iron(III) solutions, each having a 10-fold difference in concentrations. The average static response time was obtained with in <10s (Figure 5) at various activities 1.0×10⁻⁵-1.0×10⁻² M of the test solutions.
Figure 5. Dynamic response time of the suggested electrode for step changes in the concentration of Fe3+.
3.5 Reproducibility and repeatability of the electrode response
The reproducibility of the electrode was investigated by a series of four membrane with similar composition (No 1) and the response of these electrodes to Fe3+ ion concentration were tested. The calibration curves were plotted to investigate the repeatability and reproducibility of the proposed electrode. The same electrode was used during four replicate measurements for the repeatability study of the electrode while the responses of four similar electrodes to Fe3+ ion concentration were tested for the reproducibility of the electrode in the concentration range of 1.0×10⁻¹ -1.0×10⁻⁶ M of iron(III) solutions, and shown in Table 3. The results reveal that the standard deviation of measurements of 1.0×10⁻¹ M to 1.0×10⁻⁶ M of Fe3+ solution with these four electrodes was ±1.66 mV. The lower values of the coefficient variation also showed repeatability, reproducibility and precision of the all solid-state contact iron(III)-selective electrode.
Table 3. Repeatability and reproducibility of the iron(III)-ISE. Nernstian slope
(mV/decade) Average
SDa
(mV) CVb (%) Reproducibility 52.63, 55.29, 56.14,
56.14 55.05 1.66 3.02
Repeatability
55.91, 56.14, 56.20,
56.31 56.14 0.22 0.40
a
[image:8.596.47.545.75.260.2]
3.6 Analytical applications
Since the proposed electrode worked well under laboratory conditions, the analytical validation of this membrane electrode was applied as an indicator electrode for the determination of iron in acid mine drainage and soil samples by direct potentiometry using the calibration graph and inductively coupled plasma optical emission spectrometry (ICP-OES) analysis methods. The method was repeated several times to check the accuracy and reproducibility of the proposed method.
3.6.1 Determination of iron(III) in acid mine drainage sample
The acid mine drainage sample was collected from Brubaker Run (Pennsylvania, USA), and its physico-chemical conditions analyzed in-situ and showed in Table 4. About 10 mL acid mine drainage sample (Table 5) was transferred to a 25 mL beaker and then iron(III) ion content was determined via potentiometric calibration by using the fabricated electrode in order to validate the accuracy of fabricated electrode in acid mine drainage samples (Table 5).
[image:9.596.45.537.380.483.2]Table 4. Field sampling from Brubaker Run and Physico chemical conditions (measured in situ) of the sample.
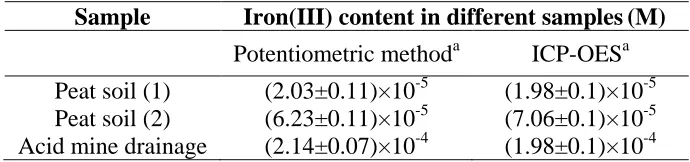
Table 5. Determination of iron(III) ions in different samples matrices by the fabricated electrode. Sample Iron(III) content in different samples(M)
Potentiometric methoda ICP-OESa Peat soil (1) (2.03±0.11)×10-5 (1.98±0.1)×10-5 Peat soil (2) (6.23±0.11)×10-5 (7.06±0.1)×10-5 Acid mine drainage (2.14±0.07)×10-4 (1.98±0.1)×10-4 a
Mean value±standard deviation (three measurement).
3.6.2 Determination of iron(III) in soil samples
Soil samples were dried and added to 15 mL of distilled water in a beaker. Then, it was allowed to stay overnight to extract iron(III) ions to the solution and filtrated with Whatman filter paper. The pH of the prepared soil solution was adjusted to 4.6 with concentrated HNO3, iron(III) was
WGS84 Coordenates
Latitute (decimal degrees)
Longitude (decimal degrees)
Accurac y (m)
Temperatu re (⁰C )
Conductivity (mS/cm)
DO% DO
(mg/L)
pH ORP (mV)
40.617110 N
78.476344 W
5 11.36 2.072 10.5 1.14 3.30 361.3
[image:9.596.125.470.549.630.2]
determined by potentiometric calibration method as described above (Table 5). As seen in Table 5, the results obtained by potentiometric method were in good agreement with the reference methods for all sample types studied.
3.6.3 Potentiometric titration
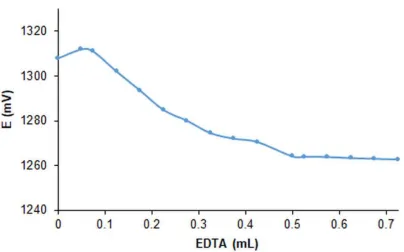
The proposed iron(III) ion-selective electrode was also successfully employed as an indicator electrode in the titration of 50 mL of Fe3+ solution (1.0×10⁻⁴ M) with a standard EDTA solution (1.0×10⁻² M), and the resulting titration curve was shown in Figure 6. As can be seen from Figure 6, the potential values declined because the free iron(III) ions concentration decreased by adding EDTA to the solution because of its ability to form a complex with EDTA. The potential response after the end point of the curve remained constant due to a 1:1 stoichiometry of the EDTA-Fe3+ complex. Therefore, iron(III) ions concentration can be determined accurately by employing this electrode as an indicator electrode.
Figure 6. Potentiometric titration of 50 mL of iron(III) (1×10⁻⁴ mol L-1) with EDTA (1×10⁻² mol L-1).
3.7 Comparison study
[image:10.596.92.496.337.589.2]
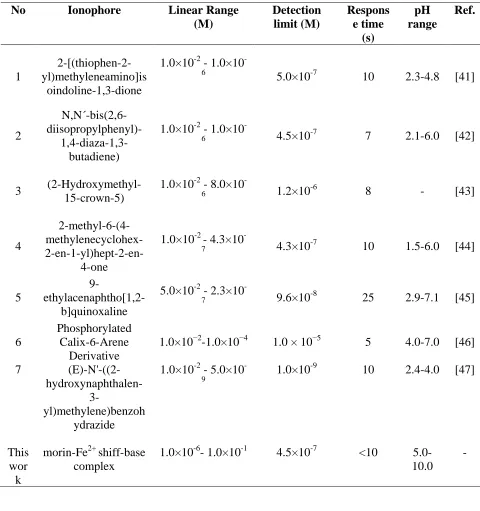
Table 6. Comparison study of the developed iron(III) selective electrode with other electrodes. No Ionophore Linear Range
(M) Detection limit (M) Respons e time (s) pH range Ref. 1 2-[(thiophen-2-yl)methyleneamino]is oindoline-1,3-dione
1.0×10⁻² - 1.0×10 -6
5.0×10⁻⁷ 10 2.3-4.8 [41]
2
N,N´-bis(2,6-
diisopropylphenyl)- 1,4-diaza-1,3-butadiene)
1.0×10⁻² - 1.0×10
-6 4.5×10⁻⁷ 7 2.1-6.0 [42]
3 (2-Hydroxymethyl-15-crown-5)
1.0×10⁻² - 8.0×10
-6 1.2×10⁻⁶ 8 - [43]
4
2-methyl-6-(4- methylenecyclohex-
2-en-1-yl)hept-2-en-4-one
1.0×10⁻² - 4.3×10
-7 4.3×10⁻⁷ 10 1.5-6.0 [44]
5
9- ethylacenaphtho[1,2-b]quinoxaline
5.0×10⁻² - 2.3×10
-7 9.6×10⁻⁸ 25 2.9-7.1 [45]
6
Phosphorylated Calix-6-Arene
Derivative
1.0×10⁻²-1.0×10⁻⁴ 1.0 × 10⁻⁵ 5 4.0-7.0 [46]
7
(E)-N'-((2- hydroxynaphthalen-
3-yl)methylene)benzoh ydrazide
1.0×10⁻² - 5.0×10 -9
1.0×10⁻⁹ 10 2.4-4.0 [47]
This wor
k
morin-Fe2+ shiff-base complex
1.0×10⁻⁶- 1.0×10⁻¹ 4.5×10⁻⁷ <10 5.0-10.0
-
4. CONCLUSION
[image:11.596.57.537.96.607.2]
accuracy. For future studies, we aim to use this electrode in flow injection analysis focusing on continuous environmental sample monitoring.
ACKNOWLEDGEMENTS
This work was financially supported by The Scientific and Technological Research Council of Turkey (TUBITAK) within 2211-National Ph.D. Fellowship Programme; 2214/A International Research Fellowship Programme for Ph.D. students; and Research Fund of Yildiz Technical University [project number 2016-07-04-DOP03].
AUTHOR DISCLOSURE STATEMENT
The authors declare that no conflicting financial interests exist.
References
1. R. K. Bera, M. Baral, S. K. Sahoo and B. K. Kanungo, Spectrochim. Acta A Mol. Biomol. Spectrosc., 134 (2015) 165.
2. J. M. Beckett and M. J. Ball, Eur. J. Nutr., 52 (2013) 255.
3. M. Khajeh, M. Kaykhaii, H. Hashemi and M. Mirmoghaddam, Polym. Sci. Ser. B, 51 (2009) 344. 4. E. Lapice, M. Masulli and O. Vaccaro, Curr. Atheroscler. Rep., 15 (2013) 358.
5. H. A. Zamani, M. R. Ganjali, F. Faridbod and M. Salavati-Niasari, Mater. Sci. Eng. C Mater. Biol. Appl., 32 (2012) 564.
6. A. Asan, M. Andac, I. Isildak and N. Tinkilic, Chem. Pap., 62 (2008) 345.
7. P. W. Boyd, T. Jickells, C. S. Law, S. Blain, E. A. Boyle, K. O. Buesseler, K. H. Coale, J. J. Cullen, H. J. W. de Baar, M. Follows, M. Harvey, C. Lancelot, M. Levasseur, N. P. Owens, R. Pollard, R. B. Rivkin, J. Sarmiento, V. Schoemann, V. Smetacek, S. Takeda,A. Tsuda, S. Turner and A. J. Watson, Science, 315 (2007) 612.
8. N. A. Papadopoulou, A. B. Florou, M. I. Prodromidis, Anal. Lett., 51 (2018) 198.
9. F. Kazemi, H. A. Zamani, F. Joz-Yarmohammadi, M. Ebrahimi and M. R. Abedi, Bul. Chem. Commun., 49 (2017) 449.
10.N. Mecheri, M. Benounis and H. Barhoumi, Sensor Rev., 37 (2017) 436.
11.D. Vlascici, E. Fagadar-Cosma, I. Popa, V. Chiriac and M. Gil Agusti, Sensors, 12 (2012) 8193. 12.H. A. Zamani, M. R. Abedi and M. R. Ganjali, J. Chil. Chem. Soc., 54 (2009) 186.
13.G. Ekmekci, D. Uzun, G. Somer and S. Kalaycı, J. Membr. Sci., 288 (2007) 36. 14.V. K. Gupta, A. K. Jain, S. Agarwal and G. Maheshwari, Talanta, 71 (2007) 1964.
15.I. Isildak, A. Attar, E. Demir, B. Kemer, H. Aboul Enein, Curr. Anal. Chem., 14 (2018) 43.
16.I. Isildak, O. Cubuk, M. Altikatoglu, M. Yolcu, V. Erci and N. Tinkilic, Biochem. Eng. J., 62 (2012) 34.
17.C. Zuliani and D. Diamond, Electrochim. Acta, 84 (2012) 29.
18.I. Isildak, F. Coldur, M. Andac and T. Saka, J. Electroanal.l Chem., 626 (2009) 30. 19.E. Lindner and R. E. Gyuresanyl, J. Solid State Electr., (2009) 1351.
20.O. R. Hashemi, M. R. Kargar, F. Raoufi, A. Moghimi, H. Aghabozorg and M. R. Ganjali, Microchem. J., 69 (2001) 1.
21.Z. Ghasemi, F. Basiripour, T. Poursaberi, M. Salavati-Niasari, M. Shamsipur, O. R. Hashemi, F. Raoufi and M. R. Ganjali, Intern. J. Anal.Chem., 81 (2001) 233.
23.M. R. Ganjali, T. Poursaberi, L. Haji-aghababaei, S. Rouhani, M. Yousefi, M. R. Kargar, A. Moghimi, H. Aghabozorg and M. Shamsipur, Anal. Chim. Acta, 440 (2001) 81.
24.N. Alizadeh, S. Ershad, H. Naeimi, H. Sharghi and M. Shamsipur, Fresenius J. Anal. Chem., 365 (1999) 511.
25.Y. M. Temerk, M. S. Ibrahim and M. Kotb, Spectrochim. Acta, 71 (2009) 1830.
26.M. Balcerzak, A. Tyburska and E. Bieta Oewiecicka-Füchsel, Acta Pharm., 58 (2008) 327. 27.P. Venugopalan and K. Krishnankutty, J. Ind. Chem. Soc., 74 (1997) 562.
28.Q. K. Panhwar, S. Memon and M. I. Bhanger, J. Mol. Struct., 967 (2010) 47. 29.Q. K. Panhwar and S. Memon, Sci. World J., 2014 (2014) 1.
30.S. A. Farhan, Int. J. Chem. Sci., 11 (2013) 1247.
31.I. Isildak, Flow-Injection Spectrophotometric Analysis of Iron(II), Iron(III) and Total Iron, (2012) InTech.
32.M. J. Ahmed and U. K. Roy, Turk. J. Chem., 33 (2009) 709.
33.F. Coldur, M. Andac, I. Isildak and T. Saka, J. Electroanal. Chem., 626 (2008) 30.
34.I. Isildak, M. Yolcu, O. Isildak, N. Demirel, G. Topal and H. Hosgoren, Microchim. Acta, 144 (2004) 177.
35.M. H. Mashhadizadeh, I. Sheikhshoaie and S. Saeid-Nia, Sens. Actuators B Chem., 94 (2003) 241. 36.C. Mihali and N. Vaum, Recent Advances in Plasticizers, Mohammad Luqman, (2012) Intec,
Rijeka, Croatia.
37.E. Eugster, T. Rosatzin, B. Rusterhalz, B. Aebersold, U. Pedrazza, D. Ruegg, A. Schmid, U. E. Spinchinger and W. Simon, Anal. Chim. Acta, 289 (1994) 1.
38.T. A. Ali, A. A. Farag and G. G. Mohamed, J. Ind. Eng. Chem., 20 (2014) 2394.
39.T. A. Ali, G. G. Mohamed, M. M. I. El-Dessouky, S. M. Abou El Ella and R.T.F. Mohamed, Int. J. Electrochem. Sci., 8 (2013) 1469.
40.Y. Umezawa, P. Buhlmann and K. Umezawa, Pure Appl. Chem., 72 (2000) 1851. 41.H. A. Zamani and F. Faridbod, J. Anal.Chem., 69 (2014) 1073.
42.42 H. Wang, Z.Yan, S. Zhang, X. Wen and Y. Kang, Desalin. Water Treat., (2015) 1. 43.O. Isildak and O. Durgun, Int.J. Engin. Appl. Sci., 2 (2015) 1.
44.T. A. Ali, G. G. Mohamed and A. H. Farag, Int.J. Electrochem. Sci., 10 (2015) 564.
45.F. Mizani, M. R. Ganjali, F. Faridbod and S. Esmaeilnia, Int. J. Electrochem. Sci., 8 (2013) 10473. 46.M. M. Zareh, W. Zordek and A. Abd-Alhady, J. Sens.Tech., 4 (2014) 186.
47.A. Yari, M. Bagheri and M. Ghazizadeh, Int. J. Electrochem. Sci., 11 (2016) 6597.