THE EFFECT OF HIGH FREQUENCY WAVE IN VIBRO
ACOUSTIC METHOD FOR CRACK DETECTION
NURUL HUSNINA BINTI ANUAR
THE EFFECT OF HIGH FREQUENCY WAVE IN VIBRO ACOUSTIC METHOD FOR CRACK DETECTION
NURUL HUSNINA BINTI ANUAR
A report submitted
in fulfillment of the requirement for the degree of Bachelor of Mechanical Engineering (Plant & Maintenance)
Faculty of Mechanical Engineering
UNIVERSITI TEKNIKAL MALAYSIA MELAKA
ii
DECLARATION
I declare that this project report entitled “The Effect Of High Frequency Wave In Vibro
Acoustic Method For Crack Detection” is the result of my own work except as cited in the
references
Signature : ...
Name : Nurul Husnina Binti Anuar
iii APPROVAL
I hereby declare that I have read this project report and in my opinion this report is
sufficient in terms of scope and quality for the award of the degree of Bachelor of
Mechanical Engineering (Plant & Maintenance).
Signature :. ...
Name of Supervisor : Dr. Ruztamreen Bin Jenal
iv
DEDICATION
v ABSTRACT
vi
ABSTRAK
vii
ACKNOWLEDGEMENT
First and foremost, I would like to take this opportunity to express my sincere
acknowledgement to my supervisor Dr Ruztamreen Bin Jenal for his essential supervision,
support and encouragement towards the completion of this final year project, giving me the
space to grow intellectually and independently.
Besides that, I would like thank to Faculty Mechanical Engineering of University
Teknikal Malaysia Melaka (UTeM) for giving this opportunity to do this project and
providing me with a good environment and facilities to complete this project. Also, I
would like to thank En. Azhar and Tino Hermanto for all the valuable information and
guidance, which help me in completing the task through various stages.
Lastly, I would also like to thank my family and friends for their patience,
encouragement and continuous support regardless of any condition for me to complete this
viii
CONTENT
CHAPTER CONTENT PAGE
DECLARATION ii
APPROVAL iii
DEDICATION iv
ABSTRACT v
ABSTRAK
ACKNOWLEDGEMENT
vi vii
TABLE OF CONTENT viii
LIST OF FIGURES x
LIST OF TABLES xiii
LIST OF ABBREVIATIONS xiv
CHAPTER 1 INTRODUCTION 1
1.1 Background 1
1.2 Problem Statement 3
1.3 Objectives 4
1.4 Scope of Project 4
CHAPTER 2 LITERATURE REVIEW 5
2.1 Damage in Structures 5
2.2 Methods to Detect Fatigue Crack 7
2.3 Vibro-acoustic Method 8
CHAPTER 3 METHODOLOGY 13
3.1 Test Specimen Preparation
3.1.1 Crack Slot Preparation 3.1.2 Tensile Test
ix
3.1.3 Fatigue Test 3.2 Modal Analysis
3.3 Vibro-acoustic Method and Analysis
19 20 23
CHAPTER 4 RESULTS ANALYSIS AND DISCUSSION
4.1 Tensile Test 4.2 Fatigue Test 4.3 Modal Analysis
4.4 Non-Linear Vibro-Acoustic Test
4.5 Analysis of Non-Linear Vibro-Acoustic Test
4.6 Analysis of High-Frequency Dependence on Sideband
27 27 29 30 27 27 29 30 33 36 38
CHAPTER 5 SUMMARY AND RECOMMENDATIONS 41
REFERENCES 43
x
LIST OF FIGURES
FIGURE TITLE PAGE
2.1 Fatigue crack in structure 6
2.2 Three basic modes for fatigue crack 6
2.3 The principle of vibro-acoustic modulation (VAM) 8
2.4 Schematic figure of cross modulation between pump wave and probe wave.
9
2.5 Setup of Impact Modulation (IM) technique on a beam 10
2.6 Setup of the vibro-acoustic Method (VAM) testing using impact hammer
11
2.7 Setup of vibro-acoustic method (VAM) by using a shaker as exciter on a steel beam
11
2.8 Experimental arrangement by using PZT transducer and stack actuator on an aluminium plate
12
3.1 Experiment flow chart 14
3.2 Schematic drawing of the aluminium plate 16
3.3 EDM drilling hole machine 16
3.4 EDM wire cut machine 17
3.5 4 mm notch on the aluminium plate 17
xi
3.7 INSTRON Universal Testing Machine (UTM) 18
3.8 Aluminium plate was clamped into the UTM jigs 19
3.9 Schematic diagram of modal analysis experimental setup 20
3.10 Modal analysis experiment setup by using SLDV 21
3.11 Schematic drawing of plate during modal analysis experiment 22
3.12 Schematic diagram of vibro-acoustic test 24
3.13 (a) Vibro-acoustic experimental arrangement (b) enlarged PZT location
25
3.13 (b) Vibro-acoustic enlarged PZT location 25
3.14 Schematic drawing of plate during vibro-acoustic test 25
4.1 Tensile test graph of load vs extension 27
4.2 UTM machine control system 29
4.3 (a) Dynamic fatigue crack on the aluminium plate and 30
4.3 (b) Dynamic fatigue crack enlarged area. 30
4.4 (a) Input signal in time domain for modal analysis 31
4.4 (b) Output signal b) in time domain for modal analysis 31
4.5 Modal analysis result for vibration Frequency Response
Function of cracked aluminium plate. 32
4.6 Input and FFT signal for non-linear vibro-acoustic test 34
4.7 (a) Power spectra signal for 60 kHz (HF) 66 Hz (LF) - Overall 36
4.7 (b) Power spectra signal for 60 kHz (HF) 66 Hz (LF) - zoomed around the HF excitation.
37
4.8 Power spectra signal for 60 kHz (HF) 88.5 Hz (LF) 37
xii
4.10 (a) R-value for all the first sideband 40
4.10 (b) R-value for all the second sideband 40
xiii
LIST OF TABLES
TABLE TITLE PAGE
3.1 Material properties of the aluminium plate 15
3.2 Function generator parameter and configuration for modal analysis
22
3.3 SLDV parameter and configuration for modal analysis 23
3.4 Power amplifier parameter and configuration for modal analysis 23
3.2 Function generator parameter and configuration for vibro-acoustic test
26
3.3 SLDV parameter and configuration for vibro-acoustic test 26
3.4 Power amplifier parameter and configuration for vibro-acoustic test
26
4.1 Parameter of the mechanical properties obtained from the tensile test
27
4.2 Number of cycles, loads and loading frequency to create fatigue crack
29
4.3 Peaks and frequency value for cracked aluminium plate FRF 32
4.4 First sideband value (R-value1) for cracked aluminium plate 34
4.5 Second sideband value (R-value2) for cracked aluminium plate 35
4.6 Average of the sideband value (R-valueavg) for cracked aluminium plate
xiv
LIST OF ABBEREVATIONS
SHM Structural Health Monitoring NDE Non-Destructive Evaluation NDT Non-Destructive Testing
AE Acoustic Emission
UT Ultrasonic Testing RT Radiography Technique IT Infrared Thermography EDM Electronic Discharge Machine UTM Universal Testing Machine PSB Persistent Slip Bands VAM Vibro-Acoustic Modulation FEM Finite Element Method FE Finite Element
IM Impact Modulation
SLDV Scanning Laser Doppler Vibrometer PZT Piezoceramic Transducer
HF High Frequency LF Low Frequency
1 CHAPTER 1
INTRODUCTION
1.1 Background
Structural health monitoring (SHM) is one of the common approach which being
explored as techniques in assessing the integrity of mechanical, civil, and aerospace
structures. SHM is the process of damage detection and characterization of the damage for
further maintenance strategies. Yu, L. and V. Giurgiutiu (2009) claim that, various SHM
methods can be used for crack detection by utilizing piezoelectric sensors. SHM can detect
or quantify damage by comparing current structural state measurements to measurements
collected from an undamaged structure (Raghavan et al., 2007).
SHM techniques can reduce cost and increase availability by eliminating
unnecessary structural inspections. Previous study by Hamey et al (2004) found that SHM
also provide a better understanding of the current operational state of the structure thus
reducing the probability of catastrophic failures. SHM and Non-Destructive Evaluation
(NDE) utilize similar methods and techniques but with several notable differences. For
instance, SHM systems typically utilize sensors which are permanently bonded to the
structure of interest but unlike NDE. In general, the process of SHM is started by exciting
the structure using actuators or operational loading. Then, the response to the excitation
2
collected and processed, and based on the processed data, the state of the structure is
diagnosed.
Non-Destructive Testing/Evaluation (NDT/NDE) is a method that evaluates the
structure properties without causing damage. There are several of damage detection
methods or damage monitoring systems which can be used to measure structural damage
such as dye penetrant, Acoustic Emission (AE), Ultrasonic Testing (UT), Radiography
Technique (RT), Vibro-acoustic and also Infrared Thermography (IT). However, all these
techniques have limitations and are not possible in some situations.
Wevers (1997) described AE as a method to measure the mechanical stress waves
that result when strain energy is released due to micro-structural changes in a material. The
ultrasonic stress waves will propagate through the structural component and sensed by
piezoelectric sensors. Measured data from AE method is often difficult to interpret due to
the presence of ultrasonic energy with similar frequencies to those emitted by the release of
strain energy. The AE method has found common use as an inspection method for
pipelines, pressure vessels, and similar applications, where pressure sensitive structural
components can be monitored without the presence of significant environmental noise
(Aljets et al., 2012).
If the cracks are on the surface of non-porous materials, a dye penetrant can be
done to reveal it. Dye penetrant testing can detect small cracks but only capable of
detecting damages on the surface. Dye penetration works by applying colour or fluorescent
dye into the surface flaws. After that a post-penetrant material was applied and the flaws
3
Infrared thermography is an application through the concept of energy emission.
Every object that will be determined emits an amount of energy that will be detected by an
infrared camera. Later, the energy emitted will be converted to temperature in form of a
temperature distribution or so called “Thermogram”. A red colour of distribution means
temperature for that particular point is at low temperature while the red colour determines
high temperature for that particular point.
Another method is by using the Lamb wave. Lamb wave is a special kind of guided
wave which can be travel over a long distance. The sensitivity of lamb wave to defects is
greater than common ultrasonic method. Lamb wave inspection is fast and its cost is so
lower than common ultrasonic techniques or other inspection methods. There are two
techniques in lamb wave testing which are pulse-echo and emission with different lamb
modes as transmitter and receiver.
1.2 Problem Statement
The most common structural defect is the existence of fatigue crack. Fatigue cracks
can present in the structures due to various reasons. The presence of cracks will cause a
local variation in the stiffness and can affect the mechanical behaviour of the entire
structure to a considerable extent. Thus, a non-linear vibro-acoustic approaches are
especially well suited for detecting the presence of fatigue crack as they are very sensitive
even to a small damage severities and this approach do not require dense sensor networks.
However, there are no thorough studies on investigating the effects of high frequencies
4
effect of using variation of high frequency wave in vibro-acoustic method to detect the
fatigue crack.
1.3 Objectives
The objectives of this project are as follows:
1. To conduct experiment in detecting fatigue crack, by using the effect of high
frequency wave in vibro-acoustic method.
2. To provide analysis on the relation of increasing high frequency value and the
effect on the sideband intensity.
1.4 Scope of Project
The scopes need to be cover in this project include:
a. The preparation of the test specimen notch (3 mm) by using Electronic Discharge
Machine (EDM).
b. The preparation of the test specimen dynamic fatigue crack by using Universal
Testing Machine (UTM).
c. Perform the experimental setup for Modal Analysis to obtain test specimen
(aluminium plate) mode shapes and resonant frequencies.
d. Perform the non-linear vibro-acoustic test on the specimen to investigate the effect
of using variation of high frequency wave in vibro-acoustic method to detect the
fatigue crack.
5 CHAPTER 2
LITERATURE REVIEW
2.1 Damage in Structures
Many different methods have been developed for detecting damages in the
structures. Damage was defined by Jean Lemaître (2005) as the creation and growth of
microvoids or microcracks which will create discontinuities in a homogeneous material.
Besides that, damage was also known as structural changes on the material geometric
properties of a structural or mechanical system (Sohn et al., 2003). Damage can occur in
many ways, such as when the stress applied exceeding the yield stress which resulting
changes in the material property (Fatigue Properties, n.d.). One of the primary damages
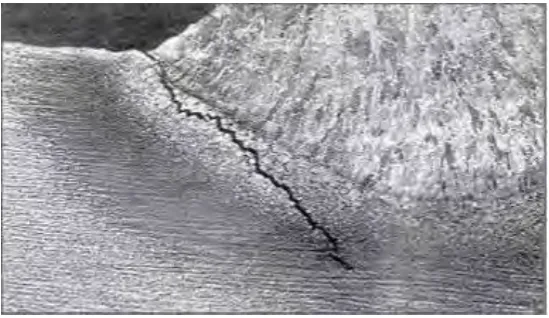
types occur in a structure material is fatigue cracking as illustrated in Figure 2.1. Fatigue
crack occur when the structure burdened with cyclic loading that are lower than the
ultimate tensile stress, or even the yield stress of the material. The most common form of
fatigue crack is probably the fatigue crack that opens and closes under dynamic loading.
Fatigue crack life is divided into parts, initiation and propagation. In initiation phase, large
number dislocations will pile up and form structures called persistent slip bands (PSB).
Budynas et al. (2014) claimed that PSB happened due to movement of material along slip
planes. In this period there will be some microcrack growth, but the fatigue cracks are still
too small to be visible. In the second period, the crack will be growing until complete
6
Figure 2.1: Fatigue crack in structure.
The formation of crack can be divided into three distinct modes as shown in Figure
2.2 (Johnson P., 1999). Mode I, the opening crack propagation mode due to the tensile
stress. Mode II, sliding mode due to the in-plane shear and Mode III, the tearing mode
which arises from out-of-plane shear (Johnson P., 1999).
[image:21.595.145.473.468.623.2]7
2.2 Methods to Detect Fatigue Crack
In the past years, many researchers have shown interest in using non-linear
vibration and acoustic phenomena in many research areas including damage detection
(Donskoy and Sutin, 1999). Parsons et al. (2006) and Klepka et al. (2011) suggested many
different methods have been developed for damage detection in composite structures. Part
of the methods are dye penetration, acoustic emission, visual inspection, ultrasonic signals,
vibro-acoustic, radiographic methods and also thermography methods. Non-linear acoustic
can detect micro damage and early signs of damage. As state in its name, the non-linear is
completely the opposite of linear analysis, non-linear technique analyse wave signal output
which is unrelated to the signal inputs (Sutin, A.M. and V.E. Nazarov, 1995).
The most common findings from the non-linear effects, which correlated with
defects from the non-linear effects, are the side bands generation, amplitude dissipation,
harmonics generation and also resonant waves shifting. Some past application of the
non-linear acoustics such as, in monitoring the development of fatigue crack by using the
second harmonic generation, (Morris et al. 1979); evaluation of concrete material
properties by using non-linear ultrasonic parameters, (Korotkov et al. 1994); evaluation of
material disruption due to the asymmetry of a lattice structure and dislocation in crystals by
8
2.3 Vibro-acoustic Method
Non-linear vibro-acoustic method is very fast and sensitive in the detecting the
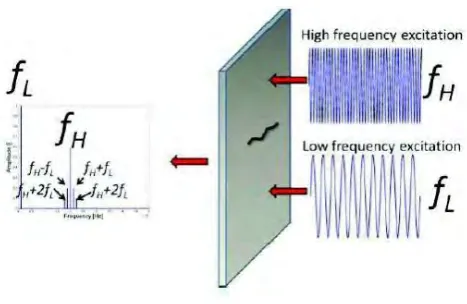
cracks. Vibro-acoustic method is a technique which combined the interaction of high
frequency wave and low frequency vibration excitation. The two excitations will be
induced to the specimen simultaneously as illustrated in Figure 2.3 (L. Pieczonka et al.).
The high frequency wave propagated in the specimen is modulated by the low frequency
vibration. If there is a presence of crack in the plate, modulation is generated by the
non-linear interaction of waves. Frequency sidebands can be observed around the high
frequency excitation. In addition to that vibro-acoustic method able to detect structure
damaged by measuring the vibration response signal. If the investigated structure is
damaged, the spectrum of the response signal will show additional components which are a
higher harmonic (K. Dziedziech, 2016). Besides that, previous research done also found
that the modulation sidebands obtained from the nonlinear vibro-acoustic can locate the
damage (L. Pieczonka et al., 2012) and can obtain the amplitude modulation intensity
(R-value) (Klepka, A. et al., 2016). Klepka et al. (2016) claimed that R-value was obtained
from the amplitudes of major sidebands obtained from the test and the high frequency
[image:23.595.188.422.584.736.2]component.
9
Previous researched by Zeng. Chunhua and Zheng. Shijian (1992) state that there
are two methods in analysing the structure fatigue under vibration loading. The two
methods are time domain method based on the data statistics and the frequency domain
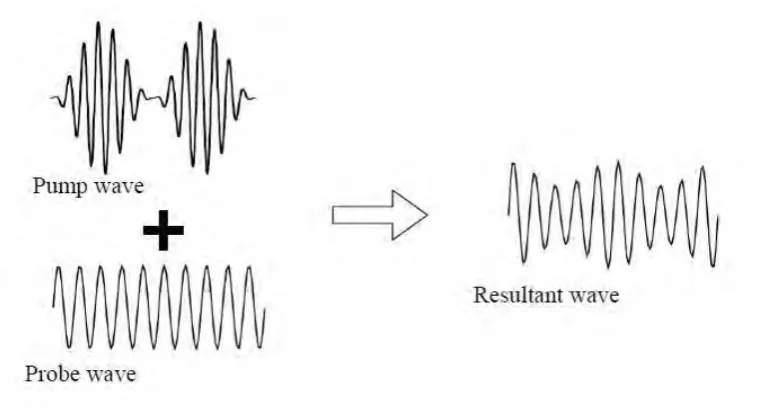
method based on the power spectrum density. Yoder (2010) said that VAM is the applying
of a lower frequency “pumping” excitation signal and a higher frequency “probing”
excitation signal into the structure as shown in Figure 2.4 Yoder (2010). If the structures
undamaged it will return a response with energy only at the pumping and probing
frequencies. However, in the structure is damaged, additional nonlinear components are
created due to nonlinear effects leading to mixing of the two input signals. Yoder also
demonstrated that when the ultrasonic signal coincides with the resonant frequencies of the
[image:24.595.117.497.393.600.2]structure, amplitude of the power spectra is magnified (Yoder and Adam, 2010).
Figure 2.4:Schematic figure of cross modulation between pump wave and probe wave.
There are some previous experimental works for the non-linear vibro-acoustic
method. The non-linear experimental works setup used by Donskoy et al. (2001) shown in
Figure 2.5. In the experiment setup, low frequency signals introduced by using an impact