Populations in Old Stellar Systems
by
George Paltoglou
A thesis submitted for the degree of Doctor of Philosophy
of the Australian National University
January 1989
Mount Stromlo and Siding Springs Observatories Institute of Advanced Studies
The work presented in this thesis consists of three chapters, each of which is coauthored, and each has either been published in, or will shortly be submitted to, the Astrophysical Journal. Except where made explicit in the text, and with the provisos outlined below, the work is solely that of the candidate's—
• Chapter 2. This chapter consists of a paper coauthored with Dr. J. E. Norris and published in the Ap. J., 336, p i 85, (1989). The spectroscopic observations were carried out jointly. The (V-l}i) photometry was obtained by myself, while the 2.3- m telescope DDO photometry was obtained by Dr. Norris. The CN band spectrum synthesis analysis was performed by Dr. Norris, while the CH band analysis was a joint effort. Dr. Norris also made major contributions to the discussion.
• Chapter 3. This chapter will be shortly submitted as a joint paper between myself and Prof. K. C. Freeman to the Ap. J. The Anglo-Australian Telescope observations were carried out jointly. Reduction and analysis of the data were done by myself. Prof. Freeman provided guidance during the write up of the text, and contributed many valuable ideas to the paper.
• Chapter 4. This chapter will be shortly submitted as a joint paper between myself and Prof. K. C. Freeman to the Ap. J. The spectroscopic observations were earned out jointly. Reduction and analysis of the data were done by myself. Prof. Freeman made many valuable contributions to the content of the paper.
Acknowledgements
My thanks to the current and former directors of Mt. Stromlo, Alex Rodgers and Don Mathewson, for their encouragement during my first year at the observatory.
The academic staff members have all been willing to give of their time. In particular, I w ould like to thank Drs. Mike Bessell, Don Falkner, Agris Kalnajs, Barry Newell, Jepser Sommer-Larsen, and Peter Wood, who have been more than generous.
Thanks also the adm inistration, com puter, and workshop staff for keeping the observatory running (most of the time).
Man cannot live by astronomy alone, however, and I cannot express my feeling strongly enough in regard to the friendships I have had here in Canberra. My appreciation extends out to those, both here at the observatory and elsew here in Canberra, who have supported me during difficult periods, and who have made my time here not just a happy one, but a period of self discovery.
They looked for harmony above them, turned to the whirling planets to explain greed, hate, jealousy and war,
and craned their stiffening necks, under a howling, dogged moon, to see something they searched for
in the brilliant, shifting, unrepentant stars.
Stephanie Green Stars
Now that you have broken through the wall with your head, what will you do in the neighbouring cell?
ABSTRACT
Spectroscopic and photometric observations are presented of stars in three Population II systems: the Galactic globular clusters co Centauri and 47 Tucanae, and the Fornax dwarf spheroidal galaxy.
1) co Centauri: In this cluster , analysis of (V-l|i) colours and high resolution spec tra of 15 red giant stars lead to the following conclusions.
i) There is a range in iron abundance of order 0.6 dex.
ii) CN and ON process products are being mixed to the surface in some red giants. iii) [Na/Fe] appear to be positively correlated with [N/Fe], suggesting a link between sodium enhancement and mixing phenomena. There are some stars, however, which have enhanced an nitrogen abundance and a normal sodium abundance.
iv) Silicon and calcium are both overabundant with respect to oxygen and iron, the abundance of calcium appears positively correlated with that of iron.
v) Zirconium, barium, and lanthanum are in general overabundant. [Ba/Fe] is positively correlated with [Fe/H], suggesting a primordial origin for the enhancement. No dependence between the s-process element abundances and that of the CNO group is evident.
Points i), iv), and v) are consistent with primordial enrichment by carbon deflagration
Supernovae.
The distribution of the stellar cyanogen band strengths for stars with r < 6’ from the cluster centre, and that for stars beyond r = 6' are different at the 0.15% significance level. The kinematics of the CN strong and CN weak groups of stars are not different within the errors, however. The CN radial gradient is consistent with the gradual outward diffusion of an initially more concentrated distribution of CN strong stars.
The velocity dispersion data are reasonable well fitted by single-mass King and single- and multi-mass King-Michie models. These models do not predict the low central dispersion value found by Illingworth (1976)
There is no compelling evident for a change in the ratio of the number of CN strong to CN weak stars from My = 1.6 on the giant branch to the horizontal branch. The CN- CH anticorrelation is evident down to the faint limit of our sample, V = 15.0.(My =
1.6) .
3) Fornax Dwarf Spheroidal Galaxy: The velocity dispersion and rotation of the Fornax dwarf spheroidal galaxy have been derived from the spectra of 80 bright K- giants. The velocity dispersions at the centre and at one core radius are 9.4 ± km S' 1 and 2.9 ± +%$ km S’ 1 respectively. From isopleth contour fitting we find an integrated apparent magnitiude of V = 7.46. The indicated mass to light ratio for a King model is 2.9. For core fitting, the M/L is 3.7. The conclusion to be drawn is that there is little dark matter in Fornax within one core radius. The rotational velocity at one core radius is 3.5 ± 2.0 km S'1. This value is inconsistent with the notion that Fornax was once a dwarf irregular.
Illingworth, G. 1976, Ap. J., 204, 73.
CONTENTS
CHAPTER 1: Intoduction... 1
I. Introduction...2
II. Chemical Anomalies in Population II Ssystem s...3
a) G lobular C lu sters...3
b) Dwarf Spheroidal G alaxies... 5
III. Internal Kinematics o f Population II System s... 6
a) G lobular C lu sters...6
b) Dwarf Spheroidal G alaxies...7
IV. The Value in Studying Population II System s...7
V. The Aims and Outline of This Investigation... 8
a) coCentauri... 9
b) 47 Tucanae...9
c) The Fornax Dwarf Spheroidal G alaxy... 10
VI. References... 12
CHAPTER 2: The Giant Branch of Omega Centauri HL CNO and Heavy E lem en t A b u n d a n ce s fo r 15 R ed G ia n ts ... 15
I. A bstract... 16
II. Introduction...17
III. O bservations... 20
a) Program O b je c ts...20
b) Photom etry... 22
c) S p e c tra ... 25
IV. A n a ly sis... 29
a) A tm ospheric P a ra m e ters... 29
b) WIDTH6 Analysis... 32
c) Carbon and Oxygen A bundances... 35
d) N itro g e n ...38
V. E rro rs ...43
VI. A bundance T ren d s... 45
a) The CNO G ro u p ...51
b) The Sodium - Nitrogen C onnection... 57
c) Sodium - Calcium... 57
i) S o d iu m ... 57
ii) Silicon... 60
iii) C a lc iu m ... 60
c) Iron-Peak Elements: Titanium through N ickel...63
i) Titanium ...63
ii) Vanadium ... 63
iii) Chromium and C obalt... 64
iv) N ic k e l... 64
e) s-Process E lem ents... 65
i) Z irc o n iu m ...65
ii) B arium ... 65
iii) Lanthanum ...68
VII. Discussion... 68
a) Abundance Trends... 68
i) The Range in Iron A bundance...71
ii) Carbon, Nitrogen and O xygen... 72
iii) The behavior of the CNO Group with Sodium... 73
iv) Silicon and C alciu m ... 75
v) s-process elem ents... 76
b) Comments on Enrichm ent... 77
i) The Nature of the Primordial Enriching Stars... 78
c) The Peculiar Star ROA 3 7 1 ...80
VIII. References...85
CHAPTER 3: The Cyanogen Distribution and Kinematics of Gaint Branch and H o riz o n ta l B ra n c h S ta rs a n d 47 T u c a n a e ... 89
I. A bstract... 90
II. Introduction...91
EH. Observational M aterial...93
a) CN Observations in the Region 2.5’ < r < 6 ' ... 94
b) Photographic Photometry in the Outer Parts of 47 T ue...95
c) CN and Radial Velocity Data in the Outer Parts of 47 T u e ...98
IV. A n aly sis... 102
a) Cluster membership for stars with r > 1 7 '... 102
i) Velocity Criterion... 102
ii) D w arf G iant D iscrim ination... 107
iii) Halo Star Discrim ination... 107
iv) The W(G) and dC(4142) Indices... 110
v) T hick D isk G ia n ts...113
b) Spectral Indices... 113
i) Bimodality in C N ... 113
ii) C(4142) vs W(G) anticorrelation... 130
c) D y n a m ic s ... 133
i) L u m in o sity P ro file ...134
ii) R otation... 134
iii) Dispersion as a Function of Radius... 136
d) Velocity and CN d a ta ... 141
V. D is c u s s io n ...145
VI. Conclusions...150
V II R e f e r e n c e s ...152
CHAPTER 4: The Kinematics of the Fornax Dwarf Spheroidal G alax y ... 155
I. A bstract...156
II. Introduction...156
IE. Observations and A nalysis... 159
i) The D a ta ... 159
ii) Data Reduction...164
iii) The Velocity Dispersion of F o rn ax ...166
iv) The R otation o f F o rn ax ... 167
IV . D is c u s s io n ...167
i) The Velocity Dispersion of Fornax... 167
ii) The R otation o f F o rn ax ...175
V. R e f e r e n c e s ... 179
CHAPTER 5: Conclusion... 182
I. C onclusion... 183
II. A Final W o rd ... 190
A P P E N D I X ... 192
LIST OF FIGURES
Chapter 2: The Giant Branch of Omega Centauri
1. Instrumental (V-lja) colours vs Teff for stars in common with PFCAM 23
2. Equivalent widths for Arcturus... 27
3. Equivalent widths for ROA 58... 28
4. Equivalent widths for ROA 58... 30
5. Log(W>/X) for Ol 3.6300.3Ä vs [O/Fe] for ROA 150... 36
6. Loci of CNO abundances... 37
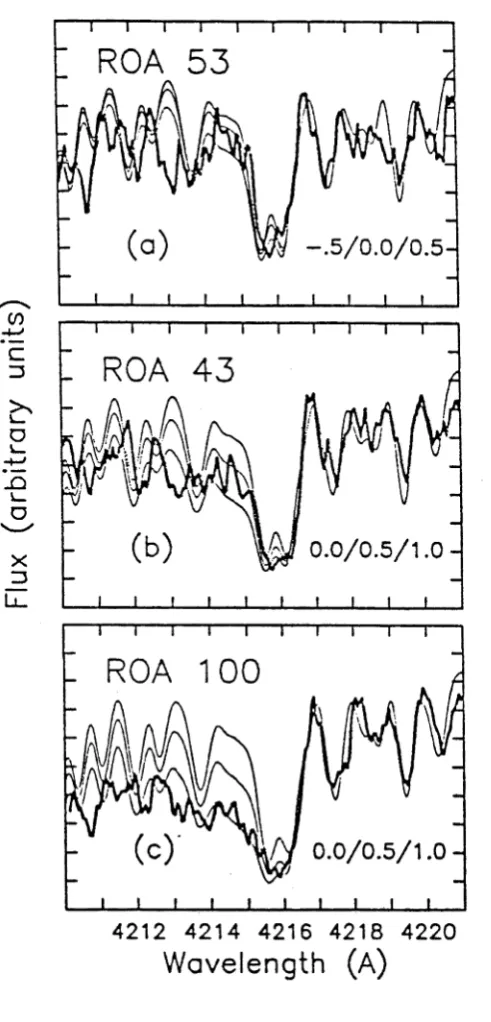
7. Synthetic and observed spectrum for y Tau around 7.4216Ä... 41
8. Synthetic and observed spectra for ROA 53, 43, and 100...42
9. R(V-K) vs [Fe/H]... 49
10. Teff vs [Fel/Fell]...50
11. Plots of [O/Fe] and ([0/Fe]+[C/Fe]) vs [N/Fe]...52
12. ([C/Fe]+[0/Fe]) vs 5C(4142)... 53
13. Comparison of ROA 139 and 182 around Ol 7.6300.3Ä...55
14. Observed and synthetic spectra for ROA 182 around 7.4300Ä... 56
15. The behaviour of sodium with respect to the CNO group... 58
16. [Na/Fe] vs [Fe/H]... 59
17. [Si/Fe] vs [Fe/H]...61
18. [Ca/Fe] vs [Fe/H]... 62
19. [Ba/Fe] vs [Fe/H]... 66
20. [Ba/Fe] vs ([C/Fe]+[0/Fe]) and [Ba/Fe] vs [N/Fe]... 69
21. [La/Fe] vs [Fe/H]...70
22. R(V-K) vs ([Si/H]+[Fe/H])... 83
Chapter 3: The CN Distribution and Kinematics of 47 Tucanae 1. Photographic photometry for 47 Tue stars...97
2. Comparison of raw velocities with heliocentric values...101
3. Velocity histograms... 103
4. Velocity vs position angle...105
5. Histograms of velocities in the rotating cluster fram e... 106
6. The dependence of SrFe on (B-V)... 108
7. The dependence of A(Ca) on (B-V)...109
8. A(Ca) vs (B-V) for velocity members and non-members... I l l 9. The dependence of W(G) on (B-V) and C(4142) for GB stars... 112
10. The dependence of W(G) on (B-V) and C(4142) for HB stars... 114
11. The dependence of C(4142) on (B-V) for giant branch stars...115
12. The dependence of C(4142) on (B-V) for horizontal branch stars.... 117
14. Generalized histogram for SC(4142) for 2.5' < r < 6'...121
15. A plot of 8C(4142) vs radius... 122
16. Generalized histograms for SC(4142) for all d ata... 124
17. Generalized histograms for 5C(4142) for r<6' and r>6’... 125
18. Generalized histogram for AGB stars...128
19. The dependence of the CN ratio and integrated C(4142) on radius.... 131
20. Dependence of W(G) on (B-V) for CN strong and CN weak stars ... 132
21. Comparison of observed and theoretical luminosity profiles... 135
22. Comparison of observed and theoretical velocity dispersion profiles. 140 23. Velocity dispersion vs radius for the CN strong and CN weak stars.. 144
Chapter 4: The Kinematics of the Fornax Dwarf Spheroidal Galaxy 1. Star count isopleths for Fornax... 169
2. Log(number density) vs log(equivalent radius)... 170
3. Ln(number density) vs Radius...172
LIST OF TABLES
Chapter 2: The Giant Branch of Omega Centauri
1. Data for co Centauri Stars... 21
2. Parameters for co Centauri Stars...24
3. Equivalent widths for co Centauri Stars... 31
4a. [A/H] for co Centauri Stars... 34
4b. [A/Fe] for the CNO Group for co Centauri Stars... 39
5a. Abundances for ROA 5 8 ...44
5b. Abundances for A57 in NGC 6752... 46
5c. Abundances for Arcturus... 47
6. Abundances for ROA 371 and 253... 82
Chapter 3: The CN Distribution and Kinematics of 47 Tucanae 1. Data for 47 Tucanae Stars with 2.5' < r < 6 '... 96
2. Data for 47 Tucanae Stars with r > 17'...99
3. Numbers of CN Weak and CN Strong Stars...119
4. CN Ratio...123
5. CN Data for AGB Stars...129
6. Rotational Velocity Parameters... 137
7. Velocity vs. Radius... 139
8. Rotational Parameters vs CN Strength... 142
9. Velocity Dispersion vs. CN Strength... 143
Chapter 4: The Kinematics of the Fornax Dwarf Spheroidal Galaxy 1. Data for Central Stars... 160
2. Data for Stars at One Core Radius... 162
3. Luminosity Profile D ata... 168
Appendix 1. Photographic Photometry of 47 Tucanae...195
CHAPTER 1:
Introduction
L INTRODUCTION
The special properties of globular clusters and dwarf spheroidal galaxies (dSphs) make them profitable objects of study for astronomers. Each globular cluster and dSph is a miniature astrophysical laboratory in which we can learn about the formation of stars and stellar systems and their self-enrichment, and study the effects of age, abundance and kinematics on the evolution of a star. These systems are self gravitating aggregates of between 105 and 108 stars. The stars within globular clusters would appear to have formed out of a single cloud of gas, on the basis of their internal abundance homogeneity, and are essentially coeval. This is evinced by the tightness of the cluster sequences in the color-magnitude plane. Upon closer examination, however, there are star to star differences. It is now apparent that a globular cluster does not consist of stars that are essentially chemically identical. Rather, abundance variations can be discerned that indicate that these systems are composed of different populations. In dSphs evidence for large internal age spreads, and therefore multiple populations, has been discovered. Population in the above contexts refer to groups of stars that are linked by common age, abundance and kinematic properties. For example, in some clusters (e.g. 47 Tucanae) the stellar cyanogen band strength distribution is bimodal, suggestive of two populations. In co Centauri, there is a range in the CN band strength, but the kinematics of the CN strong and weak groups are possibly different. In the majority of dSphs, there have been at least two and possibly multiple periods of star formation.
In this thesis research is presented on three Population II systems: the globular clusters co Centauri and 47 Tucanae, and the Fornax dwarf spheroidal galaxy. The work carried out was a chemical and kinematic study of a number of individual stars within each of these. In the following sections the basic abundance and kinematic properties of globular clusters and dwarf spheroidal galaxies will be outlined, with particular reference to the above systems. Some of the important questions that are addressed in
this thesis will also be discussed as well as the reasons for chosing to observe co Centauri, 47 Tucanae and Fornax to do so.
H CHEMICAL ANOMALIES IN POPULATION H SYSTEMS
a) Globular Clusters
Early research into the abundance properties of globular clusters took the form of integrated light spectra (Fath 1911, 1913; Mayall 1946; Morgan 1956). These early studies indicated that clusters differed from one another in their spectral properties. Intra cluster abundance variations were not apparent. With the advent of photoelectric photometers accurate individual stellar magnitudes and colours could be derived, and the morphology of the cluster sequences investigated for chemical variations (e.g. co Centauri, Woolley et al. 1967). For instance, the (B-V) colour for stars on the giant branch can be used to estimate the stellar iron abundance. The DDO C(4142) colour is used to measure the strength of the cyanogen bands, and infer the relative abundance of CN. In general, abundance variations are confirmed only for the lighter elements carbon, nitrogen, and sodium. For iron, which is generally used as an indication of overall metal abundance, variations are rare. Only in co Centauri and M22 have star to stars difference in this element been confirmed. Extensive reviews of the globular cluster system of the Galaxy and their abundance variations can be found in Harris and Racine (1979), Kraft (1979), Freeman and Norris (1981), and Smith (1987).
Clusters may be divided by abundance characteristics into three categories (see Smith 1986). First there are those with variations in the elements with Z > 14. There are two clusters in this category, co Centauri and M22. The former cluster shows a range of 0.8 dex in Fe, and a spread in the abundances of calcium, and the s-process elements Zr and Ba (e.g.Freeman and Rodgers 1975, Manduca and Bell 1978, Cohen 1981, Gratton 1982). The abundance variations in the latter system are not as great as for co Cen, but appear to be of the same kind (Hesser, Hartwick and McClure 1977;
Pilachowski et al. 1982; Norris and Freeman 1983). Of the clusters which exhibit no heavy element variation, two types may be discerned. One category shows a bimodal distribution in the strength of the CN bands such as 47 Tue (Norris and Freeman 1979), NGC 6752 (Norris et al. 1981), M4 (Norris 1981), M5 (Smith and Norris 1983), M3 (Suntzeff 1981; Norris and Smith 1984), NGC 362 (Smith 1983, 1984), M71 (Smith and Norris 1982), NGC 3201 (Smith and Norris 1982), NGC 6934 (Smith and Bell 1986). Those in the second have single-mode CN distributions (e.g. M55, Smith and Norris 1982). It turns out that these CN categories are approximately equivalent to a classification on metallicity. Clusters with [Fe/H] £ -1.6 all appear to have bimodal CN distributions, indicative of two populations, while systems with [Fe/H] ^ -1.8 have mono-modal distributions. Spectroscopy indicates that the bimodal clusters show a C-N abundance anticorrelation: the stars with strong CN bands have enhanced N and depleted C with respect to the weak CN stars (e.g. 47 Tue, Norris and Freeman 1982; Norris, Freeman, and Da Costa 1984), but with little indication of abundance changes with evolution up the giant branch. The single-mode clusters exhibit no obvious C-N anticorrelation, but there does appear to be a stellar luminosity- abundance correlation in which the carbon abundance decreases with evolution up the giant branch (e.g. M92, Carbon et al. 1982), consistent with the cycling of CN process products to the stellar surface as a star evolves. Carbon et al. (1982) found that the (C+N) abundance was not constant from star to star, suggesting possible primoridal variations in these elements. More recently, Pilachowski (1988) has shown that the (C+N+O) abundances for six giants in this cluster are the same within the errors. These phenomena have a natural explanation in the occurrence of both CN and ON processed material dredge up.
While the C and N variations may be explained by evolutionary processes combined with primordial events, there are further interesting observations that muddy the waters. Sodium variations have been found to accompany nitrogen variations in all clusters studied for this effect (Peterson 1980; Cottrell and Da Costa 1981; Norris et al.
1981; Norris and Pilachowski 1985). There also appears to be a AI - N correlation in
the bimodal clusters (Norris and Smith 1983). While it is possible that these variations in Na and A1 are artifacts of atmospheric phenomena, it now seems more likely that they are due to real abundance anomalies. These elements cannot be synthesised in low mass cluster giants, and a primordial mechanism appears necessary to explain the variations. For example, stars enhanced in Na and N may be slightly younger than the Na, N normal stars, and have been enriched by an earlier generation of 5 - 10 MQ stars. These objects produce N as the result of CN cycle processing, and Na and A1 during their thermal pulsing asymptotic giant branch (AGB) phase (Iben 1975, 1976). It is not clear, however, how evolutionary and primordial events can be combined to produced the observed abundance variations. In addition, the special peculiarities of co Centauri (and M22) suggest an admixture of primordial and evolutionary phenomena. In this cluster one finds a continuous range in the stellar CN bands strengths rather than a bimodality, and a range in the Call line strength. Norris (1980) shows that there is a broad correlation between these bands, but that for a given calcium line strength there is a range in the CN band strength.
It is possible that there is a radial gradient in the CN distribution in some clusters. In co Centauri the CN strong stars appear to inhabit only the inner half of the cluster, while the CN weak stars exist out to the tidal radius (Norris, Freeman, and Seitzer as quoted by Freeman and Norris 1981). From an analysis of CN band strength measurements of over 160 stars in 47 Tue, Norris and Freeman (1979) have found evidence that the ratio of the number of CN strong to CN weak stars in the inner few arc minutes of this cluster is greater than for the outer region.
b) Dwarf Spheroidal Galaxies
Some dwarf spheroidal galaxies also exhibit peculiarities that are the result of abundance variations (Norris and Bessell 1978; Zinn 1978; Smith and Dopita 1983; Buonanno et al. 1985; see also the review by Da Costa 1988). The width of the giant branch and stellar spectrum synthesis analysis suggest several tenths of a dex spread in abundance in all but the smallest dwarfs. The Sculptor system exhibits a range in CN
band strength (Smith and Dopita 1983) and infrared Ca II line strength (Armandroff, Da Costa, and Zinn as reported in Da Costa 1988) at a given luminosity and colour.
While the stars within any particular galactic globular cluster are approximately coeval, the majority of dwarf spheroidals appear to have undergone two, and possibly multiple, epoches of star formation. Evidence for this has been the discovery of upper AGB stars (Aaronson and Mould 1980, 1985), anomalous cepheids (e.g. Baade and Swope 1961; Light, Armandroff and Zinn 1986), and blue stragglers that have been interpreted as younger main sequence turnoff stars (Buonnano et al. 1985). Thus, these systems have had a complex history of formation and possibly chemical self enrichment.
IIL INTERNAL KINEMATICS OF POPULATION U SYSTEMS
a) Globular Clusters
Research into the internal kinematics of these systems is generally based upon a study of the surface luminosity, velocity dispersion, and star count distributions for various mass groups. Observations are mostly compared with the predictions of isotropic King models (King 1966). The radial distribution of surface brightness and velocity dispersion are usually reasonably well fitted by such models. However, some globular clusters show significant discrepancies. Attempts to improve the models include the use of multi-mass component distribution functions and various assumptions about the thermal equilibrium of the system (e.g.Da Costa and Freeman 1976, Da Costa 1977), the use of an anisotropic distribution function (e.g. the King-Michie model; see Michie 1963, Kent and Gunn 1982), and the inclusion of rotation. These have not been altogether successful in removing the discrepancies been observation and theory such as the run of surface luminosity and velocity dispersion with radius (e.g. 47 Tue: Da Costa 1979; Da Costa and Freeman 1985; Meylan 1988).
The kinematical information may also shed light on the abundance anomalies. For instance, in co Centauri, Freeman (1985) suggests that the velocity dispersion falls off more rapidly with radius for the CN strong stars, as might be expected from the fact that these stars preferentially inhabit the inner region of the cluster. There is currently little theory to link kinematic and abundance anomalies. One possibility concerns angular momentum. Sweigart and Mengel (1979) show that meridional circulation currents, induced by rotation, may bring CN and ON cycle products to the stellar surface. Moreover, there is observational evidence to suggest that angular momentum may in some way be associated with the CN bimodality (Norris 1981; Suntzeff 1981). Norris (1987) has drawn attention to a correlation between cluster ellipticity and the ratio of CN strong to CN weak stars. Clusters with large observed ellipticities have large CN ratios; large ellipticities suggest significant rotation of the cluster which may be associated with a high internal stellar angular momentum which drives the mixing of CN processed material to the surface.
b) D w arf Spheroidal Galaxies
Little is known about the kinematics of these systems. Due to their distance, even the brightest stars are only of 18th magnitude (Hodge 1971). The current situation is that velocity dispersions have been obtained for five galaxies, with an apparent trend of increasing M/L with decreasing luminosity (see Aaronson 1986; Kormendy 1987 and references therein). The dispersions have been derived from a relatively small number of objects (between 3 and 16), so that the statistical errors are large. The most luminous systems have M/L ratios similar to galactic globular clusters, while the smallest have ratios of order 50, suggesting that dark matter dominates in these systems (Freeman 1987; Kormendy 1987). Little in known, however, about the run of dispersion with radius, and whether there are significant amounts of dark matter in the more luminous dwarf spheroidal galaxies at large distances. Nothing is known about their rotation. Detailed knowledge of possible dark halos around these systems, and of their rotation properties, would provide important clues to their formation and subsequent evolution.
IV. THE VALUE IN STUDYING POPULATION H SYSTEMS
The abundance variations within a cluster and its kinematic properties provide an excellent opportunity to test our understanding of stellar nucleosynthesis and evolution, as well as models of cluster self enrichment and dynamical evolution. As the stars of a globular cluster are probably coeval, the features evident in the color magnitude diagram should be due solely to differences in stellar mass and abundance. Spectrum analysis can provide information on the current surface abundance of stars, and the predictions of stellar evolution and nucleosynthesis models can be compared with the observed cluster features such as the shape and position of the main sequence turn off, the colour, slope, and tip luminosity of the giant branch, the luminosity of the horizontal branch, position of the RR Lyrae gap, and the relative numbers of stars at each evolutionary stage.
Studies of the kinematics of stars within individual clusters have led to the greater understanding of the dynamical evolution of stellar systems. Globular clusters and dwarf spheroidals are especially useful for this as they are relatively simple compared with multiple component systems such as spiral galaxies. At the same time, one can examine what relationship exists (if any) between the kinematical and abundance properties within a given system.
V. THE AIMS AND OUTLINE OF THIS INVESTIGATION
Population II systems display a variety of phenomena that are not yet fully understood, as discussed above. The work presented in this thesis is an attempt to address some of these problems by observing three systems: the galactic globular clusters co Centauri and 47 Tucanae, and the Fornax dwarf spheroidal galaxy. Each of these systems is, in at least one sense, of particular interest, co Centauri has a range in stellar abundance that is unmatched by any other globular cluster in the Galaxy. 47 Tucanae is the classic
bimodal CN cluster. The Fornax dwarf spheroidal galaxy is the largest and most luminous of its class in the local group (Hodge and Michie 1969), is the only one to have its own globular clusters, has a significant population of younger (3 Gyrs) stars (Aaronson and Mould 1980), and has a wide giant branch indicating a range in abundance probably greater than 1 dex (Buonanno et al. 1985).
I will now discuss each system in turn and expand on the reasons for studying them.
a) coCentawi
The analyses of high resolution spectra by Cohen (1981) and Gratton (1982) indicate that there is a range in iron abundance of approximately 0.7 dex, and variations in the abundance of oxygen, sodium, calcium, magnesium, and s-process elements. The sites of primordial enrichment remain obscure however. Cohen (1981) suggested that the observed trends may be the result of enrichment by stars of high mass, which should produce large amounts of oxygen. More recently, from an analysis of low resolution spectra, Cohen and Bell (1986) proposed that there was significant degree of mixing to the surface of CN and ON process products. In order to investigate the self enrichment processes, a program was undertaken to determine accurate O abundances for a large number of stars in this cluster. At the same time, it was deemed important to obtain C and N abundances to shed further light on possible CN and ON mixing events, and on Na, Fe, Ba and other elements which might clarify possible primordial processes.
This investigation is presented in Chapter II.
b) 47 Tucanae
Analyses of C and N abundances in (CN strong)/(CN weak) pairs of stars show that the depletion in C and enhancement in N in the CN strong stars with respect to the CN weak objects is consistent with it being the result of mixing CN processed products to the stellar surface in the CN strong stars (Norris and Cottrell 1979; Norris and Freeman 1982; Norris, Freeman, and Da Costa 1984). The correlation between CN
band strength and the line strength of Na suggests, however, a primordial cause, as does the observation of C and N variations at the main sequence turn off (Bell et al.
1983). The observation of a possible radial gradient in the CN band strength (Norris and Freeman 1979) is important in that such a gradient would be unlikely to result from purely post cluster-formation processes. The existence of the gradient has been questioned however (Hartwick and McClure 1980). The level of statistical significance claimed by Norris and Freeman (1979) is 5%. High resolution spectra of stars in previously unobserved regions, 215 < r < 6' and r > 17', were obtained so that the CN distribution could be mapped across the whole cluster and the existence of this CN gradient investigated. An extensive program of photographic photometry was therefore undertaken to identify cluster members beyond half the tidal radius. Radial velocities were also obtained for the stars in the previously neglected outer region so as to compare the kinematics of the CN strong and weak groups.
This work is presented in Chapter III.
c) The Fornax Dwarf Spheroidal Galaxy
The relationship between dwarf spheroidal galaxies and other types of systems, dwarf irregulars, ellipticals, and globular clusters is not clear. Little is known about its formation and evolution. It has been conjectured that dwarf spheroidal galaxies may have evolved from dwarf irregular systems that were stripped of gas (Lin and Faber 1983; Kormendy 1985). Similarly, the existence of a dark halo around Fornax is unclear. A two-pronged program was undertaken to investigate the formation and evolution of this system. First, it was deemed important to establish the true intrinsic abundance spread, and search for possible radial abundance gradients, by deriving photographic photometry for a large number of stars from a blue and red plate pair that had been taken on the Anglo Australian Telescope. Knowledge of these would help constrain models of formation and chemical self-enrichment. This project is as yet uncompleted. From it, however, the third component of this thesis developed. This was to determine the kinematical parameters of this system: the run of velocity
dispersion with radius, and the systemic rotation, neither of which was well defined. The velocity dispersions can be compared with the predictions of appropriate models, and so provide information on the dark matter content. The dwarf irregular hypothesis can be tested by comparing the observed rotation of the dwarf spheroidal galaxy with that expected of a system that has evolved from a rotating dwarf irregular. Because it is the most massive dwarf spheroidal in the local group it is the most promising candidate for this research. It has enough bright giants to obtain the velocity dispersion profile, and would be expected to show the largest rotational velocity if the dwarf irregular hypothesis is correct
This latter project is presented in Chapter IV.
VL REFERENCES
Aaronson, M. 1986, in Stellar Populations, ed C. A. Norman, A. Renzini, and M. Tosi, (Cambridge: Cambridge University Press), 45.
Aaronson, M , and Mould, J. 1980, Ap. J., 240, 804. Aaronson, M., and Mould, J. 1985, Ap. J., 290, 191. Baade, W., and Swope, H. H. 1961, A. J., 66, 300.
Bell, R. A., Hesser, J. E., and Cannon, R. D. 1983, Ap. J., 269, 580.
Buonnano, R., Corsi, C. E., Fusi Pecci, F., Hardy, E., and Zinn, R. 1985, Astr. Ap., 152, 65.
Carbon, D. F., Langer, G. E., Butler, D., Kraft, R. P., Suntzeff, N. B., Kemper, E., Trefzger, C. F., and Romanishin, W. 1982, Ap. J. Suppl., 49, 207.
Cohen, J. G. 1981, Ap. J., 247, 869.
Cohen, J. G., and Bell, R. A. 1986, Ap. J., 305, 698.
Cottrell, P. L., and DaCosta, G. S. 1981, 1981, Ap. J. (Letters), 245, L79. Da Costa, G. S. 1977, Ph. D. Thesis, The Australian National University. Da Costa, G. S. 1979, A. J., 84, 505.
Da Costa, G. S. 1988, in LAU Symposium 126, Globular Cluster Systems in
Galaxies, ed. J. E. Grindlay and A. G. Davis Philip, (Dordrecht: Kluwer Academic Publishers), p 217.
Da Costa, G. S., and Freeman, K. C. 1976, Ap. J., 206, 128.
Da Costa, G. S., and Freeman, K. C. 1985, in IAU Symposium 113, Dynamics of Star Clusters, ed. J. Goodman and P. Hut (Dordrecht: Reidel), p69.
Fath, A. E. 1911, Ap. J., 33, 58. Fath, A. E. 1913, Ap. J., 37, 198.
Freeman, K. C. 1985, in IAU Symposium 113, Dynamics of Star Clusters, ed. J. Goodman and P. Hut (Dordrecht: Reidel), p33.
Freeman, K. C. 1987, in Nearly Normal Galaxies, ed S. M. Faber, (New York: Springer-Verlag), p317.
Freeman, K. C., and Rodgers, A. W. 1975, Ap. J. (Letters), 201, L71. Gratton, R. G. 1982, Astr. Ap., 115, 336.
Harris, W. E., and Racine, R. 1979, Ann. Rev. Astr. Ap., 17, 241. Hartwick, F. D. A., and McClure, R. D. 1980, Ap. J., 235, 470.
Hesser, J. E., Hartwick, F. D. A., and McClure, R. D. 1977, Ap. J. Suppl, 33, 471. Hodge, P. W. 1971, Ann. Rev. Astr. Ap., 9, 35.
Hodge, P. W., and Michie, R. W. 1969, A. J., 74, 587. Iben, I. Jr. 1975, Ap. J., 196, 525.
Iben, I. Jr. 1976, Ap. J., 208, 165. King, I. R. 1966, A. J., 71, 64.
Kormendy J. 1987, in LAU Symposium 117, Dark Matter in the Universe, ed. J. Kormendy and G. R. Knapp, (Dordrecht: Reidel), p 139.
Kormendy, J. 1985, Ap. J., 295, 73.
Kraft, R. P. 1979, Ann. Rev. Astr. Ap., 17, 309.
Light, R. M., Armandorff, T. E., and Zinn, R. 1986, A. J., 92, 43. Lin, D. N. C., and Faber, S. M. 1983, Ap. J. (Letters), 266, L21. Manduca, A., and Bell, R. A. 1978, Ap. J., 225, 908.
MayaU, N. U. 1946, Ap. J., 104, 290. Meylan, G. 1988, Astr. Ap., 191, 215. Michie, R. W. 1963, M.N.R.A.S., 125, 127. Morgan, W. W. 1956, Pub. A.S.P., 68, 509.
Norris, J. 1980, in Globular Clusters, ed. D. Hanes and B. Madore (Cambridge: Cambridge University Press), p. 113..
Norris, J. 1981, Ap. J., 248, 177.
Norris, J. 1987, Ap. J.(Letters), 313, L65.
Norris, J., and Bessel, M. S. 1978, Ap. J. (Letters), 225, L49. Norris, J., and Cottrell, P. L. 1979, Ap. J. (Letters), 229, L69. Norris, J., and Freeman, K. C. 1979, Ap. J. (Letters), 230, L179. Norris, J., and Freeman, K. C. 1982, Ap. J., 254, 143.
Norris, J., and Pilachowski, C. A., 1985, Ap. J., 299, 295. Norris, J., and Smith, G. H. 1983, Ap. J., 272, 635. Norris, J., and Smith, G. H. 1984, Ap. J., 287, 255.
Norris, J., Cottrell, P. L., Freeman, K. C., and DaCosta, G. S. 1981, Ap. J. 224, 205.
Norris, J., Freeman, K. C., and Da Costa, G. S. 1984, Ap. J., 277, 615. Norris, J., Freeman, K. C., and DaCosta, G. S. 1984, Ap. J., 277, 615. Peterson, R. C., 1980, Ap. J. (Letters), 237, L87.
Pilachowski, C. A. 1988, Ap. J. (Letters), 326, L57.
Pilachowski, C. A., Wallerstein, G., Leep, E. M., and Peterson, R. C. 1982, Ap. J., 263, 187.
Smith, G. H. 1983, A. J., 88, 410. Smith, G. H. 1984, A. J., 89, 1545. Smith, G. H. 1987, Pub. A.S.P., 99, 67.
Smith, G. H., and Bell, R. A. 1986, A. J., 91, 1121. Smith, G. H., and Dopita, M. A. 1983, Ap. J., 271, 113. Smith, G. H., and Norris, J. 1982, Ap. J., 254, 149. Smith, G. H., and Norris, J. 1983, Ap. J., 264, 215. Suntzeff, N. B. 1981, Ap. J. Suppl., 47, 1.
Sweigart, A. V., and Mengel, J. G. 1979, Ap. J., 229, 624.
Woolley, R. v.d. R. et al. 1966, Royal Observatory Annals, No. 2. Zinn, R. 1978, Ap. J., 225, 790.
CHAPTER 2:
The Giant Branch of Omega Centauri. III.
C, N, O and Heavy Element Abundances
for 15 Red Giants
G. paltoglou and John e. norris
Mount Stromlo and Siding Spring Observatories Institute of Advanced Studies
The Australian National University
L ABSTRACT
We have obtained high resolution spectra for fifteen red giant stars in the Galactic globular cluster co Centauri. From these data we have derived abundances for a variety of elements including C, N, O, Na, Fe, and Ba. Our basic conclusions are :
1) There is a range in iron abundance, of order 0.6 dex, as has been reported by other workers.
2) Our data provide conclusive evidence for the mixing of CN- and ON-cycle processed material to the surface of globular cluster red giants.
3) As with all other clusters which show a range in nitrogen abundance, [Na/Fe] appears to be positively correlated with [N/Fe]. We find also that the largest sodium enhancements are associated with carbon and oxygen depletions. This suggests that sodium enhancement is linked to phenomena which drive mixing. An enhanced nitrogen abundance, however, is not a sufficient condition for the occurrence of sodium enrichment. The origin of the sodium enhancements, primordial and/or evolutionary, is not clear.
4) The alpha process elements silicon and calcium are both overabundant with respect to oxygen and iron, and our data corroborates previous work indicating a correlation between [Ca/Fe] and [Fe/H]. In stars that have not undergone mixing, we find that O is less overabundant than Si and Ca.
5) The s-process elements zirconium, barium, and lanthanum are generally overabundant for the stars in our sample. [Ba/Fe] increases steeply with increasing iron abundance, suggestive of a primordial origin for much of the enhancement. We find no correlation between the behavior of [s/Fe] and that of the CNO group. If the s-process enhancements are related to mixing phenomena, the enrichment pocess is unconnected with that which leads to the observed CNO variations.
The large enhancements in oxygen that one might expect from Type II supemovae enrichment are not seen in our data, indicating that these objects have not been the most important source of element enhancement in co Cen. Nomoto et al. (1984) show that carbon deflagration supemovae may eject significant quantities of Fe, Ca, Si, and O, as well as s- and r-process elements. We believe that points 1), 4), and 5) above are more adequately explained as the result of enrichment by such objects.
IL INTRODUCTION
It is well established that there exist star to star variations in element abundances within all globular clusters of the Galaxy that have been studied, in particular with respect to carbon and nitrogen (for reviews of globular cluster abundance variations see Kraft 1979; Freeman and Norris 1981; and Smith 1987). As well, it is apparent that there are intracluster variations in the elements Al and Na (e.g. Peterson 1980; Cottrell and Da Costa 1981; Cohen 1981; Norris and Smith 1983) and that these variations are correlated with variations in nitrogen. A complex model of mixing events (where carbon and possibly oxygen are burned via the CN and ON processes, and then brought to the stellar surface) and primordial variations in sodium, N and/or C have been invoked to explain the observations ( see e.g. Carbon et al. 1982; Norris and Pilachowski 1985).
It is apparent, however, that virtually all clusters show no star to star variations in the iron peak elements. The exceptions to this are co Centauri and (to a lesser extent) M22. Not only do the red giants in these systems have cyanogen variations more extreme that those in other clusters (Norris and Smith 1981) but co Cen in particular possesses large variations in many heavy elements. Early photometric studies indicated that this cluster has an anomalously wide giant branch (e.g. Cannon and Stobie 1973), indicative of variations in iron abundance (or at least of a variation in the abundance of the electron donors in the stellar envelope), while numerous peculiar stars were identified (Dickens and Bell 1976; Bessell and Norris 1976 and references therein). High resolution
spectroscopic analysis of stars within this cluster by Cohen (1981), Mallia and Pagel (1981), and Gratton (1982) indicate that [Fe/H] has a range of approximately 0.7 dex, while other elements such as sodium, calcium, magnesium and s-process elements (e.g. zirconium and barium) show similar and possibly greater variations. It is well known that iron cannot be synthesized in the low mass giants that exist at present, and presumably primordial events (that is, events occurring within, say, the first 109 years of the life of the cluster) have produced the observed iron variations.
Little is known, however, of the sites of primordial enrichment processes in this cluster. Stars of differing mass will favor the production of different elements (for example carbon burning will produce Na, Mg, and Al, while oxygen burning produces Ca and the Fe peak nuclei; see for example Arnett 1971, and Arnett and Thielemann 1985). As a closed system, formed at a well defined epoch and exhibiting a wide range in chemical properties, yet having all of its brightest stars in a similar stage of evolution, co Cen presents (potentially at least) a unique astrophysical laboratory to study and place constraints on the masses of the first generation of stars that enriched the gas cloud.
Cohen (1981) and Gratton (1982) have attempted to interpret their data within the framework of primordial enrichment. In order to explain the high neutron excess suggested by the abundance patterns of ROA 253 ([Al/Fe] = +1.43 and [Na/Fe] = +0.75) Cohen conjectured the need for stars more massive than 12M0 . Such stars would also produce copious amounts of oxygen (cf. Audouze and Tinsley 1976, Figures 2 and 3), yet the relatively unenhanced oxygen abundance of this star (Cohen finds [O/Fe] < 0.24) does not support the hypothesis, pointing instead to perhaps intermediate mass stars (5M0 < M < 10Mo , hereafter IMS). In their asymptotic giant branch (AGB) phase these objects can produce enhancements of Al and Na (Iben 1975, 1976; Cottrell and Da Costa 1981). The more recent work of Cohen and Bell (1986), however, shows that this is not the only possibility. From an analysis of low resolution spectra and intermediate band photometry of the infrared CO bands they suggest that substantial mixing to the surface of the products of both CN and ON
processing occurs in many of the stars in co Cen, including in particular ROA 253. As a result, the original oxygen content of this star would be depleted, masking any primordial enhancement
It is clear, then, that oxygen is one of the key elements for an understanding of the chemical history of co Cen. Depletions of this element may be taken as unique indications of the mixing of ON processed material, while in contradistinction oxygen enhancements signal its production by a primordial generation of stars more massive than 10Mo . Direct determination of oxygen abundances is, however, made difficult by two factors. First, the only features in the visible region of the spectrum arising from oxygen are the forbidden lines of OI at M.6300.3 and 6363.8Ä which have strengths of the order of 10-60 mÄ in globular cluster giants. Second, in the atmospheres of such cool stars oxygen is tied up in CO, and simultaneous determination of C and O abundances is necessary. These difficulties notwithstanding, we initiated an observational program in 1982 with a view to obtaining accurate oxygen abundances for a large number of giants in co Cen, in an endeavor to capitalize on the unique role of this element. At the same time we wished to determine the abundances of C, N, Fe, Na, Ba and as many other heavy elements as practicable.
This paper is divided into 6 sections. In § II we present our photometric and spectroscopic data. In § IE we discuss and tabulate the atmospheric parameters for our stellar sample, along with a description of the spectroscopic analysis used to determine abundances. A table of final abundances is included in this section. The errors inherent in our analysis are elaborated upon in § IV. The abundance trends and peculiarities indicated by our data are discussed in § V. Finally, some implications of our results and a discussion of the roles of mixing and primordial events concerning the chemical evolution of co Cen are presented in § VI.
HL OBSERVATIONS
a) Program Objects
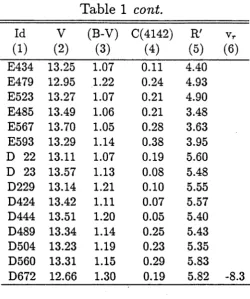
A large number of red giants has been observed in previous investigations of co Cen and these results have guided our initial choice of stars. We chose stars that have a variety of abundance patterns and it should be emphasized that our selection is heavily biased toward stars with abundance peculiarities and our sample is not representative of the abundance distribution of this cluster. The list of Persson et. al. (1980, hereafter PFCAM) and the work of Bessell and Norris (1976) provided us with a table of CO and CN indices from which we chose stars of differing CO and CN strengths. As well, stars that were peculiar with regard to other elements were also chosen. As the determination of O abundances was of primary importance in this work, it was necessary to observe stars high on the giant branch ( hereafter GB) as spectrum synthesis showed that the strength of the 01 lines at M.6300.3 and 6363.8Ä decreased with increasing temperature. At the same time we wished to avoid stars located at the tip of the GB as the possibility exists that these stars could be variables. Our observations were made on the Anglo-Australian Telescope (AAT) with the Royal Greenwich Observatory (RGO) spectrograph and the Image Photon Counting System (IPCS) first with a long slit setup, which provided us with our major candidates, and then with the fiber optic aperture plate setup, which allowed us to observe 45 stars simultaneously, in the hope that this would give us the widest possible coverage. Unfortunately as will be discussed later, the latter setup proved unsatisfactory and few data were collected in this manner. Table 1 lists previously published data for the stars in our sample. In order to check our analysis we obtained a spectrum of a Boo. We also observed co Cen ROA 58 (here and in what follows we use the nomenclature of Woolley et al., 1966), which has been studied by two other observers, and star A59 in NGC 6572, a cluster homogeneous with respect to the iron peak elements and for which abundance determinations have previously been published.
O m ega C en ta u ri
TABLE 1
Da t a Fo r lj Ce n t a u r i St a r s
ROA # (1)
Voa (2)
(B-V)o-(3)
(V -K V (4)
R(V-K)6 (5)
CO Groupc (6)
Peculiarities (7)
42... 11.12 1.44 • • . • • • • • •
43.... 11.30 1.60 3.60 0.23 L vard
53... 11.24 1.59 3.62 0.21 L var^
58... 11.30 1.31 3.14 0.13 U
84.... 11.53 1.55 3.68 0.34 L Ba IP
94... 11.44 1.25 • • • • • • • • •
100.... 11.46 1.42 • . • • • • • . • CNe
131.... 11.58 1.10 • • • • • . • • •
132.... 11.56 1.53 3.72 0.36 L var-f
139.... 11.62 1.41 3.71 0.25 L CN5
144.... 11.63 1.48 • • . • • • • • •
150.... 11.67 1.59 3.53 0.37 W CN5
161.... 11.63 1.28 3.03 0.20 L
182.... 11.76 1.35 • • • • . • • • .
371.... 12.34 1.49 3.45 0.61 W Ba II,Sr IP; var ^
NOTES: a Vo and (B-V)0 from PFCAM, except ROA 42, 100, 132, 144, 182 from ROA catalogue (Woolley ei al., 1966) , with (B-V)o decreased by 0.07 mag (see Cannon and Stobie 1973), and ROA 139 from Bessell and Norris 1976.
6 (V-K)o and R(V-K) from PFCAM.
c from Cohen and Bell (1986): L large CO; W weak CO; U CO classification of this star not possible.
d var: mildly variable (Cannon and Stobie 1973)
e Dickens and Bell 1976.
f var: mildly variable (Lloyd-Evans 1977).
9 CN strong star from Bessell and Norris 1976.
We made the most efficient use of our limited telescope time by choosing stars from our list of interesting objects that had nearby bright companions, found serendipitously, as charted on the ROA atlas of co Cen (Woolley ex al. 1966). Only by observing stars simultaneously, through the expedient of rotating the spectrograph slit has this project become feasible for us.
b) Photometry
In abundance determinations it is important to have accurate effective temperatures, r eff. Our values are based on the (V-K)0 and r eff values of PFCAM. To supplement their values we undertook a photometric program using the 0.6-m telescope on Siding Spring Mountain using a Varian photocell having an InGaAsP cathode. Rather than observe in the V and K bands, we observed in V and through an interference filter centered at 1.05fi and having a bandpass of 0.08|i FWHM, to obtain (V-lji)i colors. By observing stars included in the PFCAM survey, a relationship was established between (V-lp.)i and (V-K)0 (and therefore Teff). Figure 1 shows our calibration, while columns (2) and (3) of Table 2 contain (V-lji)i and our adopted values for Teff. PFCAM have estimated that their temperatures are accurate to 50°K and as our temperatures are tied into the (V-K)0 system, we believe that our error in Teff is similar. Naturally, should the temperatures be systematically in error, then our abundance determination will be affected, but the star to star differences should be relatively unchanged.
The DDO photometric index C(4142) measures the strength of the CN band at Ä.4215Ä with respect to the adjacent continuum at X.4100Ä, and has been widely used for both halo field and globular cluster stars. Many of our stars already have C(4142) indices, and we completed the list for our stars by observing on the 2.3-m telescope on Siding Spring Mountain. 5C(4142) is a measure of the cyanogen band strength independent of magnitude on the GB and is defined as the distance a star falls above the line defined
4200
4000
3800
[image:36.562.100.481.254.633.2](
v
-1
a
0,
Figure 2.1: Instrumental (V-ljJ.) colors plotted against effective temperature for stars in common with PFCAM.
O m ega C en ta u ri
TABLE 2
Pa r a m e t e r s Fo r lo Ce n t a u r i St a r s
ROA #
(1)
(v-i/Oi
(2)
T
(3)
log g
(4)
C(4142)
(5)
<5C(4142) (6)
References
(7)
4 2... -.24 4150 0.5 0.32 0.18 2.3
4 3... -.01 3950 0.4 0.34 0.18 B
53... 0.04 3950 0.4 0.24 0.07 B
58... -.20 4200 0.6 0.21 0.07 B
84... 0.13 3900 0.5 0.30 0.13 2.3
94... -.28 4200 0.7 0.15 0.01 2.3
100. . . . -.32 4150 0.7 0.51 0.37 2.3
131. . . . -.25 4150 0.8 0.13 0.01 2.3
132. . . . 0.13 3900 0.5 0.22 0.05 U
139. . . . -.25 4150 0.8 0.39 0.25 B
144. . . . -.30 4200 0.8 0.33 0.19 2.3
150. . . . 0.02 3950 0.6 0.45 0.29 B
161. . . . -.32 4250 0.8 0.14 0.01 U
182. . . . -.30 4200 0.9 0.23 0.09 U
371. . . . 4000 0.9 0.46 0.30 U
References - (B) Bessell and Norris (1976).
(2.3) data obtained on 2.3-m on Siding Spring Mountain during 1986. (U) C(4142) determined from spectra (Norris, unpublished).
by Bessell and Norris (1976, see their Figure 5). Columns (5) - (7) contain C(4142), 8C(4142) and source material respectively. We shall use these data in §V a.
c) Spectra
Spectra were obtained in two modes. The first utilized the AAT in combination with the RGO spectrograph in long-slit mode and the IPCS. Observations using this setup were carried out on the nights of 1982 June 19, 1984 April 13/14, and 1986 April 13/14. As well as coping with the vagaries of the weather, on one run we had to contend with the loss of primary mirror coating, the result of mercury leaking from the secondary cell. The second setup used the AAT in combination with the RGO spectrograph , the FOCAP fibre aperture plate system with 200)1 fibres and the IPCS. For unknown reasons the response of this system was below expectations. Two half nights on 1985 May 27 and 29 produced minimal results, and we reverted back to our original setup for our final run in 1986. Useful spectra for only ROA 94 and ROA 131 were obtained with this setup.
In the long slit mode our observations were carried out at three wavelength regions: M.6110 - 6270Ä in order to obtain lines for Na, Ca, Zr, Ba and Fe; M.6260 - 6420Ä for lines of O and Fe; and M.4210 - 4330Ä for the CH band at 4320Ä. We obtained a resolution of 0.4Ä FWHM for the CH band spectra and 0.3Ä for the red spectral regions. When using the fibre plate setup, we observed only at one wavelength setting, centered on 6330Ä and covering 85Ä.
Exposures of between 4000 and 6000 seconds were needed for the regions around 6300Ä and the resultant spectra had in excess of 500 counts per 0.12Ä pixel in the regions of continuum. Such long exposures were needed in order to record the very weak OI lines, in many cases expected to be less than 20mA. Shorter exposures of 1000 seconds were sufficient for the CH spectra for which we obtained approximately 200 counts per 0.08Ä pixel in the continuum.
In order to measure the equivalent width of the lines in the red spectra, we first estimated a continuum for each. Recourse to the Arcturus spectral atlas (Griffin 1968) enabled us to identify areas of continuum. A smooth curve was then fitted through these areas on our observed spectra. Each spectrum was wavelength calibrated. In order to help us identify useful lines, a high signal to noise spectrum was produced by summing all our individual spectra together. While abundances cannot, of course, be determined from such a spectrum, its high signal to noise allows unambiguous identification of possible spectral features.
We would like to note here that Gratton (1982) has found abundances for Yttrium from the 6222.6Ä YI line. We were unable, however, to find this line either on individual spectra or on the summed spectrum. Inspection of the Arcturus atlas also failed to reveal a line at the designated wavelength.
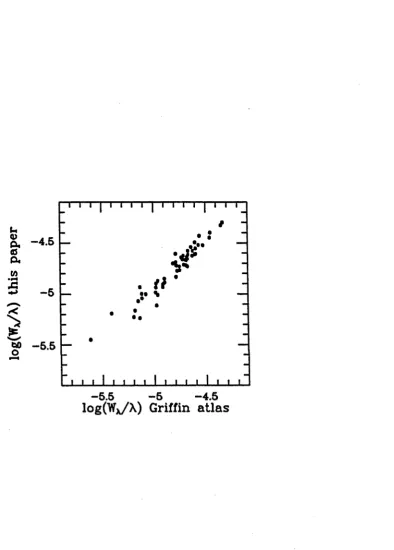
The equivalent width of each line was measured using reduction packages at Mount Stromlo which fitted a gaussian curve to the relevant data points. This technique is perhaps not as accurate as measuring the lines by hand using a planimeter but is certainly much faster and, because of the large amount of data was the most practical. To test the method, equivalent widths of lines from our spectrum of a Boo were measured using our line measuring program, along with the corresponding lines from the Griffin atlas using a planimeter. Figure 2 compares log(W
iJX)
for the two data sets. As can be seen, there is good agreement, with the values of log(W\f k )
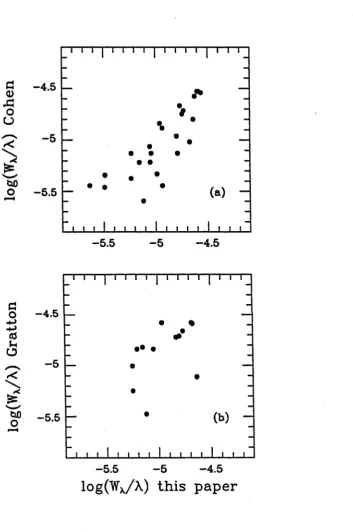
derived from our spectrum being larger by 0.08 than those derived from the Griffin atlas.In order to further gauge the errors in the measurement of the spectral lines, we can compare the equivalent widths that we have measured for ROA 58 with those published by Cohen (1981) and Gratton (1982). We obtained spectra for this star centered on 6190Ä on 1982 June 19, and centered on 6320Ä on 1984 April 13. Figure 3
a
shows l o g ( W ^ ) determined by Cohen (1981) for ROA 58 against our measurements. In Figure 3b
we plot our values versus those obtained by Gratton (1982). Furthermore, we observed the star ROA 53 twice, once in 1984 and again in—5 5 —5 —4 5
l°g(W x/^ ) G riffin a t la s
Figure 2.2: Values of log(WxA) for equivalent widths measured from the spectrum of a Boo. We compare the widths measured from the Arcturus Atlas (Griffin 1968) with those from a spectrum obtained by the authors on the Anglo-Australian Telescope.
[image:40.562.110.505.75.626.2]lo
g(
W
x/X
)
G
ra
tt
o
n
lo
g(
W
x/A
)
C
o
h
en
l°g(WxA ) th is paper
Figure 2.3: Equivalent widths from the present survey for ROA 58 against those measured by (a) Cohen (1981), and (b) Gratton (1982).
[image:41.562.105.459.117.650.2]1986. The comparison of log(WxA) for the two years in Figure 4 shows that our continuum fitting has been consistent.
Table 3 lists the measured Wx for each of our stars. Where we had only two or three lines for a given element (e.g. oxygen, zirconium) and if these lines were all too small to be distinguished in a spectrum with good signal to noise, we placed upper limits of 20mA on each line* .
IV. ANALYSIS
a) Atmospheric Parameters
In analyzing the spectra, it is necessary to know the atmospheric parameters of each star: Teffi the surface gravity, log g\ the heavy metal abundance, [A/H]; and the microturbulent velocity §t. As described above, we obtained Teff from our photometric colors. Some workers have used plots of log abundance vs excitation potential, of the neutral iron lines to estimate 7eff. If the effective temperature is chosen correctly then the derived abundance should be independent of %. We have not adopted this approach as we believe that the r eff derived from our color index is sufficiently accurate.
Log g was obtained from the standard equation
g* M* T* L*
log— = log— + 41og—— log—
go Mq 1 o Lq
* The 01 line at X6300.3Ä was ill-defined in our spectrum of ROA 150, and the equivalent u obtained, 43mA, was initially adopted as an upper limit. The abundance derived from this feal 0.2 dex less than that from the >.6363.8Ä line. We have therefore adopted 43mA as the corre for this line in subsequent analysis.
I T T T
Figure 2.4: Log(WxA) for lines for two spectra of ROA 58 obtained by the authors in 1984 and 1986. As can be seen, there is little offset between the two data sets, indicating a consistent placing of the continuum.
[image:43.562.113.514.161.633.2]T
A
B
L
E
3
E q u iv a l e n t W id t h s f o r u > C e n t a u r i S t a r s t— CO ©o o o
o oO <MO to O I 0 0 H ^iM r t o oo CO CO * r —I CO t—I i— I l— I
CM
00 © l>- © t"
t—I CO CO . CO CMI O i T—I
<M ©
GO © L - (Mr —I O i ©CO
<M
O
© ©
(M CM
CJ N © C M
CO i—I CM : 3 o© CMHO
• CM * 00
* r—4 © o© ©
o HO © co CM CO o o © oo oo HO CO HO CO CM v ü b • qo =tt=^
O ^ Cm or^
5 CO
V I «
o ©
CM CM V I V I
O CO <M CM V I V I
co o o t -o CO
o o CM CM V I VI
co
o ^ co co
r t * t — CO tJ«
CO o CO CO
C i i—t t> * CO
o ©
CM CM V I V I
t— ©
© HO
c o o o
ci ©
© 1>-co CO CO ©
co r—
o o ©
© © CM CM
V I VI
oo ©
© ©
CM r —I CM OO
co ^ © oo
© ©
co co
V I V I
© ©
© © CM CM
V I VI
1— I ©
©co
© © CM ©
© © CM CO
T—I CO © © © CM
CO CM © © © © © © «3 CM b-CM © CM ©co
L-H CO o H CO O
© t>. © rj« oo ©
C ) CM r t H M H
©
© © r —< CM
©
oo
© © t—©
L— 0 0
00 ©
© © ©
©
© 1S 8CM © o-CM CM H CM
m i © ^
^ c o
*• t—I 1—I
© © © © CM CM CM CM
VI VI V I VI
© ©
c m © CM CM
© T—I 0 0 CM CM i—c
i—i © t " - ©
L
-CO i—i © © © ^
©
^ CO
CM CM ©
© CO © ^ © i-H ^ © CM © r —I CM r*H t—I r —I
© t— I ©
© © © © CM <M CM <M
V I V I V I VI
o o Tt<
c m
i r > © © CM CM © 1 2 C l Is- B - - ^ © ^ 1—( CM i—t i—c t—I
© © r—I
co § 2
©
§ g n §
° CM 1 r—I i—i
oo oo
©co © CO CM © oo
CO ^ © CM © © © O -l i—t 1—f i—i
° ° © <=* c 5
©
oo
CM <M
CO N ©
T—I HO t—t GO
t " ; © © CM 1—I 1—1 1—1 T—I
0 O 0 O © i —< © © © C M © CO hO CM © CM CO ©
O h ^ C O O C l O N
i—i © CM i—I © t—I © ©
CO
© HO CM
© © i HO


![Figure 2.5: Log(Wx/X) (01 6300.3Ä) versus [O/Fe] for ROA 150. Lines a)](https://thumb-us.123doks.com/thumbv2/123dok_us/1923440.151504/54.562.101.457.266.642/figure-log-wx-a-versus-fe-roa-lines.webp)


![Figure 2.12: ([C/Fe] + [O/Fe]) versus against the 4200Ä CN band index 8C(4142).](https://thumb-us.123doks.com/thumbv2/123dok_us/1923440.151504/71.562.105.456.243.665/figure-fe-fe-versus-a-cn-band-index.webp)