White Rose Research Online URL for this paper:
http://eprints.whiterose.ac.uk/142007/
Version: Published Version
Article:
Jiang, X, Finucane, HK orcid.org/0000-0003-3864-9828, Schumacher, FR
orcid.org/0000-0002-3073-7463 et al. (330 more authors) (2019) Shared heritability and
functional enrichment across six solid cancers. Nature Communications, 10. 431. ISSN
2041-1723
https://doi.org/10.1038/s41467-018-08054-4
[email protected]
https://eprints.whiterose.ac.uk/
Reuse
This article is distributed under the terms of the Creative Commons Attribution (CC BY) licence. This licence
allows you to distribute, remix, tweak, and build upon the work, even commercially, as long as you credit the
authors for the original work. More information and the full terms of the licence here:
https://creativecommons.org/licenses/
Takedown
If you consider content in White Rose Research Online to be in breach of UK law, please notify us by
Shared heritability and functional enrichment
across six solid cancers
Xia Jiang et al.
#Quantifying the genetic correlation between cancers can provide important insights into the
mechanisms driving cancer etiology. Using genome-wide association study summary
sta-tistics across six cancer types based on a total of 296,215 cases and 301,319 controls of
European ancestry, here we estimate the pair-wise genetic correlations between breast,
colorectal, head/neck, lung, ovary and prostate cancer, and between cancers and 38 other
diseases. We observed statistically signi
fi
cant genetic correlations between lung and head/
neck cancer (
r
g=
0.57,
p
=
4.6 × 10
−8), breast and ovarian cancer (
r
g=
0.24,
p
=
7 × 10
−5),
breast and lung cancer (
r
g=
0.18,
p
=
1.5 × 10
−6) and breast and colorectal cancer (
r
g=
0.15,
p
=
1.1 × 10
−4). We also found that multiple cancers are genetically correlated with
non-cancer traits including smoking, psychiatric diseases and metabolic characteristics. Functional
enrichment analysis revealed a signi
fi
cant excess contribution of conserved and regulatory
regions to cancer heritability. Our comprehensive analysis of cross-cancer heritability
sug-gests that solid tumors arising across tissues share in part a common germline genetic basis.
https://doi.org/10.1038/s41467-018-08054-4
OPEN
Correspondence and requests for materials should be addressed to X.J. (email:[email protected]) or to P.K. (email:[email protected]) or to S.Löm. (email:[email protected]).#A full list of authors and their af
filiations appears at the end of the paper.
123456789
I
nherited genetic variation plays an important role in cancer
etiology. Large twin studies have demonstrated an excess
familial risk for cancer sites including, but not limited to,
breast, colorectal, head/neck, lung, ovary, and prostate with
heritability estimates ranging between 9% (head/neck) to 57%
(prostate)
1–3. Data from nation-wide and multi-generation
registries further show that elevated cancer risks go beyond
nuclear families and isolated types, as family history of a speci
fi
c
cancer can increase risk for other cancers
4–6. Additional evidence
for a shared genetic component have been demonstrated by
cross-cancer genome-wide association study (GWAS)
meta-ana-lyses, which set out to identify genetic variants associated with
more than one cancer type. Fehringer et al. studied breast,
col-orectal, lung, ovarian, and prostate cancer, and identi
fi
ed a novel
locus at 1q22 associated with both breast and lung cancer
7. Kar
et al. focused on three hormone-related cancers (breast, ovarian,
and prostate), and identi
fi
ed seven novel susceptibility loci shared
by at least two cancers
8.
Previous attempts to estimate the genetic correlation across
cancers using GWAS data
9–12have mostly relied on restricted
maximum likelihood (REML) implemented in GCTA
(genome-wide complex trait analysis)
13and individual-level genotype data.
However, these studies have had limited sample sizes, yielding
inconclusive results. Sampson et al. quanti
fi
ed genetic correlations
across 13 cancers in European ancestry populations and identi
fi
ed
four cancer pairs with nominally signi
fi
cant genetic correlations
(bladder
–
lung, testis
–
kidney,
lymphoma
–
osteosarcoma, and
lymphoma
–
leukemia)
9. They did not observe any signi
fi
cant
genetic correlations across common solid tumors including
can-cers of the breast, lung and prostate
9. REML becomes
computa-tionally challenging for large sample sizes and is sensitive to
technical artifacts. LD score regression (LDSC)
14,15overcomes
these issues by leveraging the relationship between association
statistics and LD patterns across the genome. We recently used
cross-trait LDSC to quantify genetic correlations across six cancers
based on a subset of the data included here and found moderate
correlations between colorectal and pancreatic cancer, as well as
between lung and colorectal cancer
16. However, the average
sample size was only 11,210 cases and 13,961 controls per cancer,
resulting in imprecise estimates with wide con
fi
dence intervals.
In addition to the development of novel analytical methods
tailored to genomic data, several high-quality functional
anno-tations have recently been released into the public domain
through large-scale efforts. For example, the ENCODE
con-sortium has built a comprehensive and informative parts list of
functional elements in the human genome (
http://www.nature.
com/encode/#/threads
), which allows for the analysis of
compo-nents of SNP-heritability to unravel the functional architecture of
complex traits.
Here, we use summary statistics from the largest-to-date
Eur-opean ancestry GWAS of breast, colorectal, head/neck, lung,
ovary, and prostate cancer with an average sample size of 49,369
cases and 50,219 controls per cancer, to quantify genetic
corre-lations between cancers and their subtypes. We also use GWAS
summary statistics for 38 non-cancer traits (average N
=
113,808
per trait), to quantify the genetic correlations between the six
cancers and other diseases. Furthermore, we assessed the
pro-portion of cancer heritability attributable to speci
fi
c functional
categories, with the goal of identifying functional elements that
are enriched for SNP-heritability.
Our comprehensive analysis identi
fi
es statistically signi
fi
cant
genetic correlations between lung and head/neck cancer, breast
and ovarian cancer, breast and lung cancer, and breast and
col-orectal cancer. We also
fi
nd multiple cancers to be genetically
correlated with non-cancer traits including smoking, psychiatric
diseases, and metabolic traits. Functional enrichment analysis
reveals a signi
fi
cant contribution of conserved and regulatory
regions to cancer heritability. Our results suggest that solid
tumors arising across tissues share in part a common germline
genetic basis.
Results
Heritability estimates across cancers
. We
fi
rst estimated
cancer-speci
fi
c heritability causally explained by common SNPs (
h
2g)
using LDSC (note that this quantity is slightly different from the
h
2gas de
fi
ned in Yang et al.
17which estimates the heritability due
to genotyped and imputed SNPs) (see Methods). Estimates of
h
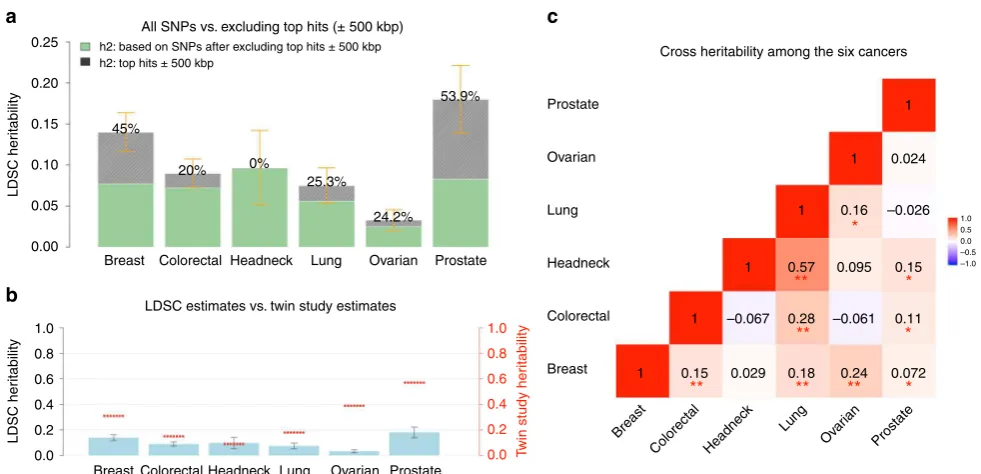
2gon the liability scale ranged from 0.03 (ovarian) to 0.25 (prostate)
(Supplementary Table 1). After removing genome-wide
sig-ni
fi
cant (
p
< 5 × 10
−8) loci, de
fi
ned as all SNPs within 500 kb of
the most signi
fi
cant SNP in a given region (Supplementary
Data 1), we observed an ~50% decrease in SNP-heritability for
prostate and breast cancer, and ~20% decrease for lung, ovarian,
and colorectal cancer, despite the fact that we were only excluding
1% (colorectal cancer) to 5% (breast cancer) of the genome. In
contrast, the SNP-heritability for head/neck cancer was not
affected by removing genome-wide signi
fi
cant loci (Fig.
1
a). For
most of the cancers, the GWAS signi
fi
cant loci for that particular
cancer explained most of the heritability. For some cancers,
however, signi
fi
cant GWAS loci of other cancers also explained a
non-trivial part of its heritability. For example, the signi
fi
cant
breast cancer GWAS loci explained 10%, 15%, and 22%
herit-ability of colorectal, ovarian and prostate cancer, respectively; the
signi
fi
cant colorectal cancer GWAS loci explained 11%
herit-ability of prostate cancer; the signi
fi
cant lung cancer GWAS loci
explained 10% heritability of head/neck cancer; and the
sig-ni
fi
cant prostate cancer GWAS loci explained 11 and 15%
her-itability of breast and ovarian cancer, respectively (Supplementary
Table 2). Comparing the liability-scale SNP-heritability to
cor-responding estimates from twin studies suggests that common
SNPs can almost entirely explain the classical heritability of head/
neck cancer, whereas for other cancers, only 30
–
40% of
herit-ability can be explained (Fig.
1
b).
Genetic correlations between cancers
. We then estimated the
genetic correlation between cancers using cross-trait LDSC (see
Methods). After adjusting for the number of tests (
p
< 0.05/15
=
0.003), we found multiple signi
fi
cant genetic correlations Fig.
1
c
and Supplementary Table 1), with the strongest result observed
for lung and head/neck cancer (
rg
=
0.57, se
=
0.10). In addition,
colorectal and lung cancer (
rg
=
0.28, se
=
0.06), breast and
ovarian cancer (
rg
=
0.24, se
=
0.06), breast and lung cancer (
rg
=
0.18, se
=
0.04), and breast and colorectal cancer (
rg
=
0.15, se
=
0.04) showed statistically signi
fi
cant genetic correlations. We also
observed nominally signi
fi
cant genetic correlations (
p
< 0.05)
between lung and ovarian cancer (
rg
=
0.16, se
=
0.08), prostate
cancer and head/neck (
rg
=
0.15, se
=
0.08), colorectal (
rg
=
0.11,
se
=
0.05), and breast cancer (
rg
=
0.07, se
=
0.03) (Fig.
1
c). Some
cancer pairs showed minimal correlations with estimates close to
0 (ovarian and prostate:
rg
=
0.02, se
=
0.07; lung and prostate:
rg
=
−
0.03, se
=
0.04; breast and head/neck:
rg
=
0.03, se
=
0.06).
We further calculated the cross-cancer genetic correlation based
on data after excluding the GWAS signi
fi
cant regions of each
cancer. The estimates were mostly consistent with the results
calculated based on all SNPs.
cancer subtypes adenocarcinoma and squamous cell carcinoma
was similarly 0.58 (se
=
0.10). Further, we observed a signi
fi
cantly
larger genetic correlation of lung cancer with ER
−
(
rg
=
0.29,
se
=
0.06) than with ER
+
breast cancer (
rg
=
0.13, se
=
0.04)
(
p
difference=
0.002). This also held true for lung squamous cell
carcinoma, which showed statistically stronger genetic correlation
with ER
−
(
rg
=
0.33, se
=
0.08) than with ER
+
breast cancer
(
rg
=
0.11, se
=
0.05) (
p
difference=
0.0019). We observed no other
statistically signi
fi
cant differential genetic correlations across
subtypes (all
p
difference> 0.1).
We then estimated local genetic correlations between cancers
using
ρ
-HESS, dividing the genome into 1703 regions (see
Methods) (Fig.
2
and Supplementary Fig. 1). We found that
although the genome-wide genetic correlation between breast
and prostate cancer was modest (
rg
=
0.07), chr10:123M
(10q26.13,
p
=
1.0 × 10
−7) and chr9:20
–
22 M (9p21,
p
=
1.0 ×
10
−6), two previously known pleiotropic regions
18, showed
signi
fi
cant genetic correlations (
rg
=
−
0.00098 and
rg
=
0.00046). Similarly, although the genome-wide genetic
correla-tion between lung and prostate cancer was negligible (
rg
=
−
0.03),
two
previously
identi
fi
ed
pleiotropic
regions
(chr6:30
–
31 M or 6p21.33,
p
=
5.7 × 10
−7and chr20:62M or
20q13.33,
p
=
2.8 × 10
−6) exhibited signi
fi
cant local genetic
correlations (
rg
=
−
0.00060 and
rg
=
0.00067). Overall, local
genetic correlation analysis reinforced shared effects for 44%
(31/71) of previously reported pleiotropic cancer regions
(Supplementary Data 2). It also identi
fi
ed novel pleiotropic
signals. For example, the breast and prostate cancer pleiotropic
region at 2q33.1 showed signi
fi
cant local genetic correlation
between breast and ovarian cancer (
p
=
2.3 × 10
−6).
Addition-ally, 6p21.32, a region indicated for head/neck and prostate
cancer, showed highly signi
fi
cant local genetic correlation for
head/neck and lung cancer (
p
=
8.6 × 10
−8).
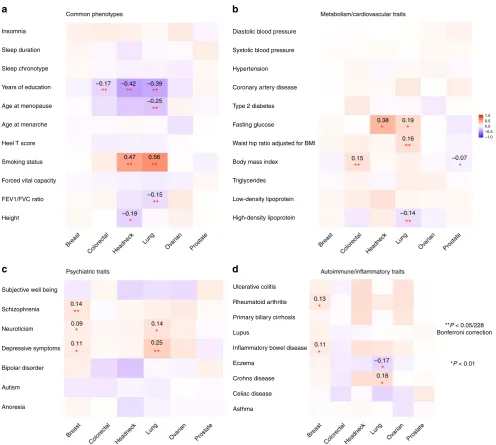
Genetic correlations between cancer and other traits
.
Sig-ni
fi
cant genetic correlations (
p
< 0.05/228
=
0.0002) between the
six cancers and 38 non-cancer traits re
fl
ected several known
associations (Fig.
3
and Supplementary Data 3). We observed a
strong genetic correlation between smoking and lung cancer
(
rg
=
0.56, se
=
0.06), and similarly for head/neck cancer (
rg
=
0.47, se
=
0.08), both cancers having smoking as its primary risk
factor
19,20. Educational attainment was negatively genetically
correlated with colorectal (
rg
=
−
0.17, se
=
0.04), head/neck
(
rg
=
−
0.42, se
=
0.07), and lung cancer (
rg
=
−
0.39, se
=
0.04) (all
p
< 5 × 10
−6). Body mass index (BMI) showed a positive genetic
correlation with colorectal cancer (
rg
=
0.15, se
=
0.03) and also
suggestive but weak negative correlations with prostate (
rg
=
−
0.07, se
=
0.03) and breast cancer (
rg
=
−
0.06, se
=
0.03). Lung
cancer showed a negative genetic correlation with lung function
(
rg
=
−
0.15, se
=
0.04) and age at natural menopause (
rg
=
−
0.25,
se
=
0.05), and moderate positive genetic correlations with
depressive symptoms (
rg
=
0.25, se
=
0.06) and waist-to-hip ratio
(
rg
=
0.16, se
=
0.04). Breast cancer showed a positive genetic
correlation with schizophrenia (
rg
=
0.14, se
=
0.03).
We did not
fi
nd evidence of genetic correlations between cancer
and several previously suggested risk factors
21–23including
cardiovascular traits (coronary artery disease, hypertension, and
blood pressure) or sleep characteristics (chronotype, duration, and
insomnia). Further, we did not observe genetic correlations
between cancer and circulating lipids (HDL, LDL, and
triglycer-ides) or type 2 diabetes-related traits except a signi
fi
cant
negative
correlation
between
HDL
and
lung
cancer
(
rg
=
−
0.14, se
=
0.04). We observed no signi
fi
cant genetic
correlation between breast cancer and age at menarche
(
rg
=
−
0.03, se
=
0.03) or age at natural menopause (
rg
=
−
0.01,
se
=
0.03). We also did not observe notable genetic correlations
between cancer and autoimmune in
fl
ammatory diseases or height.
0.25
All SNPs vs. excluding top hits (± 500 kbp)
LDSC estimates vs. twin study estimates
Cross heritability among the six cancers
h2: based on SNPs after excluding top hits ± 500 kbp h2: top hits ± 500 kbp
a
b
c
0.20
45%
20% 0%
25.3%
24.2%
53.9%
Prostate 1
0.024 1
1
1
1
1 0.15 0.029
–0.067 –0.061
0.18 0.24
0.11 0.15
0.072 0.095
1.0 0.5
–1.0 –0.5 0.0
0.16 –0.026
0.28 0.57
**
**
**
**
**
*
*
*
*
Prostate Ovarian
Ovar ian Lung
Lung 0.15
0.10
0.05
0.00
1.0
0.8
0.6
0.4
0.2
0.0
LDSC her
itability
LDSC her
itability
Breast
Breast
Breast Colorectal
Colorectal
Colorectal
Headneck Headneck
Headnec k
Lung Ovarian Prostate
Breast Colorectal Headneck Lung Ovarian Prostate
1.0
0.8
0.6
0.4
0.2
0.0 Twin study her
itability
Fig. 1Estimates of SNP-heritability (h2
g) and cross-cancer heritability (rg) for the six cancer types. SNP-heritability and cross-cancer heritability are calculated based on HapMap3 SNPs using LD score regression (LDSC).aThe solid bar represents overall SNPh2
gon the liability scale, calculated based on all HapMap3 SNPs. The dark green bar representsh2
gcalculated based on non-significant SNPs—the remaining SNPs after excluding genome-wide
significant hits (p< 5 × 10⁻⁸) ± 500 kb. The black bar with density texture indicates proportion ofh2
g(as reflected by the percentages displayed on top of each bar) that could be explained by top hits ±500 kb surrounded areas. The orange error bars represent 95% confidence intervals.bThe solid blue bar represents overall SNPh2
[image:4.595.52.543.48.285.2]Breast_prostate
Lung_prostate
Obser
ved –log
10
(
p
)
Expected –log
10(
p
)
Expected –log
10(
p
)
Obser
ved –log
10
(
p
)
8
10:123231465–123900544 6:30798168–31571217
20:62190180–62965162
6:26791233–28017818 9:20463534–22206558
11:68005825–69516129
6:28017819–28917607
1:203334734–204681067 2:214014282–215573794
6:25684587–26791232 1:154770403–156336132
7:1353067–2062397 6:28917608–29737970
3:87409732–88298372 14:35859593–38667724 3:139954597–141339096 6:28017819–28917607
11:112459488–114257727 1:44969183–46899500
8
6
6
4
4
2
2
0
0
6
6
4
4
2
2
0
0
Local genetic covariance
0.0007
0.0003
0.0000
–0.0003
–0.0007
–0.0005 –0.0003
–0.0008
0.002
0.001 0 0.001 0.000
0.002 0.0000 0.0008 0.0005 0.0003 –0.0010
0.002 0.001 0.000
0.002 0.001 0
1 2 3 4 5 6 7 8 9 10 11 12 13 14 15 16 17 18 19 20 21 22
1 2 3 4 5 6 7 8 9 10 11 12 13 14 15 16 17 18 19 20 21 22
1 2 3 4 5 6 7
Local SNP-heritability
Local SNP-heritability
Local genetic covariance
8 9
chr9:20463534–22206558
chr10:123231465-123900544
chr6:26791233–28017818
chr20:62190180–62965162
chr6:30798168–31571217
10 11 12 13 14 15 16 17 18 19 20 21 22
1 2 3 4 5 6 7 8 9 10 11 12 13 14 15 16 17 18 19 20 21 22
1 2 3 4 5 6 7 8 9 10 11 12 13 14 15 16 17 18 19 20 21 22
1 2 3 4 5 6 7 8 9 10 11 12 13 14 15 16 17 18 19 20 21 22
Breast
Breast & prostate
Lung & prostate
Prostate
Prostate
Lung
a
c
b
d
[image:5.595.56.540.47.614.2]Subtype analysis revealed that smoking and educational
attainment showed genetic correlations with all lung cancer
subtypes (Supplementary Data 3). Educational attainment, forced
vital capacity and depressive symptoms showed genetic
correla-tions with ER
−
but not ER
+
breast cancer, whilst the observed
genetic correlation between schizophrenia and breast cancer was
limited to ER
+
disease, and the genetic correlation between
depressive symptoms and lung cancer was observed only for lung
squamous cell carcinoma.
We further assessed the support for mediated or pleiotropic
causal models for non-cancer traits and cancer using the
correlation between trait-speci
fi
c effect sizes of genome-wide
signi
fi
cant SNPs for pairs of phenotypes. We detected four
putative directional genetic correlations (de
fi
ned as
p
< 0.05 from
a likelihood ratio (LR) comparing the best non-causal model to
the best causal model) (Fig.
4
), where SNPs associated with the
non-cancer trait showed correlated effect estimates with cancer
but the reverse was not true (circulating HDL concentrations and
breast cancer, LR
non-causal vs. causal=
0.04, schizophrenia and
breast cancer, LR
non-causal vs. causal=
0.003, age at natural
menopause and breast cancer, LR
non-causal vs. causal=
0.04, and
lupus and prostate cancer, LR
non-causal vs. causal=
0.0006).
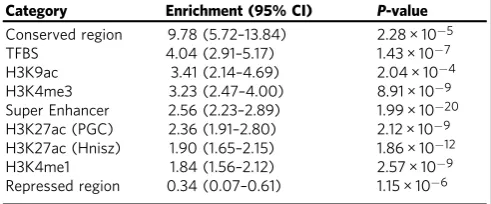
Functional enrichment analysis of cancer heritability
. Finally,
we partitioned SNP-heritability of each cancer by using 24
genomic functional annotations (the baseline-LD model
descri-bed in Gazal et al.
24) and 220 cell-type-speci
fi
c histone mark
annotations (the cell-type-speci
fi
c model described in Finucane
et al.
14). Meta-analysis across the six cancers revealed statistically
signi
fi
cant enrichments for multiple functional categories.
We observed the highest enrichment for conserved regions
(Table
1
, Supplementary Table 3) which overlapped with
only 2.6% of SNPs but explained 25% of cancer SNP-heritability
Insomnia
–0.17
0.47
0.14
0.09
0.11
0.14
0.25
0.13
0.11
–0.17 –0.14
0.16
0.15
0.38 0.19 1.00.5
0.0 –0.5 –1.0
–0.07
*P < 0.01 **P < 0.05/228 Bonferroni correction
0.18 0.56
**
**
**
**
**
**
**
*
*
*
**
**
**
*
*
*
*
*
*
*
**
*
**
–0.42 –0.39
–0.25
–0.15
–0.19 Common phenotypes
Psychiatric traits
Metabolism/cardiovascular traits
Systolic blood pressure Diastolic blood pressure
a
c
d
b
Hypertension
Coronary artery disease
Type 2 diabetes
Fasting glucose
Waist hip ratio adjusted for BMI
Body mass index
Triglycerides
Low-density lipoprotein
High-density lipoprotein
Ulcerative colitis
Autoimmune/inflammatory traits
Rheumatoid arthritis
Primary biliary cirrhosis
Lupus
Inflammatory bowel disease
Eczema
Crohns disease
Celiac disease
Asthma Sleep duration
Sleep chronotype
Years of education
Age at menopause
Age at menarche
Heel T score
Smoking status
Forced vital capacity
FEV1/FVC ratio
Height
Subjective well being
Schizophrenia
Neuroticism
Depressive symptoms
Bipolar disorder
Autism
Anorexia
Breast
Colorectal Headnec k
Lung Ovar
ian
Prostate Breast Colorectal Headnec k
Lung Ovar
ian Prostate Breast
Colorectal Headnec k
Lung Ovar
ian
Prostate Breast Colorectal Headnec
k Lung
Ovar ian
Prostate
[image:6.595.50.547.47.492.2](9.8-fold enrichment,
p
=
2.3 × 10
−5). Transcription factor
bind-ing sites showed the second highest enrichment (4.0-fold, 13% of
SNPs explaining 40% of SNP-heritability,
p
=
1.4 × 10
−7).
Fur-ther, super-enhancers (groups of putative enhancers in close
genomic proximity with unusually high levels of mediator
bind-ing) showed a signi
fi
cant 2.6-fold enrichment (
p
=
2.0 × 10
−20).
Additional enhancers, including regular enhancers (3.2-fold),
weak enhancers (3.1-fold) and FANTOM5 enhancers (3.1-fold),
presented similar enrichments but were not statistically
sig-ni
fi
cant. In addition, multiple histone modi
fi
cations of epigenetic
markers H3K9ac, H3K4me3, and H3K27ac, were all signi
fi
cantly
enriched for cancer heritability. Repressed regions exhibited
depletion (0.34-fold,
p
=
1.2 × 10
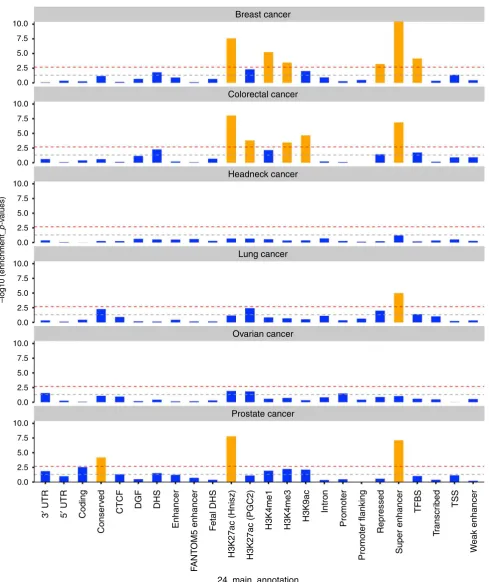
−6). Enrichment analysis of
functional categories for each cancer and cancer subtype are
shown in Fig.
5
and Supplementary Table 4.
Overall, cell-type-speci
fi
c analysis of histone marks identi
fi
ed
signi
fi
cant enrichments speci
fi
c to individual cancers
(Supple-mentary Fig. 2). For breast cancer, 3 out of 8 statistically
signi
fi
cant tissues were adipose nuclei (H3K4me1, H3K9ac) and
breast myoepithelial (H3K4me1) cells. For colorectal cancer, 15
out of the 18 statistically signi
fi
cant enrichments were observed in
either colon or rectal tissues (colon/rectal mucosa, duodenum
mucosa, small/large intestine, and colon smooth muscle). We
observed no signi
fi
cant enrichments for head/neck, lung, and
ovarian cancer, but we noted that for both lung (9 out of 10) and
ovarian cancer (6 out of 10), the most enriched cell types were
immune cells; while in head/neck cancer, 6 out of 10 most highly
enriched cell types belonged to CNS (Supplementary Fig. 3,
Supplementary Data 4). Cell-type-speci
fi
c analysis for cancer
subtypes are shown in Supplementary Data 5. Comparing
0.2
Directional correlation analysis
Positive effect Negative effect
Breast cancer
Breast cancer
Breast cancer
Prostate cancer Schizophrenia
Age at menopause
Systemic lupus HDL
a
b
c
d
0.1
0.0
–0.1
0.2
0.2 0.2
0.3 0.3
0.2 –0.06 –0.02 0.06
HDL ascertainment
Schizophrenia ascertainment
Menopause age ascertainment
Systemic lupus ascertainment
Breast cancer ascertainment
Breast cancer ascertainment
Breast cancer ascertainment
Prostate cancer ascertainment
0.02
0.2
0.2 0.4 0.8
0.6 1.0
0.1 1.2
–0.2
–0.1
–0.2
–0.3
–0.4 0.1
0.1 0.1
0.1
0.0
0.0
0.0 0.5 1.0
–1.0 –0.5
–0.5
0.0 0.0
0.0
0.0
0.0 –0.1
–0.1 –0.1
–0.1
–0.2
–0.2
0.2
0.2 0.3
0.4 0.1
0.0
0.0 –0.1 –0.2
–0.2 –0.2
–0.3
–0.08 –0.06 –0.04
–0.05 0.00 0.05
0.05 0.5
0.10
–0.05 –0.05
0.00 0.00
0.05 –0.02 0.00 0.02 0.04 0.06
Fig. 4Putative directional relationships between cancers and traits. For each cancer–trait pair identified as candidates to be related in a causal manner, the
plots show trait-specific effect sizes (beta coefficients) of the included genetic variants. Gray lines represent the relevant standard errors.aHDL and breast cancer. Trait-specific effect sizes for HDL and breast cancer are shown for SNPs associated with HDL levels (left) and breast cancer (right).
[image:7.595.88.517.51.492.2]cell-type-speci
fi
c enrichment for cancers to the additional 38
non-cancer traits revealed notably differential clustering patterns
(Supplementary Fig. 4). Breast, colorectal, and prostate cancer
showed enrichment mostly for adipose and epithelial tissues, in
contrast to autoimmune diseases (enriched for
immune/hemato-poietic cells) or psychiatric disorders (enriched for brain tissues).
Discussion
We performed a comprehensive analysis quantifying the
herit-ability and genetic correlation of six cancers, leveraging summary
statistics from the largest cancer GWAS conducted to date. Our
study demonstrates shared genetic components across multiple
cancer types. These results contrast with a prior study conducted
by Sampson et al. which reported an overall negligible genetic
correlation among common solid tumors
9. Our results are,
however, in line with a recent study,
16which analyzed a subset of
the data included here, and identi
fi
ed a signi
fi
cant genetic
cor-relation between lung and colorectal cancer.
Our data support, and for the
fi
rst time quantify, the strong
genetic correlation (
rg
=
0.57) between lung and head/neck
can-cer, two cancers linked to tobacco use
20,25. We also for the
fi
rst
time observed a signi
fi
cant genetic correlation between breast and
ovarian cancer (
rg
=
0.24), two cancers that are known to share
rare genetic factors including
BRCA1
/
2
mutations, and
environ-mental exposures associated with endogenous and exogenous
hormone exposures
26. Prostate cancer is also considered as
hormone-dependent and associated with
BRCA1/2
mutations, but
interestingly, we only observed a nominally signi
fi
cant and
modest (
rg
=
0.07) genetic correlation between breast and
pros-tate cancer, while ovarian and prospros-tate cancer showed no genetic
correlation (
rg
=
0.02, se
=
0.07).
Our large sample sizes allowed us to conduct well-powered
analyses for cancer subtypes. While head/neck cancer showed
negligible genetic correlation with overall (
rg
=
0.03, se
=
0.06)
and ER
+
breast cancer (
rg
=
−
0.02, se
=
0.07), it showed a
stronger genetic correlation with ER
−
breast cancer (
rg
=
0.21,
se
=
0.09). Similarly, lung cancer showed a statistically more
pronounced genetic correlation with ER
−
(
rg
=
0.29, se
=
0.06)
than ER
+
breast cancer (
rg
=
0.13, se
=
0.04). A recent pooled
analysis of smoking and breast cancer risk demonstrated a
smoking-related increased risk for ER
+
but not for ER
−
breast
cancer
27, and thus it is unlikely that the stronger genetic
corre-lation between ER
−
subtype and lung and head/neck cancer is
due to smoking behavior. Perhaps surprisingly, despite literature
suggesting substantial similarities between ER
−
breast cancer and
serous ovarian cancer in particular
28, we did not observe
statis-tically signi
fi
cant different genetic correlations between ER
−
or
ER
+
breast cancer and serous ovarian cancer (
rg
=
0.17, se
=
0.08
vs. rg
=
0.11, se
=
0.06). This suggests that rare high
pene-trance variants may play a more important role in driving the
similarities behind ER
−
breast cancer and serous ovarian cancer
than common genetic variation.
Heritability analysis con
fi
rms that common cancers have a
polygenic component that involves a large number of variants.
Although susceptibility variants identi
fi
ed at genome-wide
sig-ni
fi
cance explain an appreciable fraction of the heritability for
some cancers, we estimate that the majority of the polygenic effect
is attributable to other, yet undiscovered variants, presumably
with effects that are too weak to have been identi
fi
ed with current
sample sizes. We found the genetic component that could be
attributed to genome-wide signi
fi
cant loci varied greatly from
~0% for head/neck cancer to ~50% for breast and prostate cancer.
These results re
fl
ect in part the strong correlation between
number of GWAS-identi
fi
ed loci and sample size, as we had more
than twice as many breast and prostate cancer samples compared
to the other cancers. One corollary is that larger GWAS are likely
to identify new susceptibility loci that could help our
under-standing of disease development, improve prediction power of
genetic risk scores and hence contribute to screening and
per-sonalized risk prediction
29.
Among the genetic correlations between cancer and
non-cancer traits, we observed positive correlations for psychiatric
disorders (depressive symptoms, schizophrenia) with lung and
breast cancer, where
fi
ndings from epidemiological studies have
been suggestive but inconclusive. It has been proposed that the
linkage between psychiatric traits and cancers are more likely to
be mediated through cancer-associated risk phenotypes such as
smoking, excessive alcohol consumption in depressed
popula-tions
30, and reduced fertility patterns (e.g., nulliparous) in
psy-chiatric populations
31. Detailed analyses considering confounding
traits like reproductive history and smoking are needed to make
inference about the mechanisms involved. GWAS have identi
fi
ed
pleiotropic regions in
fl
uencing both lung cancer and nicotine
dependence, such as 15q25.1
32,33. In line with those results, we
identi
fi
ed a strong genetic correlation between smoking and both
lung (
rg
=
0.56) and head/neck cancer (
rg
=
0.47). It remains
unclear whether this genetic correlation is completely explained
by the direct in
fl
uence of smoking or if the shared genetic
com-ponent affects the traits through separate pathways. Interestingly,
a genetic correlation (
rg
=
0.35, se
=
0.14) between lung and
bladder cancer, another smoking-associated cancer, has been
identi
fi
ed previously
9. Due to the small numbers of
GWAS-identi
fi
ed smoking-associated SNPs, we were unable to assess a
directional correlation between smoking and cancer, but we
expect such analyses to become feasible as additional
smoking-related SNPs are identi
fi
ed. We found modest positive, yet
sig-ni
fi
cant genetic correlations between adiposity-related measures
(as re
fl
ected by waist-to-hip ratio, circulating HDL levels and
BMI) and both colorectal and lung cancer, but negative genetic
correlations between BMI and prostate and breast cancer,
con-sistent with previous reported
fi
ndings
34and reinforce the
com-plex dynamics between obesity and cancer where multiple factors
including age, smoking, endogenous hormones and reproductive
status play a role.
We did not observe genetic correlations between breast cancer
and age at menarche or age at natural menopause. These null
observations were largely driven by ER
+
breast cancer (ER
+
:
rg
=
0.006, se
=
0.03 vs. ER
−
:
rg
=
−
0.09, se
=
0.04 for age
at menarche. ER
+
:
rg
=
0.0005, se
=
0.04 vs. ER
−
:
rg
=
−
0.10,
se
=
0.05 for age at natural menopause), and were unexpected
given that both factors play pivotal roles in breast cancer
etiol-ogy
35and previous Mendelian randomization (MR) analyses have
[image:8.595.45.291.86.188.2]identi
fi
ed a link
36,37. An important difference between genetic
Table 1 Signi
fi
cant enrichment estimates of genomic
functional categories, meta-analyzed across six cancer sites
Category Enrichment (95% CI) P-value
Conserved region 9.78 (5.72–13.84) 2.28 × 10⁻⁵
TFBS 4.04 (2.91–5.17) 1.43 × 10⁻⁷
H3K9ac 3.41 (2.14–4.69) 2.04 × 10⁻⁴
H3K4me3 3.23 (2.47–4.00) 8.91 × 10⁻⁹
Super Enhancer 2.56 (2.23–2.89) 1.99 × 10⁻²⁰
H3K27ac (PGC) 2.36 (1.91–2.80) 2.12 × 10⁻⁹
H3K27ac (Hnisz) 1.90 (1.65–2.15) 1.86 × 10⁻¹²
H3K4me1 1.84 (1.56–2.12) 2.57 × 10⁻⁹
Repressed region 0.34 (0.07–0.61) 1.15 × 10⁻⁶
The meta-analysis was performed based on the enrichment estimates and standard errors calculated using LD score regression in each individual cancer type.P-values were significant after Bonferroni correction (P< 0.05/24)
10.0
7.5
5.0
2.5
0.0
10.0
7.5
5.0
2.5
0.0
10.0
7.5
5.0
2.5
0.0
10.0
7.5
5.0
2.5
0.0
10.0
7.5
5.0
2.5
0.0
10.0
7.5
5.0
2.5
0.0
–log10 (enr
ichment_
p
-v
alues)
Breast cancer
Colorectal cancer
Headneck cancer
Lung cancer
Ovarian cancer
Prostate cancer
3
′
UTR
5
′
UTR
Coding
CTCF
Conser
ved
DGF
DHS
Enhancer
F
ANT
OM5 enhancer
F
etal DHS
H3K27ac (Hnisz)
H3K27ac (PGC2)
H3K4me1
H3K4me3
H3K9ac
Intron
Promoter
Promoter flanking
Repressed
Super enhancer
W
eak enhancer
TFBS
TSS
T
ranscr
ibed
24_main_annotation
[image:9.595.56.546.45.628.2]correlation and MR analyses is that the latter only considers
genome-wide signi
fi
cant SNPs while the former incorporates the
entire genome. It is possible that a relatively small overlap in
strongly associated SNPs can result in signi
fi
cant MR results
despite low evidence of an overall genetic correlation. Indeed, the
directional genetic correlations we observed for age at natural
menopause, schizophrenia, and HDL with breast cancer, and for
lupus with prostate cancer, highlight again that although an
overall genetic correlation may be negligible, there can still be
genetic links between traits. It is important to note that we cannot
rule out unmeasured confounding, including the possibility that
these genetic variants affect an intermediate phenotype that is
pleiotropic for both target traits. Given the observational nature
of our data, these putative causal directions should be interpreted
with caution.
Pan-cancer tumor-based studies have demonstrated that
dif-ferent cancers are sometimes driven by similar somatic functional
events such as speci
fi
c copy number abnormalities and
mutations
38,39. Our enrichment results of germline genetic across
functional annotation data shed new light on the biological
mechanisms leading to cancer development. The more
pro-nounced enrichment identi
fi
ed for conserved regions compared
with coding regions provides evidence for the biological
impor-tance of the former, which has been shown to be true for multiple
traits
14,40. Even though the biochemical function of many
con-served regions remains uncharacterized, transcribed
ultra-conserved regions have been found to be frequently located at
fragile sites. Compared to normal cells, cancer cells have a unique
spectrum of transcribed ultra-conservative regions, suggesting
that variation in expression of these regions are involved in the
malignant process
41,42. These results bridge the link between
germline and somatic genetics in cancer development, which was
also observed in a recent breast cancer GWAS that has
demon-strated a strong overlap between target genes for GWAS hits and
somatic driver genes in breast tumors
43. We also found a
four-fold enrichment for transcription factor binding sites and a
three-fold enrichment for super-enhancers, consistent with prior
observations that breast cancer GWAS loci fall in enhancer
regions involved in distal regulation of target genes
43.
Cell-type-speci
fi
c analysis of histone marks demonstrated the importance of
tissue speci
fi
city, primarily for colorectal and breast cancer.
Further, our results suggest that immune cells are important for
ovarian and lung cancer whilst CNS is important to head/neck
cancer. Unfortunately, we did not have data on prostate-speci
fi
c
tissues, but we note that tissue-speci
fi
c enrichment of prostate
cancer heritability for epigenetic markers has been observed
previously
10. We note that generation of rich functional
anno-tation is ongoing and we expect to include additional
tissue-speci
fi
c functional elements in our future work.
Our study has several strengths. We were able to robustly
quantify pair-wise genetic correlations between multiple cancers
using the largest available cancer GWAS, comprising almost
600,000 samples across six major cancers and subtypes. We were
also able to systematically assess the genetic correlations between
cancer and 38 non-cancer traits. Notwithstanding the large
sample sizes, several limitations need to be acknowledged. We did
not have the sample sizes required to assess relevant cancer
subgroups including oropharyngeal cancer, clear cell, mucinous
and endometrioid ovarian cancer, or lung cancer among never
smokers (each with ~2000 cases). In addition, we did not have
access to GWAS summary statistics for pre- vs. post-menopausal
breast cancer. We were not able to consider all cancer risk factors
when selecting non-cancer traits, since some of the
well-established risk factors such as infection were either not
avail-able, showed no evidence of heritability or were not based on
adequate sample sizes for robust analyses. SNP-heritability varies
with minor allele frequency, linkage disequilibrium, and genotype
certainty; we note that approaches to estimate heritability
lever-aging GWAS data are constantly evolving. We also note that
estimate variability needs to be taken into account when
com-paring the SNP-heritability with the classical twin-heritability, in
particular for cancers with small sample sizes such as head/neck
cancer (SNP-heritability varied between 5
–
14% and
twin-heritability varied between 0
–
60%, although both point
esti-mates were 9%). Further, our data were based on GWAS
meta-analysis from multiple individual GWAS across European
ancestry populations from Europe, Australia and the US.
Intra-European ancestry differences are likely to be a source of bias.
However, since we limited our analysis to SNPs with MAF > 1%
and HapMap3 SNPs (which have proven to be well imputed
across European ancestry populations), we believe that any
population structure across cancers will have minimal effect on
our results. Finally, as more non-European and multi-ethnic
GWAS data become available, it is important to examine
trans-ethnic genetic correlation in cancer.
In conclusion, results from our comprehensive analysis of
heritability and genetic correlations across six cancer types
indi-cate that solid tumors arising from different tissues share
com-mon germline genetic in
fl
uences. Our results also demonstrate
evidence for common genetic risk sharing between cancers and
smoking, psychiatric, and metabolic traits. In addition, functional
components of the genome, particularly conserved and regulatory
regions, are signi
fi
cant contributors to cancer heritability across
multiple cancer types. Our results provide a basis and direction
for future cross-cancer studies aiming to further explore the
biological mechanisms underlying cancer development.
Methods
Studies and quality control. We used summary statistics from six cancer GWASs based on a total of 597,534 participants of European ancestry. Cancer-specific sample sizes were: breast cancer: 122,977 cases/105,974 controls; colorectal cancer: 36,948/30,864; head/neck cancer (oral and oropharyngeal cancers): 5452/5984; lung cancer: 29,266/56,450; ovarian cancer: 22,406/40,941; prostate cancer: 79,166/ 61,106. These data were generated through the joint efforts of multiple consortia. Details on study characteristics and subjects contributed to each cancer-specific GWAS summary dataset have been described elsewhere43–49. SNPs were imputed to the 1000 Genomes Project reference panel (1KGP) using a standardized protocol for all cancer types18. We included autosomal SNPs with a minor allele frequency (MAF) larger than 1% and present in HapMap3 (NSNPs=~1 million) because
those SNPs are usually well imputed in most studies (note that excluding sex chromosomes could reduce the overall heritability estimates). A brief overview of the quality control in each cancer dataset are presented in Supplementary Table 5. For some of the cancers, we further obtained summary statistics data on subtypes (ER+and ER−breast cancer; lung adenocarcinoma, and squamous cell
carci-noma; serous invasive ovarian cancer and advanced stage prostate cancer, defined as metastatic disease or Gleason score≥8 or PSA > 100 or prostate cancer death). Sample sizes and more details shown in Supplementary Table 1.
We additionally assembled European ancestry GWAS summary statistics from 38 traits, which spanned a wide range of phenotypes including anthropometric (e.g., height and body mass index (BMI)), psychiatric disorder (e.g., depressive symptoms and schizophrenia), and autoimmune disease (e.g., rheumatoid arthritis and celiac disease) (Supplementary Table 6). We calculated trait-specific SNP-heritability and restricted our analysis to traits with a heritable component (Supplementary Table 7)14. We removed the major histocompatibility complex (MHC) region from all analysis because of its unusual LD and genetic architecture.
Estimation of SNP-heritability and genetic correlation. We estimated the SNP-heritability due to genotyped and imputed SNPs (h2
g, the proportion of phenotypic
variance causally explained by common SNPs) of each cancer using LDSC15. Briefly, this method is based on the relationship between LD score andχ2-statistics:
E χ2j
h i
Njh
2 g
M ljþ1 ð1Þ
whereEhχ2jidenotes the expectedχ2-statistics for the association between the outcome and SNPj,Njis the study sample size available for SNPj,Mis the total
numbers of variants andljdenotes the LD score of SNPjdefined aslj¼
P
k
r2j
;k
SNP-heritability as defined in Yang et al.17. To estimateh2
g attributable to
undis-covered loci, we identified SNPs that were associated with a given cancer at genome-wide significance (p< 5 × 10⁻⁸) and removed all SNPs within (+/−)
500,000 base-pairs of those loci prior to calculation (number of regions (+/−
500 kb) for each cancer that reach the 5 × 10⁻⁸threshold and measures of effect
size are shown in Supplementary Data 1). We also converted the SNP-heritability from observed scale to liability scale by incorporating sample prevalence (P) and population prevalence (F) of each cancer:
h2liability¼h2observed
Fð1 FÞ
ϕðΦ 1ð ÞFÞ2 Fð1 FÞ
Pð1 PÞ ð2Þ
We subsequently calculated the genome-wide genetic correlations (rg) between
different cancers, and between cancers and non-cancer traits, using an algorithm14:
Eβjγj
h i
¼ ffiffiffiffiffiffiffiffiffiffiffi
N1N2
p r
g
M ljþ Nsr
ffiffiffiffiffiffiffiffiffiffiffi
N1N2
p ð3Þ
whereβjandγjare the effect sizes of SNPjon traits 1 and 2,rgis the genetic
covariance,Mis number of SNPs,N1andN2are the sample sizes for trait 1 and 2,
Nsis the number of overlapping samples,ris the phenotypic correlation in
overlapping samples andljis the LD score defined as above. For genetic correlation
between 6 cancers, the significance level is 0.05/15=0.003; for genetic correlation
between 6 cancers and 38 traits, the significance level is 0.05/(6 × 38)=0.0002.
Overall genetic correlations as estimated by LDSC are based on aggregated information across all variants in the genome. It is possible that even though two traits show negligible overall genetic correlation, there are specific regions in the genome that contribute to both traits. We therefore examined local genetic correlations between cancer pairs usingρ-HESS50, an algorithm which partitions the whole genome into 1703 regions based on LD-pattern of European populations and quantifies correlation between pairs of traits due to genetic variation restricted to these genomic regions. Local genetic correlation was considered statistically significant ifp< 0.05/1,703=2.9 × 10−5. In particular, we assessed the local genetic
correlations for previously reported pleiotropic regions18,51known to harbor SNPs affecting multiple cancers.
Directional genetic correlation analysis. In addition to the genetic correlation analysis, which reflects overall genetic overlaps, we also attempted to identify directions of potential genetic correlations using a subset of SNPs as proposed by Pickrell et al.52. The method adopts the following assumption: if a trait X influences trait Y, then SNPs influencing X should also influence Y, and the SNP-specific effect sizes for the two traits should be correlated. Further, since Y does not influence X, but could be influenced by mechanisms independent of X, genetic variants that influence Y do not necessarily influence X. Based on this assumption, the method proposes two causal models and two non-causal models; and calculates the relative likelihood ratio (LR) of the best non-causal model compared to the best causal model. We determined significant SNPs for each given cancer or trait in two independent ways, (1) LD pruned SNPs: we selected genome-wide significant (p< 5 × 10⁻⁸) SNPs and pruned on LD-pattern in the European populations in Phase1
of 1KGP; (2) posterior probability of association (PPA) SNPs: we used a method implemented in fgwas53, which splits the genome into independent blocks based on LD patterns in 1KGP and estimates the prior probability that any block contains an association. The model outputs posterior probability that the region contains a variant that influences the trait. We selected the lead SNP from each of the regions with a PPA of at least 0.9. We scanned through all pairs of cancers and traits to identify directional correlations. Only pairs of traits with evidence of directional correlations (LR comparing the best non-causal model over the best causal model < 0.05) and without evidence of heteroscedasticity (pleiotropic effects)54were reported as relatively more likely to exhibit mediated causation.
Functional partitioning of SNP-heritability. To assess the importance of specific functional annotations in SNP-heritability across cancers, we partitioned the cancer-specific heritability using stratified-LDSC14. This method partitions SNPs into functional categories and calculates category-specific enrichments based on the assumption that a category of SNPs is enriched for heritability if SNPs with high LD to that category have higherχ2statistics than SNPs with low LD to that category. The analysis was performed using two models14,24.
1. A full baseline-LD model including 24 publicly available annotations that are not specific to any cell type. When performing this model, we adjusted for MAF via MAF-stratified quantile-normalized LD score, and other LD-related annotations such as predicted allele age and recombination rate, as implemented by Gazal et al.24. Briefly, the 24 annotations included coding, 3′UTR and 5′UTR, promoter and intronic regions, obtained from UCSC Genome Browser and post-processed by Gusev et al.55; the histone marks mono-methylation (H3K4me1) and tri-methylation of histone H3 at lysine 4 (H3K4me3), acetylation of histone H3 at lysine 9 (H3K9ac) processed by Trynka et al.56–58and two versions of acetylation of histone H3 at lysine 27
(H3K27ac, one version processed by Hnisz et al.59, another used by the Psychiatric Genomics Consortium (PGC)60); open chromatin, as reflected by DNase I hypersensitivity sites (DHSs and fetal DHSs)55, obtained as a combination of ENCODE and Roadmap Epigenomics data, processed by Trynka et al.58; combined chromHMM and Segway predictions obtained from Hoffman et al.61, which make use of many annotations to produce a single partition of the genome into seven underlying chromatin states (The CCCTC-binding factor (CTCF), promoter-flanking, transcribed, transcription start site (TSS), strong enhancer, weak enhancer categories, and the repressed category); regions that are conserved in mammals, obtained from Lindblad-Toh et al.40and post-processed by Ward and Kellis62; super-enhancers, which are large clusters of highly active enhancers, obtained from Hnisz et al.59; FANTOM5 enhancers with balanced bi-directional capped transcripts identified using cap analysis of gene expression in the FANTOM5 panel of samples, obtained from Andersson et al.63; digital genomic footprint (DGF) and transcription factor binding site (TFBS) annotations obtained from ENCODE and post-processed by Gusev et al.55
2. In addition to the baseline-LD model, we also performed analyses using 220 cell-type-specific annotations for the four histone marks H3K4me1, H3K4me3, H3K9ac, and H3K27ac. Each cell-type-specific annotation corresponds to a histone mark in a single cell type (for example, H3K27ac in CD19 immune cells), and there were 220 such annotations in total. We further divided these 220 cell-type-specific annotations into 10 groups (adrenal and pancreas, central nervous system (CNS), cardiovascular, connective and bone, gastrointestinal, immune and hematopoietic, kidney, liver, skeletal muscle, and other) by taking a union of the cell-type-specific annotations within each group (for example, SNPs with any of the four histone modifications in any hematopoietic and immune cells were considered as one big category). When generating the cell-type-specific models, we added annotations individually to the baseline model, creating 220 separate models.
We performed a random-effects meta-analysis of the proportion of heritability over six cancers for each functional category. We set significance thresholds for individual annotations atp< 0.05/24 for baseline model and atp< 0.05/220 for cell-type-specific annotation.
Data availability
The datasets generated during and/or analyzed during the current study are available from the authors on request. Breast cancer: summary results for all variants are available athttp://bcac.ccge.medschl.cam.ac.uk/. Requests for further data should be made through the Data Access Coordination Committee (http:// bcac.ccge.medschl.cam.ac.uk/). Ovarian cancer: summary results are available from the Ovarian Cancer Association Consortium (OCAC) (http://ocac.ccge.medschl. cam.ac.uk/). Requests for further data can be made to the Data Access Coordi-nation Committee (http://cimba.ccge.medschl.cam.ac.uk/). Prostate cancer: sum-mary results are publicly available at the PRACTICAL website (http://practical.icr. ac.uk/blog/). Lung cancer: genotype data for lung cancer are available at the database of Genotypes and Phenotypes (dbGaP) under accession phs001273.v1.p1. Readers interested in obtaining a copy of the original data can do so by completing the proposal request form athttp://oncoarray.dartmouth.edu/. Head/neck cancer: genotype data for the oral and pharyngeal OncoArray study have been deposited at the database of Genotypes and Phenotypes (dbGaP) under accession phs001202.v1. p1. Colorectal cancer: genotype data have been deposited at the database of Genotypes and Phenotypes (dbGaP) under accession number phs001415.v1.p1 and phs001078.v1.p1.
Received: 30 July 2018 Accepted: 10 December 2018
References
1. Lichtenstein, P. et al. Environmental and heritable factors in the causation of cancer--analyses of cohorts of twins from Sweden, Denmark, and Finland.N. Engl. J. Med.343, 78–85 (2000).
2. Mucci, L. A. et al. Familial risk and heritability of cancer among twins in nordic countries.JAMA315, 68 (2016).
3. Polderman, T. J. C. et al. Meta-analysis of the heritability of human traits based onfifty years of twin studies.Nat. Genet.47, 702–709 (2015). 4. Amundadottir, L. T. et al. Cancer as a complex phenotype: pattern of
cancer distribution within and beyond the nuclear family.PLoS Med.1, e65 (2004).
5. Yu, H., Frank, C., Sundquist, J., Hemminki, A. & Hemminki, K. Common cancers share familial susceptibility: implications for cancer genetics and counselling.J. Med. Genet.54, 248–253 (2017).
7. Fehringer, G. et al. Cross-cancer genome-wide analysis of lung, ovary, breast, prostate, and colorectal cancer reveals novel pleiotropic associations.Cancer Res.76, 5103–5114 (2016).
8. Kar, S. P. et al. Genome-wide meta-analyses of breast, ovarian, and prostate cancer association studies identify multiple new susceptibility loci shared by at least two cancer types.Cancer Discov.6, 1052–1067 (2016).
9. Sampson, J. N. et al. Analysis of heritability and shared heritability based on genome-wide association studies for thirteen cancer types.J. Natl. Cancer Inst. 107, djv279 (2015).
10. Gusev, A. et al. Atlas of prostate cancer heritability in European and African-American men pinpoints tissue-specific regulation.Nat. Commun.7, 10979 (2016).
11. Jiao, S. et al. Estimating the heritability of colorectal cancer.Hum. Mol. Genet. 23, 3898–3905 (2014).
12. Lu, Y. et al. Most common‘sporadic’cancers have a significant germline genetic component.Hum. Mol. Genet.23, 6112–6118 (2014).
13. Yang, J., Lee, S. H., Goddard, M. E. & Visscher, P. M. GCTA: a tool for genome-wide complex trait analysis.Am. J. Hum. Genet.88, 76–82 (2011). 14. Finucane, H. K. et al. Partitioning heritability by functional annotation using
genome-wide association summary statistics.Nat. Genet.47, 1228–1235 (2015). 15. Bulik-Sullivan, B. K. et al. LD Score regression distinguishes confounding
from polygenicity in genome-wide association studies.Nat. Genet.47, 291–295 (2015).
16. Lindström, S. et al. Quantifying the genetic correlation between multiple cancer types.Cancer Epidemiol. Biomark. Prev.26, 1427–1435 (2017). 17. Yang, J. et al. Common SNPs explain a large proportion of the heritability for
human height.Nat. Genet.42, 565–569 (2010).
18. Amos, C. I. et al. The OncoArray Consortium: a network for understanding the genetic architecture of common cancers.Cancer Epidemiol. Biomark. Prev. 26, 126–135 (2017).
19. SMOKING and health. Joint report of the Study Group on Smoking and Health.Science125, 1129–1133 (1957).
20. Shaw, R. & Beasley, N. Aetiology and risk factors for head and neck cancer: United Kingdom National Multidisciplinary Guidelines.J. Laryngol. Otol.130, S9–S12 (2016).
21. Koene, R. J., Prizment, A. E., Blaes, A. & Konety, S. H. Shared risk factors in cardiovascular disease and cancer.Circulation133, 1104–1114 (2016). 22. Thompson, C. L. et al. Short duration of sleep increases risk of colorectal
adenoma.Cancer117, 841–847 (2011).
23. Sigurdardottir, L. G. et al. Sleep disruption among older men and risk of prostate cancer.Cancer Epidemiol. Prev. Biomark.22, 872–879 (2013). 24. Gazal, S. et al. Linkage disequilibrium-dependent architecture of human
complex traits shows action of negative selection.Nat. Genet.49, 1421–1427 (2017).
25. Field, R. W. & Withers, B. L. Occupational and environmental causes of lung cancer.Clin. Chest Med.33, 681–703 (2012).
26. Hulka, B. S. Epidemiologic analysis of breast and gynecologic cancers.Prog. Clin. Biol. Res.396, 17–29 (1997).
27. Gaudet, M. M. et al. Pooled analysis of active cigarette smoking and invasive breast cancer risk in 14 cohort studies.Int. J. Epidemiol.46, 881–893 (2017). 28. Cancer Genome Atlas Network. Comprehensive molecular portraits of human
breast tumours.Nature490, 61–70 (2012).
29. Maas, P. et al. Breast cancer risk from modifiable and nonmodifiable risk factors among white women in the United States.JAMA Oncol2, 1295–1302 (2016).
30. Nakaya, N. et al. Personality traits and cancer risk and survival based on finnish and swedish registry data.Am. J. Epidemiol.172, 377–385 (2010). 31. Oksbjerg Dalton, S., Munk Laursen, T., Mellemkjaer, L., Johansen, C. &
Mortensen, P. B. Schizophrenia and the risk for breast cancer.Schizophr. Res. 62, 89–92 (2003).
32. Hung, R. J. et al. A susceptibility locus for lung cancer maps to nicotinic acetylcholine receptor subunit genes on 15q25.Nature452, 633–637 (2008). 33. Amos, C. I. et al. Genome-wide association scan of tag SNPs identifies
a susceptibility locus for lung cancer at 15q25.1.Nat. Genet.40, 616–622 (2008).
34. Gao, C. et al. Mendelian randomization study of adiposity-related traits and risk of breast, ovarian, prostate, lung and colorectal cancer.Int. J. Epidemiol. 45, 896–908 (2016).
35. Collaborative Group on Hormonal Factors in Breast Cancer. Menarche, menopause, and breast cancer risk: individual participant meta-analysis, including 118 964 women with breast cancer from 117 epidemiological studies.Lancet Oncol.13, 1141–1151 (2012).
36. Day, F. R. et al. Large-scale genomic analyses link reproductive aging to hypothalamic signaling, breast cancer susceptibility and BRCA1-mediated DNA repair.Nat. Genet.47, 1294–1303 (2015).
37. Day, F. R. et al. Genomic analyses identify hundreds of variants associated with age at menarche and support a role for puberty timing in cancer risk. Nat. Genet.49, 834–841 (2017).
38. Zack, T. I. et al. Pan-cancer patterns of somatic copy number alteration.Nat. Genet.45, 1134–1140 (2013).
39. Ciriello, G. et al. Emerging landscape of oncogenic signatures across human cancers.Nat. Genet.45, 1127–1133 (2013).
40. Lindblad-Toh, K. et al. A high-resolution map of human evolutionary constraint using 29 mammals.Nature478, 476–482 (2011).
41. Calin, G. A. et al. Ultraconserved regions encoding ncRNAs are altered in human leukemias and carcinomas.Cancer Cell12, 215–229 (2007). 42. Peng, J. C., Shen, J. & Ran, Z. H. Transcribed ultraconserved region in human
cancers.RNA Biol.10, 1771–1777 (2013).
43. Michailidou, K. et al. Association analysis identifies 65 new breast cancer risk loci.Nature551, 92–94 (2017).
44. Milne, R. L. et al. Identification of ten variants associated with risk of estrogen-receptor-negative breast cancer.Nat. Genet.49, 1767–1778 (2017). 45. McKay, J. D. et al. Large-scale association analysis identifies new lung cancer
susceptibility loci and heterogeneity in genetic susceptibility across histological subtypes.Nat. Genet.49, 1126–1132 (2017).
46. Schmit, S. L. et al. Novel Common Genetic Susceptibility Loci for Colorectal Cancer.J. Natl. Cancer Inst.111, djy099 (2019).
47. Phelan, C. M. et al. Identification of 12 new susceptibility loci for different histotypes of epithelial ovarian cancer.Nat. Genet.49, 680–691 (2017). 48. Lesseur, C. et al. Genome-wide association analyses identify new susceptibility
loci for oral cavity and pharyngeal cancer.Nat. Genet.48, 1544–1550 (2016). 49. Schumacher, F. R. et al. Association analyses of more than 140,000 men
identify 63 new prostate cancer susceptibility loci.Nat. Genet.50, 928–936 (2018).
50. Shi, H., Mancuso, N., Spendlove, S. & Pasaniuc, B. Local genetic correlation gives insights into the shared genetic architecture of complex traits.Am. J. Hum. Genet.101, 737–751 (2017).
51. Sakoda, L. C., Jorgenson, E. & Witte, J. S. Turning of COGS moves forward findings for hormonally mediated cancers.Nat. Genet.45, 345–348 (2013). 52. Pickrell, J. K. et al. Detection and interpretation of shared genetic influences
on 42 human traits.Nat. Genet.48, 709–717 (2016).
53. Pickrell, J. K. Joint analysis of functional genomic data and genome-wide association studies of 18 human traits.Am. J. Hum. Genet.94, 559–573 (2014).
54. Bowden, J., Davey Smith, G. & Burgess, S. Mendelian randomization with invalid instruments: effect estimation and bias detection through Egger regression.Int. J. Epidemiol.44, 512–525 (2015).
55. Gusev, A. et al. Partitioning heritability of regulatory and cell-type-specific variants across 11 common diseases.Am. J. Hum. Genet.95, 535–552 (2014). 56. Roadmap Epigenomics Consortium. et al. Integrative analysis of 111 reference
human epigenomes.Nature518, 317–330 (2015).
57. ENCODE Project Consortium. An integrated encyclopedia of DNA elements in the human genome.Nature489, 57–74 (2012).
58. Trynka, G. et al. Chromatin marks identify critical cell types forfine mapping complex trait variants.Nat. Genet.45, 124–130 (2013).
59. Hnisz, D. et al. Super-enhancers in the control of cell identity and disease.Cell 155, 934–947 (2013).
60. Schizophrenia Working Group of the Psychiatric Genomics Consortium. Biological insights from 108 schizophrenia-associated genetic loci.Nature511, 421–427 (2014).
61. Hoffman, M. M. et al. Integrative annotation of chromatin elements from ENCODE data.Nucleic Acids Res.41, 827–841 (2013).
62. Ward, L. D. & Kellis, M. Evidence of abundant purifying selection in humans for recently acquired regulatory functions.Science337, 1675–1678 (2012). 63. Andersson, R. et al. An atlas of active enhancers across human cell types and
tissues.Nature507, 455–461 (2014).