PAPER
Diagnosis of Weibel instability evolution in the rear surface density
scale lengths of laser solid interactions via proton acceleration
G G Scott1,2
, C M Brenner1
, V Bagnoud3
, R J Clarke1
, B Gonzalez-Izquierdo2
, J S Green1
, R I Heathcote1
, H W Powell2
, D R Rusby1,2
, B Zielbauer3
, P McKenna1
and D Neely1,2
1 Central Laser Facility, STFC Rutherford Appleton Laboratory, Didcot, OX110QX, United Kingdom 2 Department of Physics SUPA, University of Strathclyde, Glasgow, G4 0NG, United Kingdom
3 PHELIX group, GSI Helmholtzzentrum für Schwerionenforschung GmbH, Darmstadt, D-64291, Germany
E-mail:[email protected]
Keywords:laser ion acceleration, Weibel instability, electron transport, fast ignition, laser plasma insability
Abstract
It is shown for the
fi
rst time that the spatial and temporal distribution of laser accelerated protons can
be used as a diagnostic of Weibel instability presence and evolution in the rear surface scale lengths of a
solid density target. Numerical modelling shows that when a fast electron beam is injected into a
decreasing density gradient on the target rear side, a magnetic instability is seeded with an evolution
which is strongly dependent on the density scale length. This is manifested in the acceleration of a
fi
lamented proton beam, where the degree of
fi
lamentation is also found to be dependent on the target
rear scale length. Furthermore, the energy dependent spatial distribution of the accelerated proton
beam is shown to provide information on the instability evolution on the picosecond timescale over
which the protons are accelerated. Experimentally, this is investigated by using a controlled prepulse
to introduce a target rear scale length, which is varied by altering the time delay with respect to the
main pulse, and similar trends are measured. This work is particularly pertinent to applications using
laser pulse durations of tens of picoseconds, or where a micron level density scale length is present on
the rear of a solid target, such as proton-driven fast ignition, as the resultant instability may affect the
uniformity of fuel energy coupling.
1. Introduction
A plethora of laser accelerated proton beam applications have been the subject of intense speculation since the target normal sheath acceleration mechanism heralded beams with unrivalled emittance, source bunch lengths and densities.
These highly laminar beams often have a uniform spatial distribution which is essential for picosecond probing of intense transientfields[1], and their high degree of focusability lends them to potential applications such as hadron therapy[2,3]and fast ignition[4], where the high currents of laser accelerated beams are uniquely capable of delivering the power densities required for the latter.
In theorised fast ignition scenarios, kilojoule level chirped pulse amplification systems are often envisaged with pulse durations of tens of picoseconds[4]to accelerate an ignitor ion beam. We report on experimental data where a double pulse interaction opens a new route to diagnosing instabilities in the acceleration dynamics that may be encountered on such systems, where pulse delays on the order of tens of picoseconds are introduced4. We observe that the laminarity of proton acceleration in this regime is reduced, through Weibel instability growth in the target rear scale lengths. This is diagnosed by afilamentation of the proton beam accelerated during interactions with 25μm gold and 45μm graphite foils.
OPEN ACCESS
RECEIVED
16 November 2016
REVISED
3 February 2017
ACCEPTED FOR PUBLICATION
7 March 2017
PUBLISHED
10 April 2017
Original content from this work may be used under the terms of theCreative Commons Attribution 3.0 licence.
Any further distribution of this work must maintain attribution to the author(s)and the title of the work, journal citation and DOI.
4
We note here, where the beams have an intensity ratio of 1:10, the temporal separation between them acts as a sample of a full width at tenth maximum(FWTM)of a Gaussian distribution, this is longer than the often quoted, full width at half maximum(FWHM), single pulse duration. The two values are related byFWTM=( (ln 10) ln 2( ))12FWHMorFWTM»1.8 FWHM. The quoted time delay can therefore
be considered to be a sample of the intensity profile of a shorter duration FWHM pulse.
Studies have consistently shown that the distribution of the laser accelerated proton beam is dependent on that of the laser driven hot electron population, and many mechanisms have been identified as being responsible for the electron beam itself gaining spatial structure.
Extensive numerical modelling and experimental studies have led to a powerfully predictive 3D hybrid model showing that low temperature plasma(10–100 eV)resistivity gradients can lead tofilamentation of the electron beam[5–7]. Using thefinal electron distribution at the target rear, a sheath expansion model[8]has been shown to accurately forecast the subsequently accelerated proton distribution, and this work established a precedent for using the accelerated proton beam spatial distribution as a diagnostic of fast electron transport physics within the target.
The underlying physics of this mechanism requires that targets of thickness in excess of 100μm, are required for the necessary longitudinal temperature gradients to exist for electrically non-conductive materials to enter a resistivity regime deviating from Spitzer or Lee-More[6]. To this end, the model predicts this mechanism should have little effect on metallic foils, and experimentally no attributable ion beam structure in metallic foils of up to 1 mm thick has been observed[9].
Metzkeset al[10]have reported on structured proton beams, using 1–2μm titanium foils, where a small preplasma, optimised for scale lengths of 0.1μm, on the target front was attributed to being the source of a Weibel instability similar in nature to that reported in a numerical study by Sentoku and Kemp[11].
Experimentally[10]a target thickness of 3–5μm, was established as a limit on the thickness through which this front surface seeding of electron beam structure would be transported to the target rear, as the proton beam is observed to return to a smooth spatial distribution.
In a series of experimental investigations into longer front surface preplasma scale lengths, ranging from 10s to 100sμm[12–14], no evidence has arisen to suggest that any front surface seeding of electron beam
filamentation is transported through 5–25μm copper targets. Here the proton beams were shown to be featureless and smoothest for the largest scale length preplasma conditions. In a closely related numerical investigation of these experimental parameters[15,16]it was found that at the largest scale lengths, the incident laserfilaments in the preplasma. This explains the observed reduction in maximum proton energy, but is observed to have no effect on the proton beam structure, even when it has been shown that electron beams can attain structre due to front surface illumination nonuniformities[17].
Tatarakiset al[18]have shown experimentally, that a Weibel instability can result from driving a dense electron population through a low density plasma. Wefind a similar phenomenon in the rear surface scale lengths of solid targets and measure the effects on the laser accelerated protons for thefirst time. In the context of the experimental results presented here, the scale length is understood to emanate from the bulk target
expansion initiated by the heating of the target foil by the controlled prepulse, and longer scale lengths therefore correspond to longer pulse delays. A detailed discussion of the relation between these parameters will be presented in section4.2.
In previous studies, the picosecond evolution of the Weibel instability has not been explored, which is an important time frame for many high power laser systems and for ion acceleration. We present numerical results, showing how the evolution varies as a function of scale length on the picosecond time frame, and present experimental evidence that the time history of this evolution is mapped onto the accelerated proton beam.
As well as being an important consideration for ion acceleration using tens of picosecond pulses, the mapping of structure onto the proton beam presents a novel method for diagnosing the onset of the Weibel instability at near solid density, an environment not easily probed by optical methods.
2. Experimental details
2.1. Methods
The experiment was carried out on the PHELIX laser at the GSI facility[19]. The s-polarised, 1.054μm wavelength, 500 fs FWHM laser pulses were delivered to foil targets with an f/9 off-axis parabola and focused to a20´15 mm spot at a34◦angle of incidence. An ultrashort optical parametric amplification module was used in the front end of the laser, offering an intensity contrast ratio of 109on the nanosecond timescale[20].
A double pulse was generated via the same module described in previous work, which investigated the optimisation of plasma mirror reflectivity[21], delivering a prepulse to main pulse energy of 1:10 and with variable delay of up to 100 ps. In total, 72±2 J of laser energy was delivered on target for the shots considered here, giving an average focused main pulse intensity of4´10 W cm18 -2. The accelerated proton beam spatial intensity distribution was recorded using51 ´51 mmpieces of HDv2 radiochromicfilm, arranged in a stack configuration for energy discrimination, and positioned 51 mm from the target rear.
Graphite foils of thickness 45μm were used, where a comprehensive scan was obtained, varying the inter pulse temporal separation between 0 ps(single pulse)and 100 ps. As well as this, shots were taken on a
combination of gold foils of thickness 5 and 25μm, which is a more sparsely populated data set, but important for our identification of the physical mechanism at work.
2.2. Results
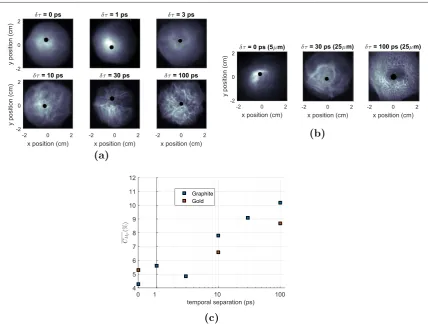
Infigures1(a)and(b), the 2D proton spatio-dose distributions are shown for various inter pulse time delays. Qualitatively, it is clear that the beam changes from a smooth centrally peaked profile, for inter pulse time delays in the region of 0–3 ps to a beam that shows a high degree offilamentation within the envelope for longer time delays.
To quantify the degree offilamentation within the beam, the method used by MacLellanet al[8]is employed, where the mean coefficient of variation,CMP, represents as a percentage, the radially averaged standard deviation
in proton dose divided by the radially averaged dose. This measurement allows the degree of disorder in the beam to be quantified as a function of its radius, and as wefind this to be quasi-constant, we take the average value of this function,CMP, to represent the degree of disorder in the beam measured at a given proton energy.
This is shown infigure1(c)and indicates that the degree of disorder in the beam tends to increase as the inter pulse time delay increases, for both45 mm graphite foils and 25μm gold foils.
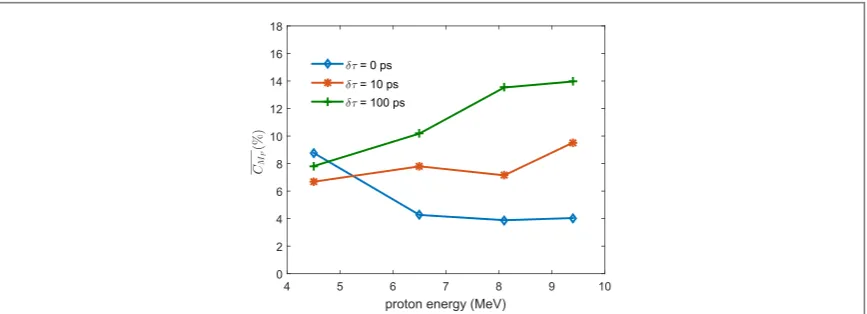
By examining the degree of structure in the proton beam as a function of energy, we examine its evolution, as higher energy protons are accelerated at early time when the target rear surface electricfield is at its peak and lower energy protons are accelerated later in time as the acceleratingfield slowly decays. This data is shown in
figure2.
[image:3.595.121.550.60.389.2]From this plot it may be inferred that the nature of the phenomenon which causes the structure has different time histories for each inter pulse time delay. In the case of 0 ps delay, no substructure is observed in the beam envelope, and the trend in disorder decreasing with higher proton energy informs us on changes in the global spatial distribution at each energy, as a reference case. For the other delays shown, the disorder increases as a result of the substructure within the beam envelope. Comparing the two longer inter pulse time delays, a large degree of substructure is imprinted on the beam at high energy, and maintains this high degree of disorder from early time. The 10ps case however shows a degree less structure than the 100 ps data. This provides strong
Figure 1.The dose maps retrieved for 6.5 MeV protons, as measured on the RCF stack, from interactions with(a)45μm graphite foils
evidence that there is an evolutionary difference in the mechanism causing the structure, on the same time scale as the ion acceleration mechanism.
3. Numerical modelling
3.1. Two dimensional particle in cell
To investigate the effects of rear surface scale lengths on the interaction dynamics, 2D particle in cell modelling was carried out using the EPOCH code[22]. Here a 500 fs, FWHM Gaussian laser pulse propagates in the positivex-direction, centred on they-axis with a spot width of 7μm. The simulation box dimensions were 63(x)
μm×24(y)μm, with a grid resolution of 40 cells per micron.
The laser interacts with a target of maximum electron density of 50 times the critical density, spanning a thickness of 3μm in thexdirection. The collisionless target is composed of a mixture of ions of charge to mass ratio, 1 and 1
12, representing the contaminant hydrogen layer and bulk target carbon ions, present in a ratio of 1:9 respectively and is quasi-neutralised by electrons with an initial 500 eV temperature. Each species is represented by 100 macroparticles per cell. A scale length of the formne;i=ne0;i0exp(-x lss)is introduced on the target
rear surface at x=0 mm .
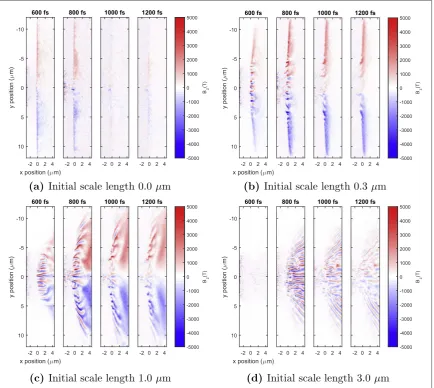
The effect of a range of plasma scale lengths from 0.0μm(plane foil)to 3.0μm are shown infigure3. Broadly it is observed that in the presence of longer scale length plasmas, magneticfields build to a similar peak strength as is also shown infigures4(a)and(b), however the length of thefilaments and their lifetime are found to be dependent on the scale length of the plasma, with longer scale length plasmas hosting larger scale and longer livedfilamentation of thefields, as shown infigure3and quantified infigure4(c).
The mechanism by which the Weibel instability evolves is consistent with that described by Silvaet al[23], where the background electron density has a pivotal role. Equation(1)expresses the plasma condition for Weibel instability growth derived by Silvaet alin terms of the simulation parameters, for a hot electron beam of number density,nb, with momenta components,px y, , and Lorentz factor,gb, propagating through a
background plasma density,ne.
g > ⎛
⎝
⎜ ⎞
⎠
⎟ ( )
n n
p
p . 1
y
x
b
e b
2
In the case of the 3.0μm rear surface scale length, a clearfilamentation of the relativistic electrons isfirst observed at a time of 650 fs, soon after the peak of the pulse interacts with the target, with peak electron beam densities around the critical density being injected into the target. The electrons have an exponential spectra, but on average are found to have a Lorentz factor in the region of 1.5–2.0, which is consistent with the
ponderomotive potential and these electrons have an average momentum ratio,p
p
y
x
[image:4.595.120.554.61.218.2], of approximately 0.3. The result is that an Weibel instability can be seeded at a background plasma density of around 7 times the critical density. However, the instability is dynamic, and the generation of magneticfields at low density quickly leads to the evolution of magneticfields at higher densities as the incoming beam is pinched by the magneticfields to higher densities, raising the background plasma density that the condition is satisfied for. Coupled with the energy spread of the beam, and the temporally evolving number density injected, many regions of the plasma can
Figure 2.Structure in the beam as a function of proton energy for inter pulse time delays of 0, 10 and 100ps from interactions with 45μm graphite foils.
simultaneously satisfy the condition for Weibel instability growth, and this is the basis for the magneticfield channel length.
Locally, thefields reach similar maximum values, around 1.5–3.0 kT, and a lineout across thefields is shown infigures4(a)and(b)saturating when thefield satisfies the gyrotron frequency of the relativistic electrons.
[image:5.595.120.555.62.450.2]In the vicinity of the instability, the ratio of magnetic pressure to the thermal pressure of the plasma,β, is less than unity. The resultant pressure prevents the magnetic channels from collapsing, and instead forces it to disperse over time.
Figure 3.The magneticfield,Bz, evolution for a selection of plasmas with a density scale length on the rear of the target, fromx=0.
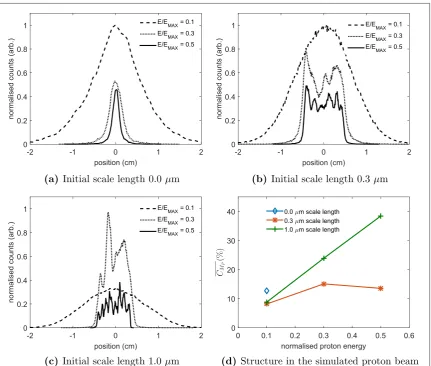
[image:5.595.123.553.499.634.2]The resultant distribution of the accelerated proton beam in the PIC modelling was calculated by using each particle position and momenta and interpolating its trajectory to a detector plane, 51 mm from the nominal target rear surface. The distributions are shown infigure5, where the proton energies are normalised to the maximum energy recorded in the simulation of a 1μm scale length plasma.
Qualitatively, the key trends experimentally measured ofCMP as a function of scale length infigure1(c)and
proton energy infigure2are reproduced. When no scale length is initially present, a smooth distribution is obtained for three sample energies and the beam is observed to have a larger number of protons at lower energies, as typically observed in TNSA experiments and models.
When a0.3 mm scale length is introduced, significant density perturbations are observed in the higher energy proton beam and is caused by thefilamentation of the fast electron beam. However, the lower energy beam is smooth in nature, which is accelerated at late time when the magneticfields have decayed.
We note that ion acceleration from a non zero density scale length can be complex[24–26,27], however, in general the time taken for the completion of the ion acceleration becomes longer with increasing density scale length. Here, the increased acceleration time is consistent with the breaking time given by Grismayer and Mora
[24]. This forecasts that the acceleration from a0.3 mm plasma scale length will require around 2.5 times longer than a zero density scale length plasma, which itself has a typical acceleration time empirically found to be around 1.3 times the laser pulse duration[28]. This corresponds to a global simulation time of around 1.9 ps in the0.3 mm case, while the strongfilamentary structure in the magneticfield is observed to have faded at an earlier time of around 1.0 ps, and so the lower energy protons are not affected by these structures as they are accelerated toward the end of this time window.
[image:6.595.122.554.59.425.2]For a longer scale length of 1.0μm, a similar degree offilamentation in the proton beam is observed at intermediate and low energy, while the high energy beam isfilamented to a greater degree than for the shorter plasma scale length. In this instance, the proton acceleration is expected to take just over six times as long as the zero density scale length case, corresponding to a time of around 4.4 ps in this simulation. This longer
Figure 5.(a)–(c)The proton number as a function of position at the detector plane, as projected from their position and momenta in PIC simulations at a time of 3.8 ps.(d)The structure in the beam as a function of proton energy for the three scale lengths is also presented.
acceleration time explains the deviation of the number of accelerated protons from the exponential distribution expected, as the ion acceleration process has not quitefinished.
In the3.0 mm scale length case, the acceleration time is estimated to be around 12 ps, and the ion energies are observed to be much lower than in other simulations after 3.8 ps. For this reason a detailed comparison at similar energies is not possible, and is therefore not presented.
To quantify the degree of structure in the simulated proton beam, a similar method to that used on the RCF stacks was used, but as the projected proton beam profile is two dimensional, no radial averaging takes place. The averaged coefficient of variation across the central 20, 10 and 8 mm of the beam is shown for normalised proton energies of 0.1, 0.3 and 0.5 respectively infigure5(d).
For all scale lengths investigated, an approximately Gaussian beam is obtained for the lowest energy component, and this yields a small averaged coefficient of variation,CMP, at low energies in good agreement
with the values obtained infigure2. The higher energy component of the zero scale length component also forms a smooth beam, but with a profile not in agreement with the experimental results, which are better
approximated by a parabolic or top-hat envelope, which is observed for the other simulated profiles. In absence of a similar global profile, the evaluation ofCMP, reflects changes in the global structure of the beam rather than
the substructure of the beam that we aim to examine, and so results for the higher energy components are omitted.
Qualitatively, good agreement in the trends observed in the experimental data are reproduced, where a 0.3μm scale length plasma produces a beam with an approximately constantCMP as observed in the 10 ps delay
experimental data set, and the 1.0μm scale length plasma produces a beam withCMP steadily increasing as a
function of energy, as observed in the 100 ps delay experimental data set.
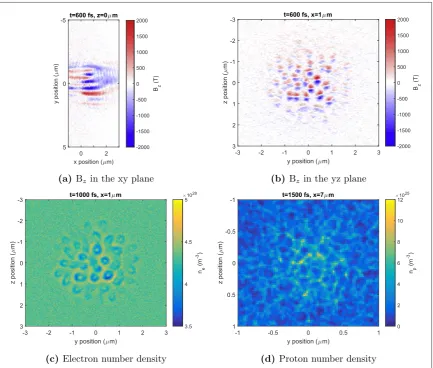
3.2. Three dimensional particle in cell
To investigate the stability of this mechanism in three dimensions, the EPOCH code was again used, with a box of dimensions 13(x)μm×10(y)μm×10(z)μm, with 20(x)and 40(y,z)cells per micron, where the plasma had the same densities and composition as in the 2D simulations, with 25 particles per cell and a laser spot size of 1.8μm.
When a 1μm scale length was investigated, the same magneticfield structures observed in 2D modelling are found in thexymidplane, shown infigure6(a). The structure of thesefields can be examined in the acceleration
(yz)plane and this is shown infigure6(b). Once again, as the plasma pressure mainly prevents the collapse of electrons into the magneticfield structure, the electrons form circular structures, with voids and higher density regions. Similar structures to this in the electron distribution have been shown to lead tofilamentation of the accelerated proton beam[6]. While modelling the ion acceleration until its conclusion would be
computationally expensive for our purposes, the beam obtained at the end of the simulation, shown in
figure6(d), shows some degree offilamentation similar to that observed experimentally, with an angular web like structure in the proton number density emerging in the density map, which are qualitatively similar to those observed in experiment.
4. Discussion
4.1. General discussion
Evidence has been presented for the case that a Weibel instability in a rear surface plasma density gradient is the source of afilamented proton beam observed in experiment.
Numerical modelling shows that increasing the rear surface plasma scale length changes the Weibel
instability evolution in two important ways. Firstly, it is shown that a scale length is required for the instability to be seeded, and that the size of the scale length determines thefilament length in the rear surface plasma. The
filamentation of fast electrons via the Weibel instability results in afilamentation of the proton beam during the ion acceleration phase, which is both experimentally measured and predicted by PIC simulations. By controlling the inter pulse time delay in the experiment, we therefore control the plasma scale length into which the hot electrons are injected, and whether the Weibel instability is present or not.
Secondly, the length of thefilaments is the basis for the stability of the magneticfield and for its lifetime, leading to longer density scale lengths hosting magneticfieldfilaments for longer time. The result of this is that the fast electrons remainfilamented for longer times in the acceleration phase, and that the degree of structure mapped to the proton beam varies as a function of proton energy. This is once again measured clearly in the experimental results, where longer delays between the pulses led to a higher degree of structure being mapped onto lower energy protons, as shown infigure2and qualitatively reproduced from 2D PIC simulations in
No experimental measurements were made of the scale lengths, however the development of a scale length of 0.3μm at times greater than 3 ps is consistent with that expected for a self similar expansion of≈300–400 eV fully ionised carbon, which could be considered a conservative estimate of the bulk target conditions initiated by the controlled prepulse, as will be discussed in section4.2.
A gold target would be unlikely to be fully ionised, and therefore a slower expansion than the carbon target could be expected, with shorter density scale lengths for the same plasma temperature, andfigure1(c)appears to agree with this hypothesis, showing a slower onset of structure in the beam with inter pulse time delay.
This effect could be potentially important for high energy multi picosecond systems, like those envisaged for fast ignition experiments, where uniformly heating a hot spot is of key importance and this work demonstrates that on these time scales, ion beam and electron beam uniformity is affected by the existence of such scale lengths.
In general, ion based fast ignition experiments could conceivably involve some degree of plasma scale length on the rear of the ignitor beam target, preheated by x-rays produced from the primary fuel compression stage, making this work relevant not only to 10 s of picosecond ignitor beams.
4.2. Discussion of the experimental scale length estimation
A precise estimation of the target rear expansion velocity, and hence the target rear scale length evolution, is not trivial, as to our knowledge there an no dedicated studies in the literature on the scaling of this parameter when only the front side of the target is irradiated, although passing references to the phenomenon have been made[29].
[image:8.595.120.554.60.428.2]However, to relate the experimental data to the scale lengths in the numerical investigation, we discuss this in further detail, and draw from various sources. Although the prepulse intensity is a little higher than could be considered for a purely collisional heating model, the scaling of Gibbon’s analytic expression[30]of the collisional skin heating model by Rozmus and Tikhonchuk[31]yields a plasma temperature in the region of 1.8 keV, whilst a 2D collisional PIC model of parameters very close to that reported for the prepulse in this work,
Figure 6.The magneticfield evolution in 3D PIC simulations and its influence on the electron and proton density distributions in the acceleration plane.
by Sentokuet al[32]predict a front surface temperature of approximately 3–4 keV. These compare with the experimentally measured peak temperatures of 1.5 keV in the laser spot irradiated area on the front surface, with peak intensities slightly higher than those reported here at 2´1018W cm-2[33].
In a separate study with hybrid PIC modelling[6], the bulk electron temperature was found to fall to around 10% of the front surface value over the thickness of the carbon foils used in this study, when heated by an injected electron beam. Combining this with the discussed range of possible front surface plasma temperatures would imply a rear surface temperature range of 150–400 eV.
Further than this, in a recently developed technique by Bocoumet al[34], it is found that a hundreds of eV temperature plasma expands with a constant sound speed at the critical surface, for measured times of up to 30ps.
For fully ionised carbon, this temperature range would infer scale lengths of 0.25–0.42μm at a time of 3ps, growing linearly up until at least a time of 30ps, where they would reach 2.5–4.2μm.
It is reasonable to expect that the front surface preplasma evolves due to a self similar expansion driven by the hotter plasma temperature there, and in the case of the work on the 45μm carbon foils have an expansion of around three times faster than at the back surface, owing to the Tescaling. This would infer maximum front surface scale lengths in the region of 1.3–13μm at 3–30 ps, and potentially up to 40μm scale lengths at times of up to 100 ps.
4.3. Discussion of possible front surface sources offilamentation
We have shown that micron scale lengths are capable of hosting large Weibel instabilities, and this instability could theoretically form in the front surface scale lengths of the interaction, a phenomenon not included in the numerical modelling here. Whilst the condition for Weibel instability growth will be satisfied in the lower density preplasma, at sufficiently large background plasma densities, especially in the experimental case, where the background plasma densities can reach up to 500 times the critical density, the condition is not satisfied, leading to ballistic electron transport through the target. To determine whether a front surface seeded structure could be ballistically transported through the bulk target, we consider afilamented electron beam with an average periodicity ofa¯and momentapx y,. The distance they must travel in thexdirection such that the neighbouringfilaments overlap,d, is:
= ¯ ( ) ( )
d a P
P . 2
x
y
If the target thickness is greater thand, it can be considered too thick for thefilamentary structure to be transported through the bulk. From 2D PIC modelling on the target rear, these quantities could be expected to take of value ofa¯=250 nmandp py x=1 3, and this gives a threshold thickness of»800 nm which is very much smaller than the typical target thickness used in this study.
Scale lengths of 10–40μm, predicted to be present on the target front surface for the longest time delays have been subject to experimental and numerical investigation[12–16], where it has been found that these scale lengths are not long enough for self focussing effects to lead to laser beamfilamentation, allowing us to conclude that this effect has no role in any front surface seeding of structure in the electron beam.
Acknowledgments
The authors gratefully acknowledge the expert assistance of the PHELIX operations team. GGS would like to thank Professor Robert Bingham for useful discussions in the preparation of this work. We also gratefully acknowledge funding from EPSRC grant numbers EP/J003832/1, EP/K022415/1 and the European Union’s Horizon 2020 research and innovation programme, grant agreement no. 654148 Laserlab-Europe. The EPOCH code used in this research was developed under EPSRC grants EP/G054940/1, EP/G055165/1 and EP/ G056803/1 and computing resources were provided by STFC Scientific Computing Department’s SCARF cluster. Data associated with research published in this paper can be accessed at:https://doi.org/10.15129/ 73a487ce-afaf-4ee7-95ac-124d97390921.
References
[1]Romagnani Let al2015 Dynamics of electricfields driving the laser acceleration of multi-MeV protonsPhys. Rev. Lett.95195001
[2]Bulanov S Vet al2002 Oncological hadrontherapy with laser ion acceleratorsPhys. Lett.A299240
[3]Linz U and Alonso J 2007 What will it take for laser driven proton accelerators to be applied to tumor therapy?Phys. Rev. Spec. Top.—
Accelerators Beams10094801
[4]Roth Met al2001 Fast ignition by intense laser-accelerated proton beamsPhys. Rev. Lett.86031–9007
[6]MacLellan D Aet al2013 Annular fast electron transport in silicon arising from low-temperature resistivityPhys. Rev. Lett.111095001
[7]Dance R Jet al2015 Role of lattice structure and low temperature resistivity in fast-electron-beamfilamentation in carbonPlasma Phys. Control. Fusion58014027
[8]MacLellan D Aet al2013 Fast electron transport patterns in intense laser-irradiated solids diagnosed by modeling measured multi-MeV proton beamsPhys. Rev. Lett.31475
[9]Quinn M Net al2011 On the investigation of fast electron beamfilamentation in laser-irradiated solid targets using multi-MeV proton emissionPlasma Phys. Control. Fusion530124012
[10]Metzkes Jet al2014 Experimental observation of transverse modulations in laser-driven proton beamsNew J. Phys.16023008
[11]Sentoku Y and Kemp A J 2008 Numerical methods for particle simulations at extreme densities and temperatures: weighted particles, relativistic collisions and reduced currentsJ. Comput. Phys.2276846
[12]Carroll D Cet al2007 Active manipulation of the spatial energy distribution of laser accelerated proton beamsPhys. Rev.E76065401
[13]McKenna Pet al2008 Effects of front surface plasma expansion on proton acceleration in ultraintense laser irradiation of foil targets
Laser Part. Beams26591
[14]Carroll D C 2008 Laser-driven ion acceleration: source optimisation and optical controlPhD ThesisUniversity of Strathclyde
[15]Gray R J 2012 On mechanisms of laser-coupling to fast electrons in ultaintense laser-solid interactionsPhD ThesisUniversity of Strathclyde
[16]Gray R Jet al2014 Laser pulse propagation and enhanced energy coupling to fast electrons in dense plasma gradientsNew J. Phys.16 113075
[17]Quin M N 2008 Spatial intensity mapping of petawatt laser focus into fast electron transportPlasma Physics Annual ReportCentral Laser Facility pp 60–2
[18]Tatarakis M 2003 Propagation instabilities of high-intensity laser-produced electron beamsPhys. Rev. Lett.90175001
[19]Bagnoud Vet al2010 Commissioning and early experiments of the PHELIX facilityAppl. Phys.B100137
[20]Wagner Fet al2013 Temporal contrast control at the PHELIX petawatt laser facility by means of tunable sub-picosecond optical parametric amplificationAppl. Phys.B116429
[21]Scott G Get al2015 Optimisation of plasma mirror reflectivity and optical quality using double laser pulsesNew J. Phys.17033027
[22]Arber T Det al2015 Contemporary particle-in-cell approach to laser-plasma modellingPlasma Phys. Control. Fusion57113001
[23]Silva L Oet al2002 On the role of the purely transverse Weibel instability in fast ignitor scenariosPhys. Plasmas92458
[24]Grismayer T and Mora P 2006 Influence of afinite initial ion density gradient on plasma expansion into a vacuumPhys. Plasmas13 032103
[25]Kaluza Met al2004 Influence of laser prepulse on proton acceleration in thin-foil experimentsPhys. Rev. Lett.93045003
[26]Fuchs Jet al2007 Laser-foil acceleration of high-energy protons in small-scale plasma gradientsPhys. Rev. Lett.76065401R
[27]Lundh Oet al2007 Influence of shock waves on laser-driven proton accelerationPhys. Rev.E76026404
[28]Fuchs Jet al2006 Laser-driven proton scaling laws and new paths towards energy increaseNat. Phys.248
[29]Esirkepov T Zet al2014 Prepulse and amplified spontaneous emission effects on the interaction of a petawatt class laser with solid targetsNucl. Instrum. Methods Phys. Res.A745150
[30]Gibbon P 2005Short Pulse Laser Interactions with Matter: An Introduction(London: Imperial College Press)
[31]Rozmus W and Tikhonchuk V T 1990 Skin effect and interaction of short laser pulses with dense plasmaPhys. Rev.A427401
[32]Sentoku Yet al2007 Isochoric heating in heterogeneous solid targets with ultrashort laser pulsesPhys. Plasmas140122791
[33]Audebert Pet al2002 Heating of thin foils with a relativistic-intensity short pulse laserPhys. Rev. Lett.89265001
[34]Bocoum Met al2015 Spatial-domain interferometer for measuring plasma mirror expansionOpt. Lett.403009