City, University of London Institutional Repository
Citation
:
Gillespie-Gallery, H. (2015). Spatial and temporal aspects of visual performance in relation to light level and normal aging. (Unpublished Doctoral thesis, City University London)This is the accepted version of the paper.
This version of the publication may differ from the final published
version.
Permanent repository link:
http://openaccess.city.ac.uk/13520/Link to published version
:
Copyright and reuse:
City Research Online aims to make research
outputs of City, University of London available to a wider audience.
Copyright and Moral Rights remain with the author(s) and/or copyright
holders. URLs from City Research Online may be freely distributed and
linked to.
Spatial and temporal aspects
of visual performance in
relation to light level and
normal aging
Hanna Gillespie-Gallery
Doctor of Philosophy
Division of Optometry and Visual Science
THE FOLLOWING PARTS OF THIS THESIS HAVE BEEN REDACTED
FOR COPYRIGHT REASONS:
Our lives at times seem a study in contrast... love hate, birth death,
right wrong... everything seen in absolutes of black white. Too often we
are not aware that it is the shades of grey that add depth meaning to
the starkness of those extremes.
Contents
Contents ... 3
List of tables ... 10
List of figures ... 11
Acknowledgements ... 21
Declaration ... 22
Abstract ... 23
Abbreviations and symbols ... 24
1. The visual system ... 25
1.1. The structure of the human eye ... 26
1.2. The cornea and sclera ... 27
1.3. The pupil ... 27
1.4. The lens ... 28
1.5. The retina ... 28
1.5.1. Anatomy of the retina ... 28
1.5.2. The macula and fovea ... 30
1.5.3. Photoreceptors ... 31
1.5.4. Post-receptoral retinal pathways ... 34
1.6. Post-retinal visual processing ... 36
1.6.1. The lateral geniculate nucleus (LGN) ... 36
1.7. The aging human visual system ... 40
1.7.1. Light scatter and absorption in the eye; the role of aging ... 41
1.7.2. Pupil miosis ... 44
1.7.3. Ocular aberrations ... 45
1.7.4. Presbyopia ... 47
1.7.5. Aging of the retina ... 48
1.7.6. Cellular aging in central visual pathways ... 50
1.7.7. Age related macular degeneration ... 52
1.8. Spatial, temporal and chromatic visual perception ... 54
1.8.1. Spatial vision ... 54
1.8.2. Temporal vision ... 60
1.8.3. Colour vision ... 64
1.9. Aims and objectives ... 68
2. Spatial contrast thresholds in photopic and mesopic conditions; separating normal aging from disease ... 69
2.1. Loss of spatial vision in aging and retinal disease ... 69
2.1.1. Contrast vision and aging ... 69
2.1.2. Loss of contrast sensitivity in retinal disease ... 73
2.1.3. Vision at low luminance levels in aging ... 76
2.1.4. Vision at low luminances in AMD ... 80
2.2. Changes to binocular summation in aging ... 85
2.2.2. Aging and binocular summation ... 88
2.2.3. Binocular summation variation with eccentricity ... 90
2.2.4. Binocular summation at low light levels ... 90
2.3. Aims and objectives of the contrast and luminance study ... 91
2.4. Methods ... 93
2.4.1. Participants ... 93
2.4.2. Contrast sensitivity assessment ... 93
2.4.3. Estimates of lens optical density ... 97
2.4.4. Pupil measurements ... 97
2.4.5. Estimating retinal illuminance ... 98
2.4.6. Calculating HRindex for contrast sensitivity ... 98
2.4.7. Identifying participants with significantly elevated contrast thresholds . 99 2.4.8. Calculating binocular summation ratio (BSR) and interocular percentage increase (IPI) ... 100
2.4.9. Statistical analysis ... 101
2.5. Results ... 102
2.5.1. Identification of outliers ... 102
2.5.2. Pupil size and age ... 103
2.5.3. Contrast vision and the HRindex ... 104
2.5.3. Binocular summation of contrast vision ... 113
2.6. Discussion ... 116
2.6.2. Binocular summation of contrast signals ... 118
2.7. Conclusions ... 119
3. Aging of temporal contrast sensitivity in the retina at mesopic and photopic luminances; separating normal aging from disease ... 121
3.1. Temporal contrast sensitivity changes in aging and disease ... 121
3.1.1 Temporal contrast sensitivity changes in normal aging ... 122
3.1.2 Temporal contrast sensitivity changes and retinal disease ... 124
3.1.3. Mechanisms for reduced temporal contrast sensitivity ... 127
3.2. Rod-cone interactions in flicker ... 129
3.3. Binocular summation of modulation flicker ... 130
3.4. Aims and objectives of the flicker and luminance study ... 131
3.5. Methods ... 132
3.5.1. Participants ... 132
3.5.2. Rapid Flicker Assessment (RFA) ... 132
3.5.3. Pupil measurements and retinal illuminance ... 135
3.5.4. Modulation sensitivity as a function of retinal illuminance ... 136
3.5.5. Calculating the HRindex for flicker sensitivity ... 136
3.5.6. Identifying participants with significantly elevated thresholds ... 137
3.5.7. Calculating binocular summation ratio (BSR) and Interocular Percentage Increase (IPI) ... 138
3.5.8. Statistical analysis ... 139
3.6.1. Included and excluded participants ... 140
3.6.2. HRindex for monocular flicker thresholds ... 141
3.6.3. Comparison of HRindex for contrast and flicker ... 152
3.6.4. Binocular flicker thresholds and summation ... 154
3.7. Discussion ... 157
3.7.1. Flicker sensitivity declines non-linearly with age ... 157
3.7.2. Binocular summation of flicker ... 159
3.8. Conclusions ... 161
4. The effect of scotopic/photopic ratio on visual acuity ... 163
4.1. Night illumination for drivers and pedestrians ... 164
4.2. Rod pathways ... 166
4.2.1. Multiple rod pathways in the retina ... 166
4.2.2. Rod-cone signal interactions at the retina and cortex ... 169
4.3. Rod-cone interactions in spatial vision and detection ... 172
4.4. The effect of scotopic/photopic ratio on vision ... 174
4.4.1. The effects of S/P ratio on visual performance ... 175
4.4.2. Effect of S/P ratio on pupil size ... 177
4.5. Aims and objectives of the study ... 178
4.6. Methods ... 180
4.6.1. Participants ... 180
4.6.3. Illumination system ... 182
4.6.4. Calculation of S/P ratios ... 183
4.6.5. Pupil measurement and retinal illuminance ... 187
4.6.6. Function fitted to visual acuity and retinal illuminance ... 187
4.7. Results ... 188
4.7.1. Illuminance and S/P on contrast thresholds and pupil size ... 188
4.7.2. Pupil variations with S/P ratio ... 191
4.7.3. Contrast thresholds independent of pupil size ... 193
4.8. Discussion: Effect of S/P ratio in mesopic vision ... 198
4.8.1. The effect of S/P ratio in naturalistic viewing ... 198
4.8.2. The effect of S/P on visual acuity ... 198
4.8.2. The effect of S/P on pupil size ... 200
4.8.4. Recommendations for street lighting ... 201
4.9. Conclusions ... 202
5. General discussion ... 203
5.1. Aging of monocular spatial and temporal vision at photopic and mesopic light levels ... 203
5.2. Aging of binocular spatial and temporal vision ... 206
5.3. Scotopic/photopic ratios to optimise mesopic spatial vision ... 207
5.5. Further work ... 208
6. Conclusions ... 211
List of tables
Table 1. Description of visual acuity and refraction of participants in decade bins. ... 103
Table 2. Description of ANCOVAs describing the effects of age, foveal location and normalised interocular thresholds difference on binocular summation. ... 115
Table 3. Description of visual acuity and refraction of participants in decade bins. ... 141
Table 4. (x, y) co-ordinates of chromaticities employed for each S/P ratio ... 184
Table 5. Foveal acuity thresholds for S/P ratios 0.5 – 5.5 at retinal illuminances of 1.5 to -1.5 log trolands. The bold results show peak increases in the acuity
thresholds. The highlighted values show the best acuity for that light level. Note that the poor acuity at the fovea at the lowest light level suggests that the stimulus size increases to stimulate rods outside the rod free zone. ... 199
List of figures
Figure 1. The structures of the human eye (Kolb, 2007). ... 26
Figure 2. 3D section of the retina (Kolb et al., 2005) ... 29
Figure 3. Cone and rod photoreceptors (Burns & Lamb, 2004) ... 31
Figure 4. A The distribution of rods and cones in the human retina (Purves et al., 2001). B the distribution of the three types of cone in the retina (Sharpe, Stockman, Jägle, & Nathans, 1999). ... 33
Figure 5. Responses of a ON-centre retinal ganglion cell (Goldstein, 2009) ... 35
Figure 6. Colour and luminance channels (Barbur) ... 36
Figure 7. Pathways from the retina to the visual cortex.
http://what-when-how.com/neuroscience/visual-system-sensory-system-part-3/ ... 37
Figure 8. Connections between the LGN and primary visual cortex (Thomson, 2010) ... 38
Figure 9. Centre-surround cell inputs to a simple cell in primary visual cortex
http://www.scielo.br/scielo.php?script=sci_arttext&pid=S0104-65001997000200002) ... 39
Figure 10. Transmittance of the lens (Boettner & Wolter, 1962) ... 43
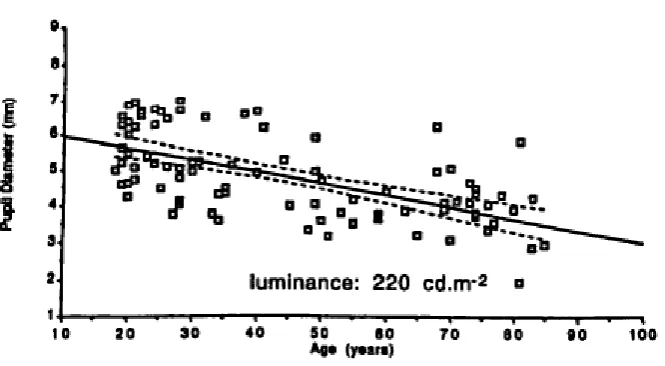
Figure 11. Changes in pupil diameter with age (Winn, Whitaker, Elliott, & Phillips, 1994) ... 44
Figure 12. Demonstration of presbyopia
Figure 13. Filled points and solid line show the maximal change in lens power for 27 human lenses (Glasser & Campbell, 1998). In addition these authors have plotted maximum and minimum amplitudes of accommodation from Duane (1912). ... 48
Figure 14. Comparison of normal retina with retina affected by wet AMD
(http://www.vision-and-eye-health.com/macular-degeneration-types.html) ... 52
Figure 15. Photopic, mesopic and scotopic contrast sensitivity function,
http://www.telescope-optics.net/aberrations_extended.htm ... 55
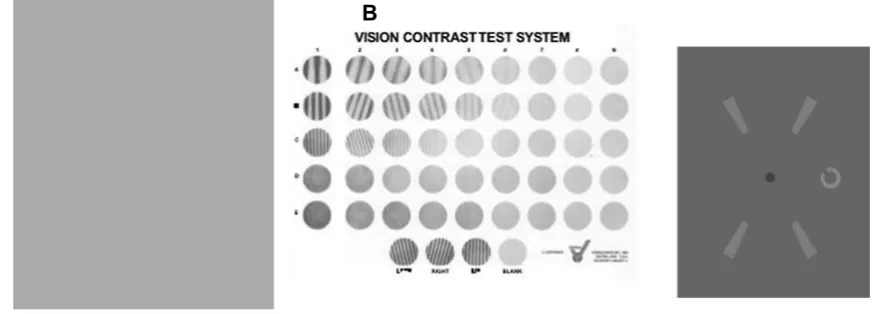
Figure 16. A Pelli-Robson chart http://www.psych.nyu.edu/pelli/pellirobson/. B
Vision Contrast Test System. Spatial frequency varies vertically and contrast varies horizontally
http://www.pacificu.edu/optometry/ce/courses/16554/agingeyepg2.cfm. C
Functional Contrast Sensitivity test. Participants indicate the direction of the gap in the Landolt C which varies in contrast while size remains constant (Chisholm, Evans, Harlow, & Barbur, 2003a). ... 57
Figure 17. Modulation and luminance-pedestal flicker (Hogg & Chakravarthy, 2006). ... 60
Figure 18. A Modulation sensitivity throughout the retina. B CFF throughout the retina. Modified from Tyler (1987) ... 62
Figure 19. TCSF at various retinal illuminances (Kelly, 1961), from
http://webvision.med.utah.edu/book/part-viii-gabac-receptors/temporal-resolution/ ... 63
Figure 20. Plot of the Stockman and Sharpe (2000) 2° cone fundamentals,
Figure 21. A CIE 1931 Chromaticity diagram from Ripamonti, Woo, Crowther, and Stockman (2009). The wavelengths of light are plotted around the edge and the central line is the Planckian locus which is the colour of an incandescent black body as it changes temperature. D93, D65 and D50 indicate the chromaticity of CIE standard illuminants that represent natural light found in different parts of the world, for which D65 is an indication of daylight in Western Europe. B shows MacAdam ellipses plotted in CIE 1931 (x, y) chromaticity diagram. From http://www.ecse.rpi.edu/~schubert/Light-Emitting-Diodes-dot-org/chap17/F17-05%20MacAdam%20ellipses.jpg ... 67
Figure 22. Scotopic and photopic luminous efficiency functions, from www.cvrl.org ... 76
Figure 23. Screenshots from the functional Contrast Sensitivity Test. A the fixation cross with no stimulus presented. B an example of a high contrast foveal (0°) stimulus with the gap orientated towards the top right. C example of a low contrast foveal stimulus with the gap orientate towards the top left. D example of a low contrast parafoveal stimulus (+4°). The fixation cross remains on the screen during parafoveal presentations to ensure the participant fixates on the centre of the monitor. E example of a low contrast parafoveal stimulus located at -4° eccentricity. ... 96
Figure 24. Age distribution of included participants (n=74). ... 102
one from each eye. For the parafoveal data, each participant contributes four points for each luminance level, from ±4° in each eye. For plotting purposes, results were not averaged across eyes due to differences in the measured retinal illuminance between the eyes on each trial. Fit to foveal data: log contrast threshold =
-0.4244*log E + 2.3123. Fit to parafoveal data: log contrast threshold = -0.3461*log E + 2.2444. ... 105
Figure 27. Contrast thresholds for participants at the range of light levels. For the foveal data each participant contributes two points for each screen luminance, one from each eye. For the parafoveal data, each participant contributes four points for each luminance level, from ±4° in each eye. For plotting purposes, results were not averaged across eyes due to differences in the measured retinal illuminance
between the eyes on each trial Fit to foveal data: contrast threshold = 283.2*(e-1.036 * log E) + 3.86. Fit to parafoveal data: contrast threshold = 213.3*(e-1.028 * log E) +
10.41. ... 106
Figure 28. HRindex as a function of age. Panels A and C show the HRindex for the
fovea and parafoveal respectively. Dashed lines show the 95% limits. Panels B and
D show the probability density distributions of the value of errors from the
regression line. ... 108
Figure 29. Examples of log contrast thresholds and the corresponding HRindex
values at the fovea and parafovea for a younger (age 22) and older (age 69) participant. The younger participant has a smaller area under the curve than the group data, resulting in a positive HRindex. However the older participant has a
Figure 30. Examples of contrast thresholds and the corresponding HRindex values at
the fovea and parafovea for a younger (age 22) and older (age 69) participant, re-plotted from Figure 29. ... 110
Figure 31. Foveal and parafoveal contrast thresholds at 900, 25 and 5 td. Upper panels show thresholds on a linear scale and lower thresholds on a log scale. Fit to foveal contrast thresholds on a linear scale, at 5 td, y = 0.7316x + 81.873, R² = 0.0857; at 25 td, y = 0.535x + 28.01, R² = 0.1343; at 900 td, y = 0.2700x + 4.7049, R² = 0.1556. Parafoveal contrast thresholds on a linear scale, at 5 td, y = 0.6422x + 84.848, R² = 0.0904; at 25 td, y = 0.5701x + 32.922, R² = 0.1876; at 900 td, y = 0.3659x + 5.9982, R² = 0.3077. Fit to foveal contrast thresholds on a log scale, at 5 td, y = 0.0029x + 1.906, R2 =0.0910, 25 td, y = 0.0047x + 1.467, R2
= 0.1533, 900 td, y = 0.0074x + 0.8226, R2 = 0.2159. Fit to parafoveal contrast
thresholds on a log scale, at 5 td, y = 0.0028x + 1.912, R2 = 0.1243, 25 td, y =
0.0046x + 1.536, R2 = 0.2295, 900 td, y = 0.0073x + 0.983, R2 = 0.3651. ... 112 Figure 32. BSR values below 1 (the BSR inhibition threshold) indicate binocular inhibition. A binocular summation ratio for normal, binocular participants (n=71). Binocular summation was calculated as the best monocular contrast threshold divided by the binocular contrast threshold at retinal illuminances between 900 td and 2 td. The solid line shows the linear fit to the foveal data (-0.0049*age + 1.5296, r2=0.048, p=0.067) and the dashed line the fit to parafoveal data
(-0.0051*age +1.656, r2=0.069, p<0.05). B a linear fit to both foveal and parafoveal
points as the ANCOVA revealed no effects of eccentricity (-0.0035*IPI + 1.5013, r² = 0.08, p<0.01). C IPI has no relationship with age at the fovea (r2=0.004,
Figure 33. The impulse response function at various retinal illuminances. At higher illuminances, the function is triphasic and rapid, however it is biphasic and sluggish at lower light levels. ... 127
Figure 34. Examples of the flicker stimuli employed in this study. The top row shows the fixation and foveal stimulus. The bottom row shows examples of the four peripheral stimuli. ... 133
Figure 35. Age distribution of 80 participants in the study. ... 140
Figure 36. Flicker thresholds for with retinal illuminance for included participants. For the foveal data each participant contributes two points for each screen
luminance, one from each eye. For the parafoveal data, each participant contributes eight points for each luminance level, from each eye. Fit to foveal data: flicker threshold = 336*E-0.5492 + 1.108E-06. Fit to parafoveal data: flicker threshold =
328*E-0.5351 + 5.696E-06. ... 142 Figure 37. Log flicker thresholds for with retinal illuminance for included
participants. For the foveal data each participant contributes two points for each screen luminance, one from each eye. For the parafoveal data, each participant contributes eight points for each luminance level, from each eye. Fit to foveal data: flicker threshold = -0.5896*log E +2.5095. Fit to parafoveal data: flicker threshold = -0.4997*log E + 2.4137. ... 143
Figure 38. HRindex as a function of age, fitted with a 2nd order polynomial quantile
regression. Black lines show 50th percentile (i.e. HRindex), and dashed lines the 5th
and 95th percentile. Equation for the HR
index, indicated by the 50th percentile, is
shown above each graph. A HRindex values for the fovea. 5th percentile fovea =
−0.0002 × Age2 + 0.128 × Age − 1.8511.95th percentile fovea = −0.0006 ×
5th percentile parafovea = −0.0015 × Age2 + 0.113 × Age − 2.2384.
95th percentile parafovea = −0.0002 × Age2 + 0.014 × Age + 0.2439. ... 144
Figure 39. Examples of log modulation thresholds and the corresponding HRindex
values for two normal participants, aged 21 and 74. The 21 year old has a smaller area than the group curve in both the fovea and the parafovea, resulting in a positive HRindex, whereas the 74 year old has a larger area under the curve at both
eccentricities, resulting in a negative HRindex. ... 146 Figure 40. Examples of modulation thresholds and the corresponding HRindex values
for two normal participants, aged 21 and 74. The 21 year old has a smaller area than the group curve in both the fovea and the parafovea, resulting in a positive HRindex, whereas the 74 year old has a larger area under the curve at both
eccentricities, resulting in a negative HRindex. ... 147 Figure 41. Foveal and parafoveal contrast thresholds at 900, 400, 100, 50 and 25 td. First page shows contrast thresholds on a linear scale. 2nd order quantile fits are
shown, with the solid line representing the 50th percentile, and dashed lines
representing the 5th and 95th percentile. The second page shows contrast thresholds
on a log scale. Points were derived from curves fitted to each individual’s data and averaged across eyes at the fovea and eccentricities and eyes at the parafovea. 151
Figure 42. Bland-Altman plot of the mean of contrast and flicker HRindex index
values and difference between these values. The middle line shows the mean difference value of 0.22. The other lines indicate the limits of agreement at
difference values of 1.06 and -0.62. ... 153
Figure 43. Modulation thresholds as a function of retinal illuminance for all participants for the worst eye, best eye and binocular viewing. For foveal
curves as a result of measuring modulation thresholds at five light levels for each of the viewing conditions (viewed by worst eye, best eye and viewed binocularly). The fits to the group data are the following, where E is retinal illuminance: Worst eye foveal threshold = 390.3 * E-0.5772 + 2.479E-05; Best eye foveal threshold = 368.5 *
E-0.6027 + 3.116E-05; Binocular foveal threshold = 387.8 * E-0.683 + 6.533E-07. For
parafoveal modulation thresholds, data points represent the average of four eccentricities as a result of four different parafoveal locations tested in each eye. The fits to the group data are the following: Worst eye parafoveal threshold = 390.1 * E-0.5685 + 0.735; Best eye parafoveal threshold = 394.8 * E-0.6144 + 1.604;
Binocular parafoveal threshold = 347.5 * E-0.689+ 0.1555. ... 154 Figure 44. Data are shown for participants at the fovea (solid circles) and
parafovea (unfilled squares) A BSR does not change substantially with age at the fovea or parafovea, and B shows that IPI does not change systematically with age either. Furthermore, C shows that there is no substantive relationship between BSR and IPI. ... 156
Figure 45. Illustration of the two rod pathways through retinal circuitry (Sharpe & Stockman, 1999). ... 167
Figure 46. Experimental setup showing the display area, chin rest and one of two illumination systems ... 181
Figure 47. The spectral power distribution of each of the four primaries in the illumination system. ... 183
quadrangles for lower S/P ratios (0.5 – 2.5) and subsequently form triangles (3.5 - 5.5). Green lines indicate the mid-points of the quadrangle used to calculate the centre point of each area of constant S/P ratio, which is indicated by a red cross. C
The centre points of areas of constant S/P fall along the red line for S/P ratios between 0.5 and 5.5. ... 185
Figure 49. Chromatic information of the S/P values chosen. A The S/P values in CIE space (1931) and estimated subjective appearance. B Spectral power
distributions of the S/P ratios. ... 186
Figure 50. Foveal acuity thresholds (primary y-axis) and corresponding pupil diameters (secondary y-axis) for illuminances 1, 0.1, 0.01 and 0.001 cd/m2. ... 189 Figure 51. Peripheral acuity thresholds (primary y-axis) and corresponding pupil diameters (secondary y-axis) for illuminances 1, 0.1, 0.01 and 0.001 cd/m2. ... 189 Figure 52. Mean pupil dianeter at photopic luminances. Error bars indicate one SE. ... 191
Figure 53. The effect of S/P ratio on pupil diameter at each photopic luminance. Error bars indicate 1 SE. ... 192
Figure 54. Acuity thresholds in arc min for each S/P ratio and light level at the fovea and peripheral averaged over all participants. Curves fitted to the points took the form: T = a × E − b + c, where T is the acuity threshold, E is retinal
illuminance and a, b and c are free parameters ... 194
Figure 55. Effect of S/P ratio on acuity thresholds at specific retinal illuminances. Error bars show 1 SE. ... 195
Figure 56. A Cone excitations at the S/P ratios used in the study. B, C and D
Acknowledgements
I would like to sincerely thank my supervisor, John, for giving me the opportunity to conduct this work. Throughout, he has been patient in teaching me new skills, kind in discussions of my work, encouraged me to pursue my ideas, and has opened up many opportunities for the future, for which I will be forever grateful. I would also like to thank the post-doctoral researchers that I had the good fortune to work with and learn from. Evgenia, your diligence and productivity is something to aspire to. Gary, I appreciate the numerous hours spent poring over our results and for your patience in reviewing my code. Wei, your unique combination of attention to detail and easy-going attitude made working with you productive and enjoyable. Furthermore I would like to thank Alistair Harlow for providing technical support and practical solutions to issues encountered.
Additionally, I would like to thank those who sparked my interest in vision science and pursuing research. Dr Henning was the first person who taught me about perception and has always been generous with his time and advice over the years. Erin Babinsky noticed and developed my interest in research when we met at
Oxford, and Miriam and Ahalya nurtured this when I worked with them as a research assistant at City, which was a very pleasant time. Your support has been more valuable than you could ever know.
This research would not have been possible without the hours of diligent observing by the participants, who kindly gave their time to take part in this research. I am particularly grateful for those who helped recruit more participants, you know who you are!
My time at City has been made deeply enjoyable by the many friends I have made and the experiences we have shared together. In particular, I want to thank Joe and Emily for good times we’ve had, in the UK and around the world – I hope we will keep adding locations to that list! I also want to thank Marisa, Eva, Irene, Yingxin, Priya and Emsal for discussions, drinks and advice. I am indebted to the efforts of James Perkins and Keith Simpson at City for their support during difficult times. Lucy and Sarah have been good friends and mentors, to discuss lab and health science with respectively.
My parents Marguerita and Alan, as well as my sister Muirin, have been persistently encouraging and supportive over the years of my education. I am grateful for the many hours they have spent listening to me talk about the ups and downs of research over the past three years, and for taking part in many of my experiments, often being one of the first participants before the procedure was fully streamlined.
Declaration
I grant powers of discretion to the University Librarian to allow the thesis to be copied in whole or in part without further reference to me. This permission covers only single copies made for study purposes subject to normal conditions of
Abstract
The research contained in this thesis describes three studies designed to investigate the ability of the observer to detect stimuli defined by changes in
luminance in space and/or time in mesopic conditions, including contrast sensitivity, temporal flicker sensitivity and visual acuity.
The first two studies determined the effect of the aging of the retina on spatial and temporal contrast sensitivity at photopic and mesopic light levels. The literature states that older people experience losses of retinal neurons including rods, cones and ganglion cells. Furthermore, older people tend to have particular difficulties with vision at low light levels which can be attributed to greater loss of rods than cones, particularly at parafoveal eccentricities. Spatial and temporal contrast sensitivity was measured separately in two groups of participants, aged 20-73 (n=74) and 20-74 (n=80) years of age, respectively. Measures were taken to ensure that thresholds largely reflected age-related changes to the retina rather than the optics of the eye. Spectral content of the stimuli was restricted to the middle and long wavelength regions of the visual spectrum and the pupil was measured continuously so as to obtain participant-specific retinal illuminances for each condition. The HRindex was
derived and calculated for each participant as a single number which summarized performance from photopic to mesopic light levels. As age increased both spatial and temporal contrast vision worsened and older participants showed particularly elevated thresholds at lower light levels when compared to younger participants. Spatial contrast thresholds show a steady linear decline with age, whereas temporal modulation thresholds were relatively stable up to 50 years of age and then
demonstrated a rapid decline. These different trends of changes in performance with increasing age suggests that contrast and temporal HRindex may be measuring
the aging of different retinal mechanisms. The normal limits of HRindex values were
calculated which could be used in the future to detect abnormal performance.
A secondary aim of the first two studies was to determine if binocular summation of spatial and temporal contrast thresholds declined with age, while accounting for differences in retinal illuminance between monocular and binocular conditions. For spatial contrast vision, binocular summation declined significantly with age and 18% showed binocular inhibition. However, the binocular summation of flicker signals did not change significantly with age and only 1% of participants showed binocular inhibition. Interocular differences cannot explain our results.
The third study determined whether altering the scotopic/photopic luminous efficiency ratio could improve spatial acuity at mesopic light levels. This was
achieved by altering the spectral power distribution of illuminating lights to increase the contribution of rods to vision at constant levels of photopic illumination. It was found that visual acuity at the fovea was improved by low levels of increased scotopic luminance, but peripheral acuity was improved by larger increases of scotopic luminance.
Abbreviations and symbols
° Degrees P-cells Cells in the parvocellular
pathway
µm Micrometres R2 Square of the correlation
coefficient
AMD Age-related Macular
Degeneration RF Receptive field
arc
min Minutes of arc RPE Retinal Pigment Epithelium
ARM Age-Related Maculopathy s Seconds
BSR Binocular summation ratio S cone Short wavelength sensitive
cone
c/deg Cycles per degree SD Standard Deviation
cd/m2 Candelas per metre squared SE Standard Error
CFF Critical flicker frequency SRCI Suppressive rod-cone
interaction
CIE Commission Internationale
d’Eclairage SW Short wavelength
CNV Choroidal neovascularisation TCSF Temporal contrast sensitivity
function
CRT Cathode Ray Tube td Trolands
CS Contrast sensitivity V(λ) Photopic spectral responsivity
function
CSF Contrast sensitivity function
(spatial) V’(λ) Scotopic spectral responsivity function
E Retinal illuminance V10(λ) Photopic spectral responsivity
function for the 10° observer FCS
test Functional contrast sensitivity test
GA Geographic atrophy
HRindex Health of the Retina Index
Hz Hertz
IPI Interocular percentage increase
IPRGC Intrinsically photosensitive retinal ganglion cells
IRF Impulse response function
L cone Long wavelength sensitive cone LogMA
R Logarithm of the Minimum Angle of resolution
LW Long wavelength
m Metres
M Mean
M cone Medium wavelength sensitive cone
MAP Macular Assessment Profile
M-cells Cells in the magnocellular pathway
mm Millimetre
ms Milliseconds
1. The visual system
The aim of the studies carried out in this thesis were firstly to determine the limits that describe healthy aging in spatial contrast and flicker sensitivity under specified stimulus conditions over light levels that are frequently encountered in working environments (i.e., high mesopic to photopic range). Another aim was to determine whether mesopic spatial vision can be enhanced by biasing the spectral composition of the illuminant to favour the stimulation of rod photoreceptors.
The UK is facing an aging population problem (Office for National Statistics, 2009), which will increase the incidence of age related ocular disease. This in turn is likely to increase the number of people with visual impairment from an estimated 1.8 million in 2008 to nearly 4 million by 2050 (Access Economics, 2008). Visual impairment has wide ranging consequences on an individual’s quality of life including an increased risk of depression (Branch et al., 1989 and Carabalese, Appollonio, Rozzini, Bianchetti, Frisoni et al., 1993), social isolation (Verstraten, Brinkmann, Stevens, & Schouten, 2005), and even increased incidence of falls and injury (Ivers, Cumming, & Mitchell, 2002).
1.1. The structure of the human eye
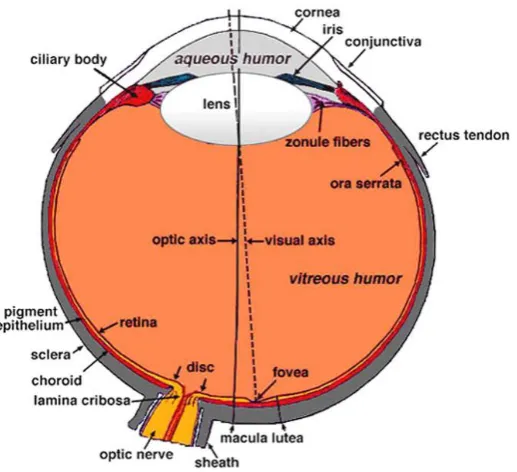
The human eye is located in the orbit of the skull (Figure 1). The eye is a slightly asymmetrical sphere of approximately 24-25 mm in length and has three different layers starting from the outer surface and progressing to the inner surface. The external layer includes the cornea at the anterior of the eye, and the sclera
[image:28.595.194.453.476.712.2]surrounding the rest of the eye. The intermediate layer is divided into the anterior segment containing the iris, ciliary body and the lens, and the posterior segment containing the retina and choroid. The last layer is the internal layer, containing the retina, which is the first part of the visual sensory system. The eye contains three chambers of fluid; aqueous humor is contained within the interior chamber between the cornea and the iris, as well as in the posterior chamber which is between the iris, zonule fibers and the lens. Vitreous humor is found in the vitreous chamber which is between the lens and the retina (Kolb, 2007).
1.2. The cornea and sclera
The cornea is a transparent structure at the most anterior region of the eye. The cornea is the first structure to refract light, and is responsible for two thirds of the refractive power of the eye which is required to focus a distant object into a sharp image on the retina. If the shape becomes irregular it results in a focusing defect known as astigmatism which causes a point source to be imaged as a line in two different image planes (Poon & Taylor, 1997). The cornea as a whole transmits light of 300 to 2500 nm, but has a maximum transmittance between 500 and 1300 nm (Boettner & Wolter, 1962).
The sclera is the continuation of the collagen fibres of the cornea towards the posterior of the eye, and is pierced throughout by blood vessels and nerves, the most substantial of which is the optic nerve. The primary function of the sclera is to provide a rigid and solid framework to the eye, allowing the formation of a retinal image.
1.3. The pupil
1.4. The lens
The lens is a transparent body suspended by ligaments called zonule fibres which are attached to the ciliary body. Accommodation is caused by ciliary muscle action which contracts or relaxes the zonule fibres, changing the shape of the lens. Accommodation allows the formation of a sharp image on the retina (Kolb, 2007); when viewing a distant object the ciliary muscle relaxes resulting in increased tension in the zonules, flattening the lens, whereas to view a near object the ciliary muscles contract resulting in slack zonules and the lens returns to a thicker shape. In a young eye, the refractive power of the lens is only one third (approximately 13 dioptres) of the total power, as the cornea is responsible for the rest of the
refractive power. It transmits wavelengths from around 350 to 1300 nm, a somewhat narrower range than the cornea (Boettner & Wolter, 1962).
1.5. The retina
1.5.1. Anatomy of the retina
The retina is the first part of the visual system that responds to light. It is formed embryonically from tissue that is connected to the brain by the optic nerve and therefore can be considered part of the brain (Rogers, 2010). The image is focused by the cornea and lens towards a central point along the visual axis, towards the macula, at the centre of which is the fovea. The optic nerve transmits neural signals from the retina to other regions of the brain and radiates major blood vessels to supply the retina with oxygen (Kolb, Fernandez, & Nelson, 2005).
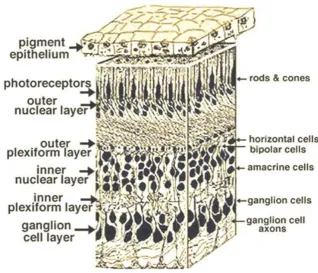
blood/retinal barrier and transports nutrients from the blood to the photoreceptors, transports metabolites from retinal tissue to the blood and controls ion homeostasis (Strauss, 2005). There are three layers of nerve cell bodies (nuclear layers) and two layers of synapses (plexiform layers) in the main part of the retina as shown in
Figure 2. The outer nuclear layer contains the cell bodies of rods and cones which are the light sensitive photoreceptor cells and the inner nuclear layer contains neurones called horizontal, bipolar and amacrine cells and the final ganglion cell layer contains the ganglion cells which transmit signals from the eye via the optic nerve. The outer plexiform layer contains connections between rods and cones, as well as vertically running bipolar cells and horizontally running horizontal cells. The inner plexiform layer connects the vertically running bipolar cells and lateral
connections with amacrine cells, to the ganglion cells in their ganglion cell layer which transmit visual information via the optic nerve (Kolb et al., 2005).
1.5.2. The macula and fovea
1.5.3. Photoreceptors
The retina contains three kinds of photoreceptors, rods, cones and intrinsically photosensitive retinal ganglion cells (IPRGCs), however, for quality spatial and temporal vision, we rely on the signals from rods and cones. These photoreceptors convert light into electrical signals using a chemical cascade process known as phototransduction. Cones tend to be larger than rods and they differ in shape with cones showing a more pyramidal profile and rods appearing more cylindrical (Figure 3).
The rods and cones each have an outer segment, an inner segment and
synaptic ending. The outer segment contains a number of different light capturing proteins, broadly referred to as opsins. In cones the opsin is
contained within the sac-like folds of the plasma membrane, whereas in rods opsin is contained in the intracellular organelles called discs which are
discontinuous from the membrane of the receptor. The inner segment contains an
[image:33.595.336.518.282.542.2]area called the ellipsoid, providing a high density of mitochondria which function to supply adenosine triphosphate (ATP) to the outer segment, which is metabolically demanding. Other expected organelles are contained within the inner segment, such as the endoplasmic reticulum and Golgi apparatus (Burns & Lamb, 2004).
Figure 3. Cone and rod photoreceptors
The process of phototransduction is activated by the absorption of a photon of light by a photopigment chromaphore, transforming it into an active state which
activates a G protein transducin which subsequently activates the effector protein (a molecule that binds to another protein to regulate its activity), phosphodiesterase. Phosphodiesterase hydrolyses the messenger cyclic guanosine monophosphate (cGMP), decreasing its concentration within the photoreceptor, resulting in the closure of cGMP-gated ion channels which hyperpolarises the cell and generates an electrical response which is transmitted by the synaptic terminal (Burns & Lamb, 2004). It is worth noting that mammalian photoreceptors are activated by hyperpolarisation and other neurones tend to be activated by depolarisation.
Rods and cones have differential sensitivities to light level; rods are more sensitive to lower levels of light, whereas cones are less sensitive but contribute to a higher quality of spatial and temporal vision, as well as mediating colour vision under higher levels of illumination. At high levels of illumination (above ~ 3 cd/m2) vision
is dominated by cones, whereas below 0.0003 cd/m2 only rods mediate vision. Rod
mediated vision at low light levels is known as scotopic vision and cone mediated vision at higher light levels is known as photopic vision (Barbur & Stockman, 2010). At intermediate light levels, both rods and cones contribute to the visual response, which is known as mesopic vision. Rods and cones can interact in mesopic
[image:35.595.104.536.121.331.2]conditions, either directly via rod-cone gap junctions or more distally via other connections in the retina (Sharpe & Stockman, 1999).
Figure 4. A The distribution of rods and cones in the human retina (Purves et al., 2001). B the distribution of the three types of cone in the retina (Sharpe, Stockman, Jägle, & Nathans, 1999).
1.5.4. Post-receptoral retinal pathways
Photoreceptors have three main pathways through the retina; Rod-cone gap junctions, the vertical pathways and the lateral pathways. The pathways involve connections between the photoreceptors, bipolar cells, horizontal cells, amacrine cells and ultimately they pass their signals on to ganglion cells. There are twenty kinds of retinal ganglion cells (Rodieck, 1998), however the main three types are midget, parasol and bistratified (Dacey & Lee, 1994; Kolb, Linberg, & Fisher, 1992; Polyak, 1941).
There are a number of neural pathways through the retina. Firstly, rods synapse onto cones using rod-cone gap junctions providing a direct pathway for interaction between these two types of photoreceptor. The second pathway is, known as the vertical pathway, where bipolar cells contact either rods or cones and pass signals on to retinal ganglion cells in the inner plexiform layer. The third pathway is the lateral pathway which has two levels using horizontal cells and amacrine cells to provide antagonistic lateral connections between both rods and cones to adjust the gain of photoreceptor output to generate spatial and chromatic opponency. This becomes the basis of ganglion receptive fields in which central areas of the receptive field are modulated by surrounding areas (Perlman, Kolb, & Nelson, 2005).
of light rather than to uniform surfaces. Figure 5 describes the responsive properties of a centre-surround ganglion cell with an ON centre and an OFF surround, which is made possible by lateral inhibition. The ganglion cell responds minimally when light stimulates the whole receptive field (d) or none of the field due to inhibitory lateral connections. The cell responds maximally when light falls over the whole of the ON centre and none of the OFF surround (b). A less optimal response is obtained if the light stimulates only some of the ON centre (a) or if it additionally falls partially on the OFF surround (c). This arrangement allows increased responses to luminance or chromatic contrast, as chromatic opponent retinal ganglion cells respond maximally to a particular range of wavelengths at the centre or surrounding areas. Receptive fields of ganglion cells overlap considerably in the retina so that each point may form part of many ON and OFF centre ganglion cells (Kandel, Schwartz, & Jessell, 2000).
Correspondingly, ON bipolar cells depolarise when the cone hyperpolarises in the presence of light. In contrast, OFF bipolar cells hyperpolarise in response to
increments of light and depolarise in response to decrements in light. These bipolar cells then synapse separately with the corresponding ON or OFF ganglion cells. Only L and M cones are connected to both ON and OFF bipolars, S cones are only
connected to ON bipolars, but signals from all cone types can be connected to ON or OFF ganglion cells. It is clear from this stage that there are two relatively independent pathways for colour and luminance; rod signals and the sum of L and M cone signals are used for the scotopic and photopic luminance channels
respectively, and the L-M and (L+M)-S signals contribute to the chromatic channels as shown in Figure 6.
1.6. Post-retinal visual processing
The axons of the retinal ganglion cells project to the optic disc and leave the eye via the optic nerve. They reach the optic chiasm when the nerves from the nasal visual field decussate whereas the temporal nerves remain on the ipsilateral side which allows the image from one side of the visual field to be transmitted to the
contralateral cortical hemisphere. After this stage, the majority of nerves travel via the optic tract to the Lateral Geniculate Nucleus (LGN) in the thalamus which is the start of the major visual pathway to the cortex.
1.6.1. The lateral geniculate nucleus (LGN)
The LGN is a nucleus in the thalamus of the brain, located between the cerebral cortex and the midbrain. It is composed of two parts, located in each hemisphere
(Figure 7). M-cells from the retina project to the magnocellular layers of the LGN (layers 1 and 2), which are located ventrally, and the more numerous P-cells project to the parvocellular layers (layers 3-6) located more dorsally. The bistratified
ganglion cells project to the koniocellular layers (Dacey & Lee, 1994) which are located between the interlaminar spaces of the principle magnocellular and
parvocellular layers (Hendry & Yoshioka, 1994). There are similar numbers of cells in the magnocellular and interlaminar layers, however the koniocellular cells are very small and therefore difficult to study. Each layer receives input from one eye only; layers 1, 4 and 6 receive input from the contralateral eye whereas layers 2, 3 and 5 receive projections from the ipsilateral eye. The LGN also receives feedback from the primary cortex.
The M and P pathways have distinct response properties, specialised for the stimuli that they process. These
differences can be described in five main ways (Hendry, Hsiao, & Brown, 2008). Firstly, the receptive field sizes of P-cells are much smaller than those for M-cells at the same retinal position. Secondly, the conduction speed of axons in M-cells tend to be faster than those for P-cells. Thirdly the responses of M-cells tends to be transient in comparison to the P-cells, which can produce sustained responses,
particularly to chromatic stimuli. Fourthly, most P-cells are sensitive to wavelength differences whereas most M-cells are not. Finally M-cells are thought to be sensitive
Figure 7. Pathways from the retina to the visual cortex. http://what-when-
to low luminance contrasts whereas P-cells are insensitive to small changes in luminance. These response properties are the basis for the P-cells chromatically selective responses, and the M-cells sensitivity to luminance contrast.
1.6.2. Visual cortex
Primary visual cortex is also known as V1, the striate cortex or Brodmann Area 17. As a result of hierarchical information flow, a number of more complex visual abilities emerge from the responses of neurones in primary visual cortex, including direction selectivity and binocular interactions as some neurones respond to stimulation from either eye.
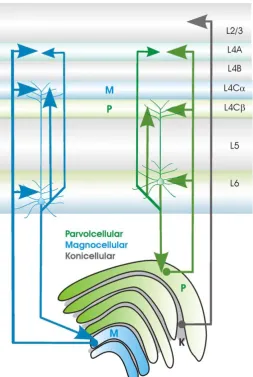
Neurones from the various layers of the LGN project via the optic radiation to the primary visual cortex which itself has six layers (Figure 8). Inputs from the distinct areas of the LGN are initially kept separate in V1, with inputs from the magnocellular pathway terminating in sublayer 4Cα and lower layer 6 and parvocellular cells terminating in 4Cβ and lower layer 6 (Lund, Lund, Hendrickson, Bunt, & Fuchs, 1975). Both parvocellular and magnocellular neurones
[image:40.595.286.540.357.735.2]koniocellular cells terminate in the “blob” regions of lower layer 3 (Livingstone & Hubel, 1984; Thomson, 2010).
The primary visual cortex has a functional architecture; cells are arranged in a systematic way so that neurones within a particular area respond to similar stimulus properties. For example, recording from neurones arranged in a column
perpendicular to the surface of the cortex will reveal that different cells have similar orientation selectivity. Another property is that columns in primary visual cortex represent a particular region of the visual field and surrounding areas of the cortex represent the corresponding surrounding areas of the visual field, meaning that primary visual cortex is a retinotopic map of the visual field, however not all parts of the visual field are equally represented; the central visual field has a greater area of the cortex dedicated to it whereas there is less cortex dedicated to more peripheral areas of the visual field.
Functionally, achromatic contrast sensitivity is high in layers 4Cα and 4B (which receives input from 4Cα; Livingstone & Hubel, 1984). In addition to these areas, layer 6 contains direction selective cells (Hawken & Parker, 1990).
Systematic connections between the LGN and visual cortex provide the
required inputs for simple and complex cells found in the primary visual cortex of cats (Hubel & Wiesel, 1962). The simple cells had elongated OFF or ON surrounds, flanking an antagonistic centre which could be activated by the combined input of
Figure 9. Centre-surround cell inputs to a simple cell in primary visual cortex
centre-surround cells as shown in Figure 9 and respond optimally to stimuli of a particular orientation. Complex cells responded optimally to a stimulus of a
particular orientation but did not have ON or OFF regions within its receptive field or have an elongated receptive field itself. They speculated that simple cells projected to complex cells which would therefore respond selectively to an orientation
presented anywhere within the receptive field.
From the visual cortex neural projections are sent to functionally distinct extrastriate areas to derive increasingly complex information from the visual input, often with reciprocal connections between the higher and lower areas in the hierarchy with shortcuts between. The staining of V2 with cytochrome oxidase reveals thick, thin and pale stripes. The thin stripes receive projections from the V1 blobs and
underlying areas in layer 4B, whereas the thick and pale stripes receive input from the interblob areas (Sincich & Horton, 2005). Area MT/V5 is specialised for the detection of motion, containing neurones which respond selectively to motion in a particular direction (Allman & Kaas, 1971; Dubner & Zeki, 1971) with quite broad stimulus attributes. Streams have been suggested to be a higher order organising principle with the areas of temporal cortex forming the ventral stream which is broadly specialised for the recognition of objects and the areas of the parietal cortex forming the dorsal stream which is specialised for location and action (Ungerleider & Mishkin, 1982).
1.7. The aging human visual system
(Mathers, Lane, & Zimmerman, 1996). In addition, the vitreous degenerates with increasing age (Oksala, 1978); there is an increase in liquid and decrease in gel volume (O’Malley, 1976) and an aggregation of fibres (Sebag & Balazs, 1985). One consequence of these changes to the vitreous is posterior vitreous detachment whereby the vitreous detaches from the retina (Sebag, 1987). Some have argued that the main cause of vision loss could be due to increased light scatter in the eye with increasing age (McLellan, Marcos, & Burns, 2001).
1.7.1. Light scatter and absorption in the eye; the role of aging
Light scatter is a result of light being captured by particles and instead of being able to travel in its original direction of propagation, it is released in another direction (Raman, 1978). Interocular light scatter is when the structures within the eye cause this light scatter. The cornea contributes to 30% of the total forward light scatter (Vos & Boogaard, 1963) and the ability of the cornea to transmit different
wavelengths of light does not change with age (van den Berg & Tan, 1994). Scatter caused by the vitreous is not strongly wavelength dependent above 320 nm
(Boettner, 1967; Maher, 1978; Ambach et al., 1994; van de Kraats & van Norren, 2007), and is not thought to increase significantly with age (Boettner, 1967; van de Kraats & van Norren, 2007).
the finding that fibres continue to be laid down in the lens with increasing age (Simpson, 1953; Hemenger, 1988). However, more nuclear scatter may be caused by the deposits of macromolecules with different refractive indices from the
surrounding lens tissue which increase with age (Spector, Li, & Sigelman, 1974).
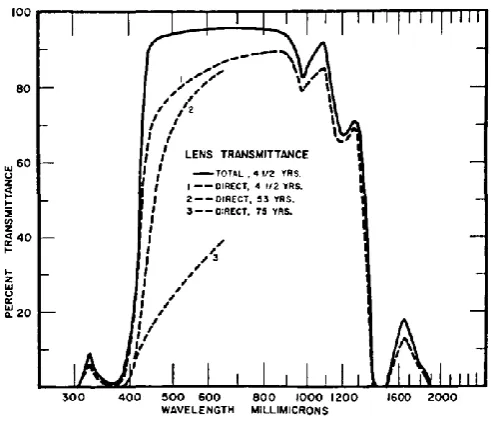
These anatomical changes to the lens can cause different forms of visual discomfort. Firstly, forward scatter acts as a veiling luminance and reduces the contrast of the image formed on the retina (de Waard, IJspeert, van den Berg, & de Jong 1992). Absorption of light by age-related changes to the lens will reduce the amount of light that reaches the retina, but the effects may only cause significant impairment at low light levels (Elliott, Bullimore, Patla, & Whitaker, 1996). Scattered light increases with age (Weale, 1986) and may not be wavelength dependent (Wooten & Geri, 1987; Whitaker, Steen & Elliott, 1993).
Absorption of light by the lens is wavelength dependent, with shorter wavelengths being increasingly absorbed with age (Figure 10; Weale, 1987; Lerman, 1984; Cooper & Robson, 1969) causing reduced retinal illuminance. A cataract is when the lens has particularly high optical density which gives it a cloudy appearance,
Figure 10. Transmittance of the lens (Boettner & Wolter, 1962)
Individual differences in iris pigment can also affect the forward light scatter in the eye. Previous studies have found that straylight is increased for individuals with blue/lighter rather than brown/darker iris pigmentation (Ijspeert, de Waard, van den Berg, & de Jong, 1990; Ginis, Perez, Bueno, Pennos, & Artal, 2013), and those with green iris pigmentation have intermediate levels of straylight (Coppens, Franssen, & van den Berg, 2006).
that the retina contributes up to 40% of the enoptic scatter (Vos & Bouman, 1964; Vos, 2003) and the fundus contributes significantly to total stray light for
wavelengths longer than 600 nm (Ginis et al., 2013).
1.7.2. Pupil miosis
[image:46.595.123.456.386.569.2]It is well documented that pupil size decreases with increasing age (pupil miosis) as shown in Figure 11, due to the muscle atrophy of the controlling muscles. This trend holds over a range of different ambient illuminances (Winn, Whitaker, Elliott, & Phillips, 1994). By the age of 80, pupil size is effectively fixed (Loewenfeld, 1979, 1999).
Figure 11. Changes in pupil diameter with age (Winn, Whitaker, Elliott, & Phillips, 1994)
(1) 𝑇 = 𝐿 × 𝑃𝐴
Where L is the luminance of the stimulus in cd/m2, PA is the pupil area in mm2 to
give T, the measure of retinal illuminance in Trolands. Weale (1963) estimated that the age related reduction in retinal illuminance is approximately 0.3 to 0.5 log units between the ages of 20 and 65 years. In support, Figure 25 shows that from studies described in this thesis, between the years of 20 and 65 years retinal illuminance decreases by 0.42 log units due to reduced pupil size.
It is therefore important to calculate the retinal illuminance for each participant, because for a given screen luminance a younger person would have a higher retinal illuminance than an older person, and therefore may perform better on that basis alone. For example when viewing a display of 120 cd/m2, for a group of sixteen
18-42 year olds, average pupil area was 9.05 mm2 producing an average retinal
illuminance of 1089 td, whereas the older group of twelve 65-86 year olds had an average pupil area of 6.57 mm2 and corresponding retinal illuminance of 799 td
(Mayer, Kim, Svingos, & Glucs, 1988).
1.7.3. Ocular aberrations
coma, spherical aberrations and 3rd-7th order aberrations (McLellan et al., 2001) and
thus contribute to increased visual difficulties with age.
Some authors have suggested that ocular aberrations are the main cause of vision loss with age (McLellan et al., 2001). However, the ratio of the modulation transfer function between younger and older participants peaks at intermediate frequencies, whereas loss of contrast sensitivity increases monotonically with spatial frequency (Artal et al., 1993), and thus could be due to a loss of sensitivity due to neural factors or reduced retinal illuminance. This topic is discussed further in section 2.1.1.
There are, however, some advantages of having a smaller pupil such as the
increased depth of field (the depth in which objects are within an acceptable range of focus; Green, Powers, & Banks, 1980) as well as a reduction wave-front
1.7.4. Presbyopia
[image:49.595.115.535.281.376.2]Presbyopia is the progressive inability to accommodate to near objects due to a loss of flexibility in the lens and deterioration of the cilliary muscles. As shown in Figure 12, when someone who is younger with normal vision looks at nearby objects, the lens expands to bring the image into focus on the retina. However, when an individual with presbyopia attempts to focus on a nearby object, the lens cannot sufficiently expand and the image focal point lies behind the retina.
Figure 12. Demonstration of presbyopia
(http://seikoeyewear.com/eye-information/about-the-eyes/presbyopia)
Figure 13. Filled points and solid line show the maximal change in lens power for 27 human lenses (Glasser & Campbell, 1998). In addition these authors have plotted maximum and minimum amplitudes of accommodation from Duane (1912).
1.7.5. Aging of the retina
why rods are more susceptible to aging, but possible reasons could include sensitivity to light damage or to changes to the RPE which could be a causative mechanism for damage to the retina in age related macular degeneration (Curcio et al., 1993), however the RPE cells are lost at a linear rate, more similar to the loss of cones rather than the nonlinear loss of rods (Gao & Hollyfield, 1992). Another possible reason is that the delivery of oxygen becomes less efficient with age which could affect rods to a greater extent as they are more metabolically demanding than cones, particularly in the dark (Barbur & Connolly, 2011).
Retinal ganglion cells undergo a significant decrease in number with age, and again the rate of loss was greatest between the 20s and 40s, although the variability between people was found to be very high (Curcio & Drucker, 1993; Gao &
Hollyfield, 1992). More recent studies have confirmed the loss of ganglion cells with age, however there is overall more loss at peripheral than central retina (Harman, Abrahams, Moore, & Hoskins, 2000).
Analogous findings of rod loss with aging have also been found in mice (Kolesnikov, Fan, Crouch, & Kefalov, 2010). Comparing rod physiology and function in adult mice (4 months old) and aged mice (2.5 years old), they found that aged mice had a 20% reduction in the number of rods, but unlike human rods, they were reduced in length and diameter resulting in a 40% overall reduction in the volume of the rod outer segment. This reduced number and size of the rods would result in reduced quantum catch and could at least partially explain a loss of sensitivity. In the same mice, they found a statistically significant 50% reduction in scotopic (at -4.45 log cd/m2) visual acuity and contrast sensitivity in aged mice, whereas there were no
significant differences in these measures in photopic conditions (1.85 log cd/m2).
sensitivity of aged rods determined from single cell recordings decreased 1.5 fold. Finally, they found that the level of cellular noise in the dark current (current when a rod is not stimulated) was increased in aged rods.
1.7.6. Cellular aging in central visual pathways
Similarly to the retina, aging in the higher visual pathways can manifest as a loss of cell numbers or decline in function of the cells that remain. In the LGN, a neuronal density decrease of 29% was found in magnocellular layers, and 41% in
parvocellular layers in older compared to younger monkeys, however the decrease in the number of neurones was very small and was not statistically significant, whereas the LGN volume actually increased as a whole with age due to an increase in the size of neurones, blood vessels, volume of glia cells and neurophil (Ahmad & Spear, 1993). This has led to speculation that the size of cells increases over a lifetime or compensatory processes such as dendritic branching, increases in the number of synapses and/or decrease in the efficacy of synaptic transmission (Spear, 1993). In V1, decrease in cell density and loss of myelin sheath of axons has been reported but no loss of the overall numbers of nerve fibres (Peters, 2009).
Schulzer, Yidegiligne, & Weis, 1989), representing a 0.5% annual loss (Calkins, 2013).
VEPs of older people tend to have a reduced amplitude and increased latency, especially for high spatial frequency stimuli (Bobak, Bodiswollner, Guillory, & Anderson, 1989). Faubert (2002) presents a theory of visual aging suggesting that less complex stimuli will not be majorly affected by aging of the visual pathways but if more complex visual stimuli are presented, or if multiple stimuli require processing by the same brain areas, the processing of the stimulus will be impaired by age-related changes to the brain. If all neural networks are affected equally by aging, a more complex visual task will recruit more networks and require more processing and thus the effects of aging will be more evident. For example, older participants recruit additional cortical areas for a specific task and there appeared to be less functional segregation in activation between the dorsal and ventral pathways
1.7.7. Age related macular degeneration
Age-related Macular Degeneration (AMD) is the leading cause of blindness in developed
countries, affecting 25 million people (Qiu & Leat, 2009). A cross-sectional sample of
residents in Australia aged over 40 years found that 0.68% had AMD and 15.1% early age-related maculopathy (ARM). In addition, the bilaterality of ARM was strongly age related with a prevalence of 59% (VanNewkirk et al., 2000).
Figure 14 shows the difference between a normal retina and one with AMD. There are two types, “dry” AMD, and then some people
progress to the “wet” (or exudative) form which results in more severe vision loss. Dry
AMD accounts for the vast majority of cases and manifests as hyper or hypo-pigmentation of the RPE at the macula, an accumulation of drusen (extracellular deposits that vary in size, shape and location) and the death of rods and cones. Towards the end of the dry stage, macular degeneration of the RPE may occur (geographic atrophy; GA), resulting in increased death of the photoreceptors. GA has been defined as an area of 500+ micrometers of loss of RPE with colour and thickness changes relative to the surrounding retina and more prominent
visualizations of the choroidal vessels (Sunness, et al., 2008). Geographic atrophy tends to spare the foveal centre until later in the disease at which point it causes
Figure 14. Comparison of normal retina
with retina affected by wet AMD
scotomas around the fovea (Sunness, et al., 1997). Wet AMD accounts for the rest of cases and is the reason for the large proportion of people registered as visually impaired. In wet AMD new blood vessels start to grow in the retina (choroidal neovascularisation; CNV) which leak blood and fluid resulting in more damage and later scarring of the macula.
There has been some difficulty identifying risk factors for who will acquire AMD and of those who have it, what the risk factors are for progressing from dry to wet AMD. Age and tobacco smoking tend to be the strongest and commonly found predictors of acquiring AMD (Eisner, Fleming, Klein, & Mauldin, 1987b; Smith et al., 2001; VanNewkirk et al., 2000), but having signs of AMD alone at early stages does not predict that AMD will develop. Early changes are found in 15% of the over 50s population, however only 1-2% develop severe vision loss and late stages of AMD (Smith et al., 2001; VanNewkirk et al., 2000). Factors such as drusen size, number, confluence and pigmentary changes have limited success at predicting the risk of progression and this has led to the suggestion that clinical signs of disease may not be the best predictors of progression, whereas tests of visual function could be (Luu et al., 2013).
1.8. Spatial, temporal and chromatic visual perception
The visual system extracts useful information from the visual input and computes the properties of the stimulus by the detection of change, such as the lateral inhibition in ganglion cell receptive fields. The three kinds of contrast in vision described here will be detection of changes in luminance over space (spatial vision), changes in the distribution of light over time (temporal vision) and finally chromatic changes in the spectral composition of light (Hendry et al., 2008).
1.8.1. Spatial vision
Spatial contrast can be broadly described as the fractional difference in luminance between two areas of the image detected either by the sum of L+M cones in photopic conditions or rods in scotopic conditions. Spatial form perception detects changes in luminance over space and can indicate the boundary between two objects or discriminate the object from the background (Norton, Corliss, & Bailey, 2002). Spatial acuity is defined as the finest spatial detail that can be detected, discriminated or resolved and it provides a benchmark of an individual’s visual condition. Spatial frequency is the number of cycles per degree of visual angle and visual angle is a measure of the size of an object on the retina.
The Weber contrast of an object can be positive, i.e. brighter than the background, or negative, i.e. darker than the background. Weber contrast is defined by equation (2) where L is the luminance of the object and Lb is the luminance of the
background
(2) 𝑊𝑒𝑏𝑒𝑟 𝑐𝑜𝑛𝑡𝑟𝑎𝑠𝑡 = (𝐿−𝐿𝑏)
When a spatially periodic pattern such as a sinusoidal grating is employed, the grating contrast is often expressed as using the maximum and minimum luminances of the pattern, (Lmax – Lmin) / (Lmax + Lmin). The contrast sensitivity function (CSF)
describes how the human visual system performs at a range of spatial frequencies. As shown in Figure 15, the contrast sensitivity function increases gradually and peaks at approximately 10 cycles per degree and rapidly drops off at higher spatial frequencies with the highest spatial
frequencies that can be detected at around 30-60 c/deg. The high resolution limit is a result of the spacing between photoreceptors and the limit imposed by the optics of the eye. Underlying the visual systems CSF is each ganglion cell with its own CSF as a result of centre-surround organisation. For example an ON-centre cell would respond maximally to high
luminance at the centre and low luminance in the surround, spatially matching the centre surround boundaries. At every retinal location there are ganglion cells with large and small receptive fields, allowing the detection of low and high spatial frequencies respectively. All spatial luminance patterns can be decomposed into sine wave gratings of particular spatial frequencies and contrasts (Ginsburg, 2003).
Contrast sensitivity depends on retinal illuminance. At mesopic levels (between 3 and 0.001 cd/m2) visual function is mediated by both rods and cones providing
reduced contrast sensitivity and acuity, but at scotopic levels (below 0.001 cd/m2)
visual function relies entirely on rods because the light level is below cone
Figure 15. Photopic, mesopic and scotopic
contrast sensitivity function,
thresholds (Barbur & Stockman, 2010). When rods are used for vision, sensitivity to high spatial frequencies is lost and the peak sensitivity drops to lower spatial
frequencies due to the large numbers of rods which converge on ganglion cells resulting in larger receptive fields. This causes acuity differences at different light levels even though cones are more widely spaced than rods. Additionally the CSF shifts to lower spatial frequencies with increasing eccentricity due to there being fewer cones with increasing eccentricity.
There are a number of ways of measuring contrast sensitivity (Figure 16). A common method in clinical practice is the use of charts such as the Pelli-Robson chart for letters which are presented in sets of three, each triplet decreasing in negative contrast. The participant is instructed to identify as many letters as possible. Other charts utilise sinusoidal gratings which vary in both contrast and spatial frequency, whereby the participants identify the orientation of gratings. Psychophysical tests present the stimuli briefly and thus can measure visual performance at different eccentricities reliably, before the participant moves their head or eyes. The contrast of the stimulus will vary depending on the participant’s responses to determine the individual’s contrast sensitivity or contrast threshold. A wide range of stimuli can be used in psychophysical tests including alpha-numeric characters or gratings.