City, University of London Institutional Repository
Citation
:
Barbur, J. L. and Konstantakopoulou, E. (2012). Changes in color vision with
decreasing light level: separating the effects of normal aging from disease.. Journal of the
Optical Society of America A: Optics, Image Science & Vision (JOSA A), 29(2), A27 - A35.
doi: 10.1364/JOSAA.29.000A27
This is the unspecified version of the paper.
This version of the publication may differ from the final published
version.
Permanent repository link: http://openaccess.city.ac.uk/3256/
Link to published version
:
http://dx.doi.org/10.1364/JOSAA.29.000A27
Copyright and reuse:
City Research Online aims to make research
outputs of City, University of London available to a wider audience.
Copyright and Moral Rights remain with the author(s) and/or copyright
holders. URLs from City Research Online may be freely distributed and
linked to.
City Research Online:
http://openaccess.city.ac.uk/
[email protected]
Changes in color vision with decreasing light level:
separating the effects of normal aging from disease
John L. Barbur,* and Evgenia Konstantakopoulou
Applied Vision Research Centre, The Henry Wellcome Laboratories for Vision Sciences, The City University London, London EC1V 0HR, UK
*Corresponding author: [email protected]
Received September 1, 2011; revised October 23, 2011; accepted October 30, 2011; posted November 1, 2011 (Doc. ID 153791); published January 6, 2012
The purpose of this study was to obtain additional information about the health of the retina (HR) by measuring the rate of loss of chromatic sensitivity with decreasing light level. TheHRindexis introduced to separate the effects of normal aging from early stage disease. For normal subjects theHRindexis largely independent of age (r2∼0.1), but ∼11%of clinically normal, asymptomatic, older subjects exhibit values below the2σlimit. TheHRindexprovides a single number that captures how light level affects chromatic sensitivity irrespective of age and can be used to screen for preclinical signs of retinal disease. © 2012 Optical Society of America
OCIS codes: 330.1720, 330.7323.
1. INTRODUCTION
It is generally accepted that many aspects of visual perfor-mance worsen at lower levels of ambient illumination and that the effects can be debilitating in healthy, older subjects [1,2] and more so in patients with ocular pathologies [1,3,4]. Vision at low light levels is also compromised by imposed mild levels of hypoxia in healthy young subjects [5,6]. Other studies have shown that healthy normal observers who are carriers of the CFH, LOC387715, and HRTA1 genotypes and are considered to be of high risk of developing age-related maculopathy later in life perform significantly worse in the mesopic range in some visual tasks, but not at higher light levels [7]. Such ob-servations suggest that measurable changes in visual perfor-mance at lower light levels may carry more information about the state of the retina than similar measurements in the photo-pic range. In addition to lowering the ambient light, a reduc-tion in retinal illuminance can also be caused by the decreased pupil size in older subjects [8–10] and the increased absorp-tion and scattering of light by the lens [11–13]. Although changes in the optics of the eye can affect spatial resolution and contrast sensitivity by reducing retinal image contrast and retinal illuminance, of even greater interest is the worsening of visual performance that can be attributed to changes in the retina and the visual pathways [14–16]. The latter can be in-dicative of early diseases of the retina and are best detected using visual tasks that do not require high spatial resolution, such as the detection of rapid flicker [17] or color differences with large stimuli [18]. When adapted to photopic light levels, chromatic sensitivity in normal subjects changes only very slowly with changes in retinal illuminance, but this is not the case when low photopic/upper mesopic light levels are in-volved [19]. When comparing color detection thresholds mea-sured at lower light levels, it is therefore important to minimize the confounding effect of changes in retinal illumi-nance caused by differences in pupil size and prereceptoral absorption of light. Red–green (RG) and yellow–blue (YB) me-chanisms act independently at threshold [20], but it is gener-ally believed that aging affects preferentigener-ally the YB
mechanism [21,22]. Although several studies have shown that color vision deteriorates with advancing age [23,24], some controversy remains as to whether normal aging affects more the YB mechanism [25]. Diseases of the eye, such as diabetes, tend to affect uniformly both RG and YB mechanisms, although the loss of YB sensitivity precedes RG in early stage age-related macular degeneration [26]. The prevalence of ret-inal and systemic diseases that affect vision increases with age and almost invariably these cause loss of chromatic sensitiv-ity. Older subjects also exhibit greater variability in both RG and YB chromatic sensitivity and this makes it difficult to de-tect the very early stages of disease. This study investigates the extent to which the rate of decrease in chromatic sensi-tivity with decreasing retinal illuminance provides additional information about the health of the retina that can be used to separate changes caused by normal aging and disease. Pupil size and prereceptoral absorption of short wavelength light were measured for each subject in order to obtain a better estimate of effective retinal illuminance. RG and YB color thresholds were assessed separately in order to establish whether the two mechanisms perform differently with changes in retinal illuminance and/or aging.
2. METHODS
A. SubjectsThe subjects were recruited by advertising the study locally within City University. The tests were approved by the City University Research and Ethics Committee and the study ad-hered to the principles of the Declaration of Helsinki. All sub-jects granted informed consent and underwent a full ophthalmic assessment, including measurement of corrected and/or uncorrected visual acuity, refraction for 2.5 m and 0.7 m, pupil reactions, intraocular pressure measurements, and indirect ophthalmoscopy. All subjects had normal color vision and healthy eyes with no history of ocular disease, sur-gery, or laser treatment. None of the subjects enrolled in the study suffered from any diseases or took any medication known to affect color vision.
B. Color Assessment
Every subject was assessed for color vision using the Color Assessment and Diagnosis (CAD) test, which employs dy-namic luminance contrast noise to isolate the use of color sig-nals without affecting the subject’s chromatic sensitivity [18,20]. The test stimuli were generated on a visual display (LaCie Electron Blue, 20 in. CRT monitor) using an ELSA Gloria XL graphics card with 30 bit resolution (ELSA Optical Technology Inc., Aachen, Germany). The monitor was ad-justed for stable operation and its spectral and luminance ca-libration were carried out with a Minolta CS-2000 telespectroradiometer and an LMT-1003 luminance meter, re-spectively. A hood fitted with a chin/forehead rest was placed 2.5 m away from the display and provided support for the po-sitioning of the subject’s head. The subject viewed the display monocularly and the RG and YB color thresholds were mea-sured for screen luminances of 2.6, 7.8, 26, and65cd∕m2. The CIE x; y chromaticity of the uniform background (0.305, 0.323) was close to that of the D65 illuminant and remained unchanged for all background luminances. Before the start of each experiment, the display was allowed to warm up for∼25min, the subject adapted to the corresponding display background for∼2min, and the order of selection of the four screen luminances was randomized.
The measurement procedure was described fully in earlier publications [20,27]. The CAD test has been employed in a number of previous studies that involved mostly young sub-jects, usually less than 50 years old, to examine how various parameters, such as the screen luminance, stimulus size, level of light adaptation of the eye, and stimulus eccentricity, affect chromatic sensitivity [19,20]. For convenience, the measure-ments are expressed in standard normal (SN) CAD units, which reflect the mean RG and YB thresholds measured in 330 normal trichromats [18]. A subject with unit threshold per-forms as well as the median normal trichromat. In terms of cone-specific signal changes, the RG median standard CAD observer thresholds correspond to ∼0.75% and ∼0.4% M-and L-cone contrast, respectively. The YB median threshold, on the other hand, corresponds to∼8%S-cone contrast [20]. The lower normal sensitivity for detection of yellow–blue changes may be due to the much reduced S-cone density in the retina [28], but when expressed in SN CAD units, the median thresholds correspond to one unit for both RG and YB discrimination.
C. Pupil Measurements
Pupil diameter was measured using the P_SCAN 100 system [29]. The instrument employs infrared video imaging techni-ques to measure the center coordinates of the pupil and com-pute its size [30] A pulsed, infrared illumination system is used to illuminate the iris for∼4ms within each image frame in order to eliminate pupil image smear caused by eye move-ments. The system is focused as the patient fixates the center of the screen. Several pupil measurements were averaged, with the subject viewing monocularly a uniform background of 2.6, 7.8, 26, and 65cd∕m2, under conditions identical to those employed for the CAD test.
D. Estimates of Lens and Macular Pigment Optical Density
The Macular Pigment Optical Density (MPOD) profile and the short wavelength absorption of the crystalline lens were
mea-sured with the Macular Assessment Profile (MAP) test [31]. The instrument employs an optical notch filter to separate the outputs of the three phosphors into two components, the test beam and the reference beam. The short wavelength (SW) test beam is absorbed maximally by the macular pig-ment (MP) and the crystalline lens, whereas the reference beam consists of long wavelength (LW) light that is not ab-sorbed significantly by prereceptoral filters or by the MP. The two beams are modulated sinusoidally in counterphase at 17 Hz. The stimuli are generated on a high-luminance, 17 in., CRT display (using an ELSA Gloria XL graphics card) at a frame rate of 140 Hz. The MAP test was designed to mea-sure the spatial profile of the MP optical density at a number of stimulus eccentricities (i.e., 0°, 0.8°, 1.8°, 2.8°, 3.8°, 6.8°, and 7.8°) [27]. The test stimulus changes from a 0.36° diameter disk, when presented at the fovea, to a sector annulus at all other eccentricities, while the width of the annulus increases with eccentricity to facilitate flicker detection. The subject’s task is to cancel the perception of flicker by adjusting the lu-minance of the test beam using a modified staircase with vari-able step sizes until the perception of flicker is canceled. At the flicker-null point, the threshold is recorded. Both the low-er and the highlow-er flicklow-er-null thresholds wlow-ere measured at each eccentricity and the average of the two thresholds was then recorded. Four, randomly interleaved, repeat mea-surements were made at each spatial location investigated.
The MP is assumed to have negligible effects on the absorp-tion of blue light beyond 5° to 7° from the fovea [32]. In the MAP test, all measurements are referenced to the mean value measured at 6.8° and 7.8° eccentricity. The crystalline lens continues to absorb the SW blue test beam in the same way, irrespective of stimulus eccentricity. The luminance of the SW test beam needed to cancel the perception of flicker at the largest eccentricity reflects only the absorption of SW light by the lens and not the MP. The average lens transmit-tance (TAVG) for the short wavelength light that makes up the
test beam is given by
TAVG
R780
380RTLλLBλdλ
780
380LBλdλ ;
(1)
whereTLλis the spectral transmittance of the lens andLBλ is the wavelength radiance distribution of the SW (blue) test beam employed in the MAP test. The latter peaks at∼450nm and has a half-maximum spectral width of28nm [27]. The integration is carried out over the wavelength range of 380 to 780 nm. Although the absolute TAVG value cannot be
mea-sured, the technique makes it possible to estimate the sub-ject’s lens optical density for SW light with respect to the mean density measured in young observers. Previous experi-ments involving 35 young subjects yielded a measure of the mean luminance of the SW test beam. The optical density of the lens for any subject can be measured with respect to the young subject group (i.e., the mean value for 24 subjects, less than 24 years old):
ODlog10Lp
Lo; (2)
median threshold value for the young subject group at the same eccentricity [27]. A negative value for optical density means that the subject’s lens absorption of blue light is less than the mean value for the young subject group. The test was performed monocularly at a viewing distance of 0.7 m. A full description of the MAP test, including the spatial con-figuration of the stimuli, has been given elsewhere [31].
E. Estimating Retinal Illuminance
Retinal illuminance (E) was computed after accounting for pupil size and the combined SW transmittance of the lens and the MP. RG thresholds depend on signal changes in L and M cones, which are affected much less by absorption of SW light. The measure of retinal illuminance for RG color vision assessment was therefore based only on screen lumi-nance (L) and the pupil area (P):
EL·P. (3)
Since YB color thresholds as measured in the CAD test rely only on S-cone signal changes [20], an appropriate estimate of retinal illuminance for SW light should take into account the optical density of the lens and the average absorption of blue light by the MP. The total displacement of the moving colored stimulus in the CAD test covers a visual angle of ∼2.9°. It was, therefore, deemed appropriate to use the aver-age MPOD value provided by the MAP test over the central
2.8°. The calculation of retinal illuminance for SW light in-cluded the combined transmittance of the lens and the macu-lar pigment:
EL·P·TC. (4)
.
F. HRindex
The HRindexcaptures the subject’s color detection sensitivity
as a function of light level in the low photopic, high mesopic range. The group data provides an average measure of the rate of change of threshold sensitivity with light level. The HRindex
reflects the fractional difference between the area under the subject’s threshold curve and the corresponding median curve for the group (see Appendix A).
G. Statistical Analysis
The JMP statistical software program was used to fit the non-linear function that describes the variation in the subject’s threshold with retinal illuminance (SAS Institute Inc., Cary, North Carolina). The MATLAB (The MathsWorks, Inc.) stats module was used to estimate the density functions for the measured HRindex values and to compute the equivalent
2σlimits.
3. RESULTS
The three principal variables that affect retinal illuminance when viewing a stimulus display of known luminance, L, are shown in Fig. 1. Figure 1(a) shows the optical density of the crystalline lens for absorption of SW light for each of the subjects investigated in this study. Figure1(b)shows the mean pupil diameter for each subject measured when viewing the uniform screen of luminance26cd∕m2. Similar data were obtained for the remaining three screen luminances employed. Figure1(c)shows an example of the spatial profile of the MP optical density measured using the MAP test [31]. These data were used to calculate the average transmittance of the MP over the central2.8°. A measure of retinal illumi-nance was then computed for each subject and each light level separately.
The effect of pupil size changes on effective retinal illumi-nance can also be confounded with the associated changes in directional sensitivity of cones [34,35]. The Stiles–Crawford effect is difficult to account for accurately when the area of the retina stimulated is not restricted to the fovea [36] and when the entry pupil location for peak maximum sensi-tivity is not known [37].
In order to appreciate the magnitude of the changes in ef-fective retinal illuminance that can be caused by the Stiles– Crawford effect, we assumed the center of the pupil as the entry point of peak sensitivity and computed the change in effective retinal illuminance for the pupil data shown in
10 30 50 70 90
Age (years)
-0.05 0.15 0.35 0.55
Lens
OD (lo
g uni
ts)
0 2 4 6 8 Eccentricity (deg) -0.2
0 0.2 0.4 0.6 0.8 1
Peak MP
Optic
al Densit
y
(a) (b) (c)
10 30 50 70 90
Age (years)
0 2.5 5 7.5 10
Pupil diame
ter (mm)
Fig. 1. (Color online) (a) Measurements of lens absorption of short wavelength light as a function of age for the group of subjects investigated in this study (age range: 16 to 79 years). The age distribution of the subjects is shown as an inset in Fig.3(a). The optical density in Fig. 1(a) describes the average absorption of short wavelength light by the lens [as given by Eq. (1)] when referenced to young subjects (i.e.,<24 years) for light of spectral radiance equivalent to that employed in the MAP test. The latter peaks at∼450nm and has a half-maximum spectral width of28nm [27]. The integration is carried out over the wavelength range of 380 to 780 nm. The dotted curve in (a) represents a second-order polynomial fit that accounts for∼40%of the measured variability. Panel (b) shows the average pupil size as a function of age when viewing monocularly the visual display for a screen luminance of26cd∕m2, under conditions identical to those employed in the CAD test. The dotted curve shows the best linear fit and is given by:y5.96−0.0315x,r20.47. Unless otherwise stated, a least-squares, straight line was fitted to the data and the goodness of the fit is described by the square of the product moment correlation coefficient. Panel (c) shows a typical spatial profile for the macular pigment optical density measured with the MAP test [31]. The dotted curve represents the best exponential fit of the form, OD0.832exp−0.609θ, whereθ
Fig.1(b). When integrated over the pupil, the change in lumi-nous efficiency at either extreme (i.e., 2.75 and 7.1 mm) with respect to the efficiency computed for the mean pupil size (i. e., 4.36 mm) is less than 0.14 log units. Corrections have not, therefore, been made to account for changes in effective ret-inal illuminance caused by the Stiles–Crawford effect.
The RG and YB thresholds measured in 237 normal trichro-mats as part of an earlier study [38] for a screen luminance of 24cd∕m2are shown in Fig.2as a function of age. The inset in Fig.2(a)shows the age distribution within this group, with a mean and standard deviation of 29.5 and 9.7 years, respec-tively. The measurements were carried out binocularly, under optimum conditions, and show little or no effects of aging, but the sample includes only a small number of subjects above 45 years of age.
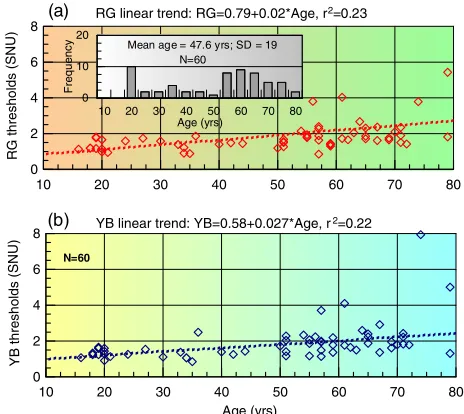
Figure3shows similar thresholds measured monocularly for a screen luminance of 26cd∕m2 in a smaller group of 60 subjects examined in this study. These subjects were se-lected to spread more uniformly the age range of 16 to 79 years. The inset in Fig. 3(a) shows the age distribution of the subjects with a mean and standard deviation of 47.6 and 19 years, respectively. Figure4shows the thresholds mea-sured for all four screen luminances (2.6, 7.8, 26, and 65cd∕m2) as a function of the corresponding retinal illumi-nance, with appropriate correction for pupil size [Eq. (3)] and, in the case of YB thresholds, with additional correction for the mean absorption of SW light by the lens and the ma-cular pigment [Eq. (4)].
The HRindexwas then computed separately for each subject,
as described in Appendix A. When expressed as standard
de-viations from the mean, five of the subjects had indices well outside the normal range and were removed from the sample. The frequency distributions and the equivalent2σlimits of the recomputed RG and YB HRindexvalues for the 55 normal
subjects included in the analysis are shown in Fig.6. The re-vised analysis identifies only two subjects as lying just margin-ally outside the−2σlimit. The computed HRindex values are
shown as a function of subject’s age in Fig. 7 for RG and
10 20 30 40 50 60 70 80 Age (yrs) 2 4 6 8 Y B th re s h o ld s (S N U )
10 20 30 40 50 60 70 80 0 2 4 6 8 R G th re s h o ld s (S N U )
10 15 20 25 30 35 40 45 50 55 65 Age (yrs) 0 25 50 75 F re q u e n c y N=237 Mean age = 29.5 yrs; SD = 9.7
N=237
RG linear trend: RG=0.9923+0.001278*Age, r2=0.005
YB linear trend: YB=0.8549+0.0058*Age, r2=0.06
(a)
(b)
Fig. 2. (Color online) Measurements of color detection thresholds, expressed in standard normal units (SNU), in a group of 237 subjects when adapted to a uniform screen of luminance of24cd∕m2. The standard normal CAD units are based on the mean RG and YB thresh-olds measured in 330 normal trichromats [18]. According to this de-finition, the median normal trichromat has a threshold of 1 SNU. A threshold of 2 SNU means that the subject requires twice the color signal strength of the median normal trichromat. In cone contrast space, this corresponds approximately to doubling the cone photore-ceptor contrasts [39].The inset histogram shows the age distribution within the group with a mean age of 29.5 years. The display was viewed with both eyes under optimum conditions and the measure-ments were carried out using the CAD test. The effects of age on the measured thresholds are very small (r2<0.06) [38].
10 20 30 40 50 60 70 80 0 2 4 6 8 R G th re s h o ld s (S NU)
10 20 30 40 50 60 70 80 Age (yrs) 0 2 4 6 8 Y B th re s h o ld s (S N U) N=60
10 20 30 40 50 60 70 80 Age (yrs) 0 10 20 F re q u e n c
y Mean age = 47.6 yrs; SD = 19 N=60
RG linear trend: RG=0.79+0.02*Age, r2=0.23
YB linear trend: YB=0.58+0.027*Age, r2=0.22
(a)
[image:5.594.316.548.44.251.2](b)
Fig. 3. (Color online) Monocular measurements of color detection thresholds in a group of 60 subjects when adapted to a uniform back-ground field of26cd∕m2. The subjects were more uniformly distrib-uted as a function of age (ranging from 16 to 79 years). The inset histogram shows the age distribution within the group with a mean of 47.6 years). The effects of age are significant for RG and YB detec-tion thresholds, as indicated by the dotted curves (r20.23 and r20.22, respectively, andp <0.001).
0 250 500 750 1000 1250 1500 1750 2000
0 2 4 6 8 R G th re s h o ld( S N U )
25 325 625 925
0 2 4
0 250 500 750 1000 1250 1500 1750 2000
E (retinal illuminance, Tds) 0 2 4 6 8 Y B th re s h o ld (S N U )
25 325 625 925
0 2 4
0.7726 RG=37.19·E− +1.186
0.614 YB 18.64·E= − +0.855
(a)
(b)
[image:5.594.55.283.399.596.2]YB thresholds. Black symbols are used to identify the seven subjects (i.e., 11.7% of the group) with HRindexvalues well
out-side the normal limits.
4. DISCUSSION
Aging causes structural changes in the retina as well as in-creased absorption and scatter of light by the optics of the eye. The latter reduces the amount of light that reaches the retina and alters selectively its spectral composition. Such changes affect many aspects of visual performance and, in particular, contrast sensitivity and our ability to detect rapid flicker and small color differences at lower light level. As one grows older, color vision is arguably affected most because of changes in the retina and the more extensive spatial proces-sing associated with the extraction of color signals. Diseases of the retina are also more common in old age and almost in-variably lead to rapid worsening of color vision. Deciding what is normal aging and what is indicative of retinal disease remains a challenge, particularly when the aim is to detect the earliest stages of disease.
Retinal illuminance can have a large effect on the proces-sing of retinal signals and, hence, on various measures of vi-sual performance, such as reading, contrast acuity and driving [1,40,41]. Color vision thresholds are also affected at lower light levels in normal subjects and particularly the detection of YB color differences [19,42]. Knoblauch and his colleagues also showed that performance on the FM100 test worsens with increasing age, but the differences reduced at higher light levels [43]. Reduction in retinal illuminance caused by pupil miosis and selective absorption of SW light by the lens in older subjects can cause significant, additional loss of YB chromatic sensitivity, particularly when the ambient illumination is al-ready low. Intersubject differences in retinal illuminance cause increased variability in color thresholds and this makes it even more difficult to detect the presence of early stages of retinal pathology. The age distribution of the subjects, the light level employed, and whether color thresholds are mea-sured monocularly, so as to reveal eye-specific changes in chromatic sensitivity, or binocularly, to indicate overall func-tional performance, can affect significantly the magnitude and the variability of the thresholds measured, as well as the ob-served correlation with age. Monocular thresholds tend to
25 150 275 400 525 650 775 900
0 3 6 9 Y B th re s h o ld s (S N U
) 36 yrs (HR = -0.64)
Group data
Measured YB thresholds
(c) (d)
(f) (e)
25 150 275 400 525 650 775 900
E (retinal illuminance, Tds) 0 3 6 9 R G th re s h o ld s (S N U )
70 yrs (HR = -0.31) Measured RG thresholds Group data
25 150 275 400 525 650 775 900
E (retinal illuminance, Tds) 0 3 6 9 Y B th re s h o ld s (S N U
) 70 yrs (HR = -0.36)
Group data
Measured YB thresholds
25 150 275 400 525 650 775 900
0 3 6 9 R G th re s h o ld s (S N U )
36 yrs (HR = -0.33) Group
Measured RG thresholds
(a) (b)
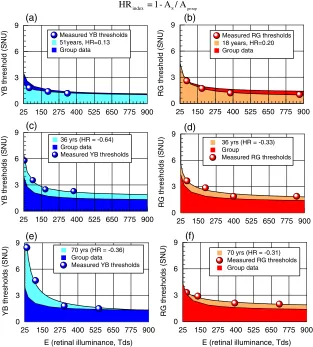
S group index
HR = 1- A / A
25 150 275 400 525 650 775 900
0 3 6 9 R G th re s h o ld (S N U )
Measured RG thresholds 18 years, HR=0.20 Group data
25 150 275 400 525 650 775 900
0 3 6 9 Y B th re s h o ld (S N U )
[image:6.594.144.457.305.652.2]Measured YB thresholds 51years, HR=0.13 Group data
Fig. 5. (Color online) Examples of YB and RG color thresholds and the corresponding HRindexvalues for young and old subjects. The HRindexis
defined as the difference in area under the subject’s threshold curve (AS) and the normal group (Agroup) expressed as a fraction of the area for the
group, as illustrated in each diagram. The mean pupil size and the absorption of the lens and the MP (in the case of YB thresholds) affect the subject’s retinal illuminance. The optimum threshold measured at the highest illuminance together with the rate of increase in thresholds with decreasing retinal illuminance determine the subject’s HRindex. Panel (a) shows data in an 18-year-old subject with a positive HRindexindicative of
show increased variability and also to be significantly larger, even in young normal subjects, as can be seen by examining and comparing the data shown in Figs.2and3. Preliminary findings show that the ratio of monocular to binocular thresh-olds shows large intersubject variability with extreme values of 1 and 1.86. A subject’s improvement can, therefore, differ significantly from statistical predictions based on indepen-dent, stimulus correlated signals and uncorrelated noise (i.e.,
2
p
∼1.41) [44]. To reveal eye-specific loss of retinal sensitiv-ity, one needs to measure monocular thresholds and to ac-count for large changes in retinal illuminance caused by the principal factors shown in Fig. 1. When these factors are accounted for, the variation in color thresholds with ret-inal illuminance is more likely to reflect the properties of the retina. Figure 4 shows the fitted functions, which describe well the dependence of RG and YB thresholds on retinal illu-minance. Above some 300 trolands (Tds) the data show rela-tively small intersubject variability, but both thresholds increase rapidly at lower retinal illuminances, with very large variability below some 125 Tds. The HRindexcaptures both the
subject’s best color threshold, as represented by the param-eterTo(see Appendix A), as well as the rate of increase in color threshold with decreasing retinal illuminance. The choice of the low integration limit was constrained by the need to have an accurate prediction of the subject’s threshold at the lowest effective retinal illuminances measured, with several values in the range of 20 and 30 Tds (Fig.4). 25 Tds was therefore selected as the lower integration limit. The upper integration limit was selected as 900 Tds simply be-cause the rate of decrease in thresholds above this limit is very small. Any higher value would overrepresent the contribution the parameterTomakes to the area under the subject’s curve and this, in turn, would reduce the relative contribution the higher thresholds, measured at lower retinal illuminances, make to the area under the subject’s curve. Figure5shows both RG as well as YB thresholds and the corresponding
HRindex values. Positive values indicate better than average
performance. Figure5(b)shows data for an 18-year-old sub-ject with an HRindexof 0.2, caused largely by lower than
aver-age thresholds at higher retinal illuminances. Figure 5(a)
shows a 51-year-old subject with slightly larger than average thresholds at high retinal illuminances and an index of 0.13. The positive HRindex for YB thresholds reflects the subject’s
smaller than average thresholds at low retinal illuminances, in spite of his age. The remaining graphs show negative HRindex values caused either by higher overall thresholds
[Figs.5(c),(d)and(f)], or a rapid increase in YB thresholds at lower retinal illuminances [Fig.5(e)] with normal thresh-olds at high retinal illuminances. The ratio of the area under of the curve fitted to the group data and that of a single subject provides a measure of overall chromatic sensitivity:
Agroup
AS
1 1HRindex
. (5)
The2σlimits shown in Fig.6convert to a threefold var-iation in RG and a 3.6-fold varvar-iation in YB chromatic sensitiv-ity. As an overall measure of chromatic sensitivity over a range of light levels in the high mesopic and the photopic range, the computed variation in chromatic sensitivity for the normal group is relatively small. The HRindexshows only
a small correlation with age within the normal group up to 79 years of age. The inevitable conclusion of these findings is that
[image:7.594.316.547.43.311.2](a) (b)
Fig. 6. (Color online) Frequency distribution of HRindexvalues within
the normal group (N55) were computed for both YB and RG thresholds and are shown together with the corresponding, best-fit probability density functions. The 95% limits were estimated from the fitted functions shown by computing the cumulative probability values that correspond to2σlimits on the normal distribution.
10 20 30 40 50 60 70 80 90
-4 -3 -2 -1 0 1
H
Rin
d
e
x
(R
G
)
RG HRindex 95% limits
10 20 30 40 50 60 70 80 90
Age (years) -4
-3 -2 -1 0 1
H
Rin
d
e
x
(Y
B
)
YB HRindex 95% limits
(a)
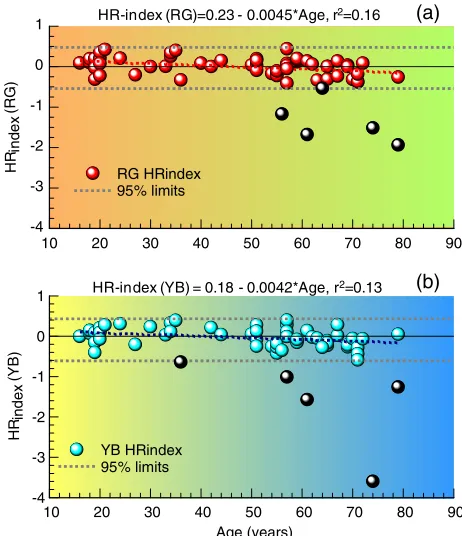
(b) HR-index (RG)=0.23 - 0.0045*Age, r2=0.16
[image:7.594.51.267.469.648.2]HR-index (YB) = 0.18 - 0.0042*Age, r2=0.13
Fig. 7. (Color online) HRindexvalues plotted as a function of age for
the 60 subjects investigated in this study. The2σlimits are shown as dotted curves. Age appears to have only a small effect on the HRindex
for both RG and YB color vision, for subjects falling within the2σ limits (r20.16andr20.13, respectively, andp <0.001). The lin-ear regression lines indicated above each graph are based only on the subjects who had HRindiceswithin the specified limits. Seven subjects
(∼11%) produced HRindexvalues that fall below the−2σlimit; two
normal aging has only a small effect on overall chromatic sen-sitivity when examined in the photopic and high mesopic range. A 75-year-old subject can, therefore, match the color vision performance of a 20-year-old subject, provided retinal illuminance is adjusted for pupil size and additionally for pre-receptoral absorption of light by the lens and the MP, in the case of YB color discrimination.
Although the great majority of subjects stay well above the computed−2σlimit, approximately 11% fall below this limit (Fig.7). It is of interest to discuss the significance of this find-ing in relation to the earliest detection of retinal disease. The subjects identified as abnormal do not present any clinically recognizable signs of disease and are asymptomatic. Accord-ing to routine optometric/ophthalmological examination, these subjects would be designated as “clinically normal.” As pointed out recently [45], it is important to have sensitive and objective criteria that experts can use to decide whether small changes in vision in older subjects can be attributed en-tirely to normal aging or reflect early signs of retinal pathol-ogy. Since visual performance at lower light levels is more compromised in patients with early signs of ocular pathology [4] and the effects of mild acute hypoxia in normal subjects are also more detectable at lower light levels [5,6,46,47], it may be desirable to assess changes in visual performance over a range of light levels and not just photopic vision under op-timum conditions. Indeed, if the HRindexdoes reflect retinal
susceptibility to disease, and hence hypoxia, imposed mild systemic hypoxia may exacerbate the loss of chromatic sen-sitivity as reflected in the HRindex, more so in older subjects
and/or those with more severe damage to the retina. If sub-jects who are clinically normal, but have HRindexvalues well
below−2σ, are more likely to develop retinal disease, then they might also exhibit more severe hypoxic impairment of color vision than age controls, with HRindexvalues within the
normal range. Further studies are needed to test these hypoth-eses. Assessments carried out at even lower light levels may not be clinically as valuable since variability in results is also increased [40]. The light levels employed in the HR test may, therefore, represent a good compromise by assessing photo-pic and high mesophoto-pic color vision and, hence, avoiding in-creased variability and variation in rod–cone interaction effects that are to be expected at even lower light levels.
5. CONCLUSIONS
The HRindexcaptures the loss of chromatic sensitivity in the
photopic and upper mesopic range. After correction for changes in retinal illuminance, the HRindexshows only a small
correlation with age (r2∼0.1) for both RG and YB color vi-sion. The normal range of HRindexvalues is tightly distributed
around zero, with positive values indicating better than aver-age performance. The preliminary findings in the small group of asymptomatic and clinically normal subjects examined in this study show that∼11%of the population exhibit HRindex
values outside the normal range. There is also a high probabil-ity that subjects that fall outside the normal range exhibit both RG and YB loss.
All subjects tested and identified clinically with some form of retinal disease, such as age-related macular degeneration and diabetic retinopathy, exhibited grossly abnormal indices for both RG and YB color vision.
The HRindexindex captures in a single parameter the
sub-ject’s chromatic sensitivity and how this changes with light level, irrespective of age. A longitudinal study is needed to es-tablish whether the subjects identified as outside the normal range according to their HRindexvalues go on to develop
clini-cally recognizable retinal or systemic disease.
The preliminary findings reported here suggest that the new HRindexyields information about the overall health of the
re-tina and may be useful to detect early, preclinical signs of ret-inal or systemic diseases that affect vision.
The approach developed here can also be applied to study how sensitivity to rapid flicker detection or contrast sensitiv-ity for letter recognition worsen with decreasing light level in older subjects. Capturing the signals of the dark may provide the methodology needed to separate the effects of normal aging from disease. It remains to be established which of these aspects of visual performance is most informative and appro-priate to describe the effects of normal aging and to detect the earliest signs of disease.
APPENDIX A: COMPUTATION OF
HR
INDEX The change in color detection thresholds as a function of ret-inal illuminance (Fig.4) can be fitted well by an equation of the formTk×E−aTo; (A1)
whereT is the measured color threshold,Eis the retinal illu-minance,Tois the asymptotic threshold (i.e., the subject’s ex-pected, best threshold at a high retinal illuminance) [19], andk andαare constants. The best-fit parametersk,α, andTowere computed for the group of subjects and the fitted curves for RG and YB for the group thresholds are shown in Figs.4(a)
and4(b), respectively.
Equation (A1) was then integrated to compute the area un-der the curve for RG and YB thresholds [Figs.4(a)and4(b), insets]:
AZ900
25 k×E
−aT odE
k
1−a×E1−aToE
900
25
.
(A2)
The fitted curve for the group was used as a reference against which every subject was then compared. Equa-tions (A1) and (A2) were then used separately to compute the subject-specific threshold dependence on retinal illumi-nance and the corresponding HRindex. To improve the stability
of the nonlinear fitting algorithm, a fifth point was added to the dataset to correspond to twice the subject’s largest retinal illuminance. The threshold for the fifth point was fixed as 85% of the threshold measured at the highest retinal illuminance. This chosen reduction in threshold is justified since the dou-bling of the screen luminance from 26 to65cd∕m2causes a similar reduction in mean threshold for the group data.
The HRindexwas defined as the difference between the area
under the subject’s threshold curve (AS) and the correspond-ing area computed for the normal group (Agroup):
A positive HRindex indicates performance better than the
average normal subject. Correspondingly, a negative value in-dicates color detection performance that falls below that ex-pected for the average normal subject. Examples of RG and YB thresholds, measured in subjects of varying age, together with the corresponding best-fit curves, are shown in Fig.5. The limits listed in Fig.6represent HRindexvalues for which
the cumulative probability computed from the fitted functions (shown in Fig.6) corresponds to the2σlimits on the normal probability distribution curve.
ACKNOWLEDGMENTS
We are grateful to Dr. Desmond Connolly (QinetiQ Ltd.), Prof. Pete Coffey (Institute of Ophthalmology, London), and Dr. Marisa Rodriguez-Carmona (City University London) for valu-able discussions and the critical reading of the manuscript. We also acknowledge City University London for funding E. Kon-stantakopoulou and the Engineering and Physical Sciences Research Council (EPSRC, Grant EP/G044538/1) for support with the equipment used in this study.
REFERENCES
1. C. Owsley, G. McGwin Jr., K. Scilley, and K. Kallies,“ Develop-ment of a questionnaire to assess vision problems under low lu-minance in age-related maculopathy,”Invest. Ophthalmol. Vis. Sci.47, 528–535 (2006).
2. R. A. Weale,“Senile ocular changes, cell death, and vision,”in
Aging and Human Visual Function, R. Sekuler, D. Kline, and K. Dismukes, eds. (Liss, 1982), pp. 161–171.
3. C. Owsley and G. McGwin Jr.,“Vision and driving,”Vision Res. 50, 2348–2361 (2010).
4. A. Petzold and G. T. Plant,“Clinical disorders affecting mesopic vision,”Ophthalmic Physiol. Opt.26, 326–341 (2006). 5. D. M. Connolly and J. L. Barbur, “Low contrast acuity at
photopic and mesopic luminance under mild hypoxia, normox-ia, and hyperoxnormox-ia,” Aviat. Space Environ. Med.80, 933–940 (2009).
6. D. M. Connolly, J. L. Barbur, S. L. Hosking, and I. R. Moorhead, “Mild hypoxia impairs chromatic sensitivity in the mesopic range,”Invest Ophthalmol. Vis. Sci.49, 820–827 (2008). 7. B. Feigl, D. Cao, C. P. Morris, and A. J. Zele,“Persons with
age-related maculopathy risk genotypes and clinically normal eyes have reduced mesopic vision,”Invest. Ophthalmol. Vis. Sci.52, 1145–1150 (2011).
8. I. E. Loewenfeld,“Pupillary changes related to age,”inTopics in Neuro-ophthalmology, H. S. Thompson, R. Daroff, L. Frisén, J. S. Glaser, and M. D. Sanders, eds. (Williams and Wilkins, 1972), pp. 124–150.
9. I. E. Loewenfeld,The Pupil: Anatomy, Physiology, and Clinical Applications(Butterworth and Heinemann, 1999).
10. F. S. Said and W. S. Sawires,“Age dependence of changes in pupil diameter in the dark,”Opt. Acta19, 359–361 (1972). 11. J. Pokorny, V. C. Smith, and M. Lutze,“Aging of the human lens,”
Appl. Opt.26, 1437–1440 (1987).
12. P. A. Sample, F. D. Esterson, R. N. Weinreb, and R. M. Boynton, “The aging lens: in vivo assessment of light absorption in 84 hu-man eyes,”Invest Ophthalmol. Vis. Sci.29, 1306–1311 (1988). 13. P. Artal, A. Guirao, E. Berrio, P. Piers, and S. Norrby,“Optical
aberrations and the aging eye,”Int. Ophthalmol. Clinics 43, 63–77 (2003).
14. C. A. Curcio, C. L. Millican, K. A. Allen, and R. E. Kalina,“Aging of the human photoreceptor mosaic: evidence for selective vul-nerability of rods in central retina,”Invest. Ophthalmol. Vis. Sci. 34, 3278–3296 (1993).
15. S. L. Elliott and J. S. Werner, “Age-related changes in con-trast gain related to the M and P pathways,” J. Vis. 10, 4 (2010).
16. S. L. Elliott, S. S. Choi, N. Doble, J. L. Hardy, J. W. Evans, and J. S. Werner, “Role of high-order
aberr-ations in senescent changes in spatial vision,” J. Vis. 9, 24 (2009).
17. C. E. Wright and N. Drasdo,“The influence of age on the spatial and temporal contrast sensitivity function,”Doc. Ophthalmol. 59, 385–395 (1985).
18. M. Rodriguez-Carmona, “Variability of chromatic sensitivity: fundamental studies and clinical applications,”Ph.D. disserta-tion (City University London, 2006).
19. J. L. Barbur, M. Rodriguez-Carmona, and A. J. Harlow,“ Estab-lishing the statistical limits of“normal”chromatic sensitivity,” publication CIE x030:2006 (Commission Internationale de l’ E-clairage, 2006).
20. J. L. Barbur and D. M. Connolly,“Effects of hypoxia on colour vision with emphasis on the mesopic range,” Expert Rev. Ophthalmol.6, 409–420 (2011).
21. K. Shinomori, B. E. Schefrin, and J. S. Werner, “Age-related changes in wavelength discrimination,”J. Opt. Soc. Am. A18, 310–318 (2001).
22. G. Haegerstrom-Portnoy,“Short-wavelength-sensitive-cone sen-sitivity loss with aging: a protective role for macular pigment?,” J. Opt. Soc. Am. A5, 2140–2144 (1988).
23. K. Knoblauch, F. Vital-Durand, and J. L. Barbur,“Variation of chromatic sensitivity across the life span,” Vision Res. 41, 23–36 (2001).
24. G. Verriest, J. v. Laethem, and A. Uvijls,“A new assessment of the normal ranges of the Farnsworth-Munsell 100-hue test scores,”Am. J. Ophthalmol.93, 635–642 (1982).
25. B. E. Schefrin, K. Shinomori, and J. S. Werner,“Contributions of neural pathways to age-related losses in chromatic discrimina-tion,”J. Opt. Soc. Am. A12, 1233–1241 (1995).
26. M. O’Neill-Biba, S. Sivaprasad, M. Rodriguez-Carmona, J. E. Wolf, and J. L. Barbur,“Loss of chromatic sensitivity in AMD and diabetes: a comparative study,”Ophthalmic Physiol. Opt. 30, 705–716 (2010).
27. M. Rodriguez-Carmona, J. Kvansakul, J. A. Harlow, W. Kopcke, W. Schalch, and J. L. Barbur,“The effects of supplementation with lutein and/or zeaxanthin on human macular pigment den-sity and colour vision,”Ophthalmic Physiol. Opt.26, 137–147 (2006).
28. P. K. Ahnelt, H. Kolb, and R. Pflug,“Identification of a subtype of cone photoreceptor, likely to be blue sensitive, in the human retina,”J. Comp. Neurol.255, 18–34 (1987).
29. E. Alexandridis, J. A. Leendertz, and J. L. Barbur, “Methods of studying the behaviour of the pupil,”J. Psychophysiol.5, 223–239 (1992).
30. J. L. Barbur and W. D. Thomson,“Pupil response as an objective measure of visual acuity,”Ophthalmic Physiol. Opt.7, 425–429 (1987).
31. J. L. Barbur, E. Konstantakopoulou, M. Rodriguez-Carmona, J. A. Harlow, A. G. Robson, and J. D. Moreland,“The Macular Assessment Profile test—a new VDU-based technique for mea-suring the spatial distribution of the macular pigment, lens den-sity and rapid flicker sensitivity,”Ophthalmic Physiol. Opt.30, 470–483 (2010).
32. T. T. Berendschot and D. van Norren,“Macular pigment shows ringlike structures,” Invest. Ophthalmol. Vis. Sci.47, 709–714 (2006).
33. D. M. Snodderly, J. A. Mares, B. R. Wooten, L. Oxton, M. Gruber, and T. Ficek,“Macular pigment measurement by heterochro-matic flicker photometry in older subjects: the carotenoids and age-related eye disease study,” Invest. Ophthalmol. Vis. Sci.45, 531–538 (2004).
34. W. S. Stiles and B. H. Crawford,“The luminous efficiency of rays entering the eye pupil at different points,”Proc. R. Soc. London B112, 428–450 (1933).
35. G. Westheimer,“Directional sensitivity of the retina: 75 years of Stiles-Crawford effect,”Proc. R. Soc. B Biol. Sci.275, 2777–2786 (2008).
36. G. Westheimer, “Dependence of the magnitude of the Stiles-Crawford effect on retinal location,”J. Physiol. 192, 309–315 (1967).
38. J. L. Barbur, M. L. Rodriguez-Carmona, S. Evans, and N. Milburn, “Minimum colour vision requirements for professional flight crew. Recommendations for new colour vision standards,” Pa-per 04/2009 (Civil Aviation Authority, UK, 2009),http://www.caa .co.uk/caapaper200904.
39. M. Rodriguez-Carmona and J. L. Barbur,“Assessing the severity of color vision loss with implications for aviation and other oc-cupational environments,”Aviat. Space Environ. Med.83, 19–29 (2011).
40. J. L. Barbur and A. Stockman,“Photopic, mesopic and scotopic vision and changes in visual performance,”inEncyclopedia of the Eye, D. Dartt, J. C. Besharse, and R. Dana, eds. (Elsevier, 2010), pp. 323–331.
41. D. W. Kline, T. J. Kline, J. L. Fozard, W. Kosnik, F. Schieber, and R. Sekuler,“Vision, aging, and driving: the problems of older dri-vers,”J. Gerontol.47, 27–34 (1992).
42. H. C. Walkey, J. L. Barbur, A. Harlow, and W. Makous,“ Measure-ments of chromatic sensitivity in the mesopic range,”Color Res. Appl.26, S36–S42 (2001).
43. K. Knoblauch, F. Saunders, M. Kusuda, R. Hynes, M. Podgor, K. E. Higgens, and M. deMosasterio,“Age and illuminance ef-fects in the Farnsworth-Munsell 100-hue test,”Appl. Opt.26, 1441–1448 (1987).
44. E. H. Bárány, “A theory of binocular visual acuity and an analysis of the variability of visual acuity,”Acta Ophthalmol. 27, 63–92 (1946).
45. C. Owsley,“Aging and vision,”Vision Res.51, 1610–1622 (2011). 46. V. C. Smith, J. T. Ernest, and J. Pokorny,“Effect of hypoxia on FM100-Hue test performance,” Mod. Probl. Ophthalmol. 17, 248–256 (1975).