For Review Only
Evaluation of the Performance of TDR and Capacitance Techniques for
Soil Moisture Measurement
Susha Lekshmi S. U. a, D. N. Singhb*, Alessandro Tarantinoc and M. Shojaei Baghinid
a
PhD, Department of Civil Engineering, Indian Institute of Technology Bombay, Powai, Mumbai-400076, India, [email protected]
b
Professor, Department of Civil Engineering, Indian Institute of Technology Bombay, Powai, Mumbai-400076, India, [email protected]
c
Professor, Department of Civil and Environmental Engineering, University of Strathclyde, 75 Montrose Street, G1 1XJ, [email protected]
dProfessor, Department of Electrical Engineering, Indian Institute of Technology Bombay, Powai, Mumbai-400076, India, [email protected]
* Corresponding author. Tel.: +91-22-2576-7340; fax: +91-22-2576-7302 3
For Review Only
Abstract
Though researchers have employed various techniques (gravimetric, electromagnetic, neutron scattering, heat pulse, micro-wave and optical remote sensing techniques) for soil moisture measurement, dielectric based techniques (Time Domain Reflectometry, TDR, and capacitance technique, CT) have gained much more popularity, mainly due to revolutionary developments in the field of electronics and data communication systems. However, suitability and relative performance of these techniques for moisture measurement of soils is a point of debate. Hence, in order to address this issue, extensive studies were conducted on the soils of entirely different characteristics, compacted at various compaction states (dry density and water content) by employing TDR and capacitance probes. Subsequently, the dielectric constant of the soil and its bulk electrical conductivity were obtained using these probes and compared against each other and that computed from Topp’s equation, which is a well-established relationship between the dielectric constant of the soil and its volumetric moisture content. An attempt was also made to correlate Ka values obtained from the dielectric techniques and Topp’s equation with that of Time Propagation (TP) mixing model, which incorporates in it the properties of the soil matrix as well. It has been observed that K a-TDR matches well with the Ka-Topp and Ka-TP, while the best match has been observed between
Ka-TDR and Ka-Topp as compared to the Ka-CT. As such, the study demonstrates, clearly, that Topp’s equation, which ignores the soil specific parameters, is capable of determining the soil moisture content appropriately. This study proposes an empirical equation which relates dielectric constants obtained from Topp's equation to those obtained from the TDR, capacitance technique and TP mixing model. Such a relationship can be further utilized for estimating the volumetric soil moisture content.
Keywords: soils, dielectric constant, volumetric moisture content, time domain reflectometry, capacitance probe, electrical conductivity.
For Review Only
Nomenclatureθ volumetric moisture content γt soil bulk unit weight
γd dry unit weight of soil
σ electrical conductivity
σCT electrical conductivity obtained from capacitance technique
σTDR electrical conductivity obtained from Time Domain Reflectometry technique
ξ zeta potential
mS/cm milli-Siemens per centimeter
w gravimetric moisture content g/cc gram per centimetre cube
Ka dielectric constant
Ka-CT. dielectric constant of the soil mass obtained by employing capacitance technique
Ka-TDR dielectric constant of the soil mass obtained by employing Time Domain Reflectometry technique
Ka-Topp dielectric constant of the soil mass obtained by employing Topp’s equation
Ka-TP dielectric constant of the soil mass obtained by employing Time Propagation mixing model
zTDR levels of immersion using Time Domain Reflectometry technique
zCT levels of immersion using capacitance technique
G specific gravity
CEC Cation Exchange Capacity
CT Capacitance Technique 3
For Review Only
LL liquid limit
PL plastic limit
PI plasticity index
OM organic matter
TDR Time Domain Reflectometry TDS Total Dissolved Solids TP Time Propagation
USCS Unified Soil Classification System 3
For Review Only
IntroductionSoil moisture content has paramount importance in timely scheduling of irrigation, slope stability analysis, water balance studies and heat and contaminant transport through the soil (Susha et al. 2014). Recently, Susha et al., (2014) have provided a detailed synthesis of various soil moisture measurements techniques (thermo-gravimetric, electro-magnetic, neutron scattering, optical and thermal analysis based) and have discussed about the issues pertaining to the applicability of these techniques for the soils of entirely different characteristics. Though earlier researchers developed various measurement techniques such as gravimetric (ASTM D 2216; Hillel, 1982; Robinson et al. 2008), electromagnetic (Selig et al. 1975; Topp et al. 1980; Topp et al. 1982; Nissen and Moldrup, 1994; Hilhorst 2000; Jones and Or, 2004; Bhat et al. 2007; Tarantino et al. 2008; Rao and Singh 2011), neutron scattering (Elder and Ramussen 1994; Fityus et al. 2011), heat pulse technique (De Vries, 1963; Julie and Jay 1997), optical remote sensing techniques (Robinson et al. 2008; Sayde et al. 2010; Yin et al. 2013; Sadeghi et al. 2015), dielectric based techniques such as Time Domain Reflectometry (TDR) and capacitance techniques (Topp et al. 1980; Bhat et al. 2007; Rao and Singh 2011) have gained much more popularity. This is mainly due to the dependence of the dielectric constant (apparent permittivity or relative permittivity, Ka) on the soil moisture content (for dry soils Ka is between 2-8, while for de-ionized water the same is 81) and revolutionary development in the field of electronics and data communication systems in the recent past (Topp et al. 1980; Bhat et al. 2007; Arulanandan and Smith 1973; Acar and Olivieri 1989; Sreedeep et al. 2004), which facilitated them as instantaneous and non-invasive measurement techniques in various porous materials such as soils, peats, wood, snow and forest litter (Moret-Fernandez et al. 2008; Baudena et al. 2012; Camporese 2006; Canone et al. 2009; Previati et al. 2011; Previati et al. 2012). Incidentally, these techniques not only measure dielectric constant of the soil, but also measure its bulk electrical 3
For Review Only
conductivity, σ, which can be correlated with the volumetric moisture content, θ, conductivity of the pore-solution, σw, fraction of the clay sized particles present and the soil mineralogy (Rhoades et al. 1976; Shainberg et al. 1980; Smith and Arulanandan 1981; Shah and Singh, 2004; Shah and Singh 2005). Though these techniques are used quite frequently, precision of the soil moisture measurement, and suitability and performance of these techniques, for wide range of the soils (in terms of their physical, chemical and mineralogical compositions) has always been a point of debate.
With this in view, efforts were made to compare the relative performance of the TDR (Campbell scientific TDR CS640 probe model) and capacitance technique, CT, (Decagon device 5TE) probes on the soils with different characteristics and compacted to different states (as defined by their dry density and moisture content). In addition to moisture content, the dielectric constant of the soil, Ka, and its bulk electrical conductivity, σ, were obtained by employing these techniques. The results so obtained were compared against each other and those computed by employing the Topp’s equation, which is a well-established relationship between the dielectric constant of the soil and its volumetric moisture content. Details of this study are presented in this paper along with a discussion on the efficiency of the Topp’s equation to compute soil moisture content. Furthermore, a hypothesis, which can be employed for estimation of volumetric soil moisture content of soil without resorting to the dielectric techniques, has also been proposed based on this study.
Details of the Test Setup
Time domain reflectometry (TDR)
The TDR test setup used in this study consists of a step pulse generator, sampler (consists of a voltmeter and a timing device), an oscilloscope, coaxial cable and a TDR probe. This setup, which facilitates measurement of the delay time between the transmitted and reflected electromagnetic waves, was employed for determining the dielectric constant of the 3
For Review Only
soil. In this study, Campbell scientific TDR CS 640 probe that consists of three prongs, the pointed and projected parts of the probe, of length 7.5 cm, width 4.5cm, diameter 0.159 cm and spacing between the rods 0.84 cm was employed. As specified by the manufacturer, the range of the volumetric moisture content and the bulk electrical conductivity, for which this setup can be employed, are 1-100% and 0- 5mS/cm, respectively. The set up provided the TDR waveforms of the samples and the obtained waveforms were analyzed as described below.
Analysis of the TDR waveform
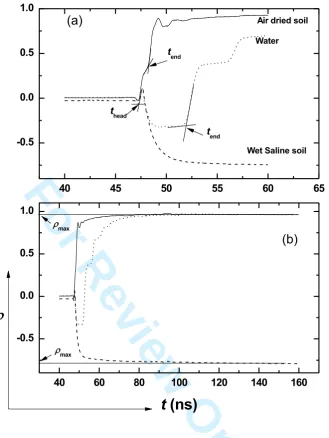
Evett (2000) has reported that the method of interpretation of the TDR waveforms, from which the dielectric constant of the soil, Ka, is obtained could significantly affect the computed value of the of soil moisture content. The tangent methodology proposed by Heimovaara and Bouten (1990) for the determination of the travel time (=tend - thead) of the electromagnetic wave up to the head, thead, and end, tend, of the probe for computing the Ka, has been employed in this study (refer Fig. 1(a)). Although, the time at which the reflection occurs from the head of the probe, thead, is constant, the time at which the reflection occurs from the end of the probe to its head, tend, depends upon the medium in which the TDR probe is inserted. Fig. 1(a) highlights this fact and it can be noticed that thead is constant for various media (air, water and wet saline soil). However, tend for water is higher as compared to its counterparts. This indicates that an increase in moisture content of a medium results in an increased tend and Ka. On the contrary, the presence of salinity in the medium makes it more conducting and hence tend decreases. Increase in conductivity of the medium is also responsible for its short circuiting at the surface and hence tend and Ka cannot be determined. Volumetric moisture (water) content measurement from the TDR waveform
TDR waveforms for a soil, compacted at different moisture contents and constant target dry density, γd, were obtained. From these waveforms, the dielectric constant, Ka-TDR, 3
For Review Only
for different soils, considered in this study, was computed by employing Eq. 1 (Topp et al. 1980) and the results are presented in Fig. 2(a).
(1) =
where c is the velocity of electromagnetic waves (= 3×10⁸ m/s), times corresponding to the reflection at the end and head of the probe are tend and thead, respectively, and L is the effective length of the probe.
Volumetric moisture content and dielectric constant are related by the following Equations 2 and 3 which are proposed by Topp et al. (1980). Ka-Topp can be computed by employing Eq. 2.
(2) = 3.03 + 9.3 ∙ + 146 ∙ $ − 76.7 ∙ ' where is the volumetric moisture content in % = 6.γ7
γ8 , w is the gravimetric moisture
content (in %) and γd and γw are the dry density of the soil and density of water (=1 g/cc), respectively.
Topp et al. (1980) have also proposed the following empirical relationship (Eq. 3) and reported that this equation is independent of soil type, soil density, soil temperature and soluble salt content; which most of the dielectric- based techniques (especially TDR and capacitance techniques) employ to determine the volumetric soil moisture content.
(3) θTopp = 4.3×10⁻⁶·Ka 3-5.5×10⁻⁴·Ka2+2.92×10⁻² ·Ka-5.3×10⁻² Electrical conductivity measurement from the TDR waveforms
Topp et al. (1988) have reported that the bulk electrical conductivity, σTDR, of the soil can be measured using a TDR probe and by employing the following relationship (Giese and Tiemann 1975):
(4) 9 =⋅<:;⋅<= >⋅ ?
@;
@A − 1B 3
For Review Only
where ϵ0 is the permittivity of the free space (in F/m), c is the velocity of electromagnetic waves (3×10⁸ m/s), L is the effective length of the probe (in m), V0 is the input voltage on the head of the probe, V∞ is the final voltage (of the standing wave) measured by the oscilloscope, after various reflections have occurred, and zc (63.3 ohm) and zp (183 ohm) correspond to the impedance of the cable tester and the probe, respectively.
As the TDR probe returns the signal recorded by the oscilloscope in terms of reflection coefficient, ρ, the reflection occurring at infinite time (designated as CDE, refer Fig. 1(b)) can be written as:
(5) CDE =@A@@;
; Hence, Eq. 4 can be rewritten as:
(6) 9=F<= >?
GHIJ
GKHIJB where, Kp = (c·ε0·zp)/L
Calibration of the TDR probe should be done when the reflection coefficient measured in air, ρair, and water, ρw, and short circuit probe, ρsc, are not equal to 1, 1 and -1, respectively (Castiglione and Shouse 2003; Tarantino et al. 2008). Hence reflection coefficient values range between 1 and -1. Wojciech (2008) have also reported that these calibration errors can occur due to the overlapping of incident and reflected pulses. Hence, Castiglione and Shouse (2003) have derived an equation (refer Eq. 7) for correcting the reflection coefficient, ρmax,corr, to account for these additional losses in the TDR system.
(7) CDE,MNN= HHOPQ
HOPQHR>+1 Eq. 8 can be modified as given below (Wojciech et al.2008).
(8) 9=F<= > S
GHIJ,>TQQ
GKHIJ,>TQQU
Incidentally, from Fig. 1(b), it can be noticed that ρmax becomes negative as the salinity of the medium increases and hence σTDR would be high (refer Equations 6 and 8) for 3
For Review Only
higher negative values of ρmax. However, σTDR is negligible for air and de-ionised water as their ρmax is almost unity.
Capacitance probe
In addition to the TDR measurements, capacitance technique (CT) based probe (Decagon device 5TE, which consists of three prongs of length 5.2cm and employs 70MHz oscillating wave and is manufactured by the Decagon Devices 2012) was also employed for this study. It was used for measuring the dielectric constant (1 to 80), Ka-CT, the volumetric moisture content, θCT (0-100%) and the bulk electrical conductivity, σCT (<10mS/cm), of the same soil sample on which the TDR measurements were conducted and the value of θ was determined by using Eq.3. Incidentally, this probe can also measure the temperature (-40°C
-50°C) of the soil and utilises Topp’s equation (refer Eq.3) to calculate θCT from Ka-CT.
Capacitance technique determines the dielectric constant of a medium by measuring the charging time of a capacitor, which uses this medium as a dielectric.A thermistor in contact with the sensor prongs provides temperature of the soil, while the screws on the surface of the sensor form a two-sensor electrical array, which facilitates electrical conductivity measurements (Decagon Devices 2012).
Experimental Investigations
Seven soils of entirely different physical, chemical and mineralogical properties (refer Tables 1, 2 and3) were used in the present study. Details of their characterization, which facilitates standardization of these soils, are presented in the following.
Physical characterization
The specific gravity, G, of these soils was determined as per the guidelines of ASTM D 5550 by employing an Ultra Pycnometer, (Quantachrome, USA), which utilizes helium gas as the displacing fluid. The gradational characteristics of the soils were determined by using the conventional sieve analysis and hydrometer analysis (ASTM D 422-63). The consistency 3
For Review Only
limits (viz., liquid limit, LL, plastic limit, PL and plasticity index, PI) of these soils were determined according to the guidelines of ASTM D 4318-10 (2013). The specific surface area (SSA) of the soils was determined by Ethylene Glycol Monoethyl Ether, EGME, absorption method (Carter et al. 1986; Cerato and Luteneggaer 2002; Arnepalli et al. 2008). The presence of organic matter in these soils was determined as per ASTM D2974-14 (2014). The physical properties of the soils are presented in Table 1.
Chemical characterization
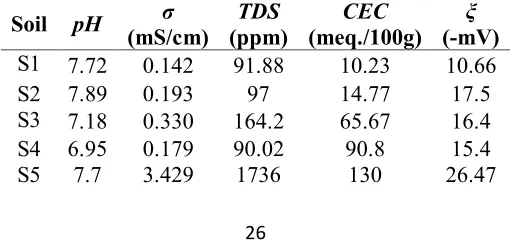
Chemical composition of these soils (refer Table 2a) was determined by employing an X-ray Fluorescence instrument, XRF (PANalytical PW 2404). The pH, electrical conductivity (σ) and total dissolved solids (TDS) of these soils, corresponding to liquid to solid ratio, L/S, equal to 20 were measured by employing a water quality analyzer (Oakton® PC 2700) and the results are listed in Table 2(b). The cation-exchange capacity, CEC of these soils was determined (refer Table 2(b)) as per the guidelines provided in EPA 9081 (1967). The influence of pore fluid on particle-to-particle interaction in the soil can be investigated by the change in the surface charge potential which is indirectly defined as the zeta potential, ξ
(Sparks 1986; Yukselen and Kaya 2003) which was determined by employing an automated electrophoresis instrument (Zeta PALS, BIC, USA) and the results are presented in Table 2(b).
Mineralogical characterization
Qualitative mineralogical composition of these soils was determined by employing an X-ray Diffraction (XRD) Spectrometer (PANalytical X’Pert PRO, The Netherlands) which is fitted with a graphite monochromator and Cu-Kα radiation, as the source (Cullity and Stock 2001) and the results are listed in Table 3. The quantitative analysis of the mineralogical composition of the soils was conducted by resorting to Rietveld analysis by employing the X’Pert High Score Plus software with PDF-4+ database.
For Review Only
Sample Preparation
The soil was mixed with nano-filter water (deionized water) and left for maturation for 24 hours, which ensures uniform moisture level of the entire soil. Later, it was compacted to different compaction states (i.e., the gravimetric moisture content, w, and the dry density, γd) in a standard Proctor mould (944 cm3 in volume with an internal diameter of 10.2 cm and a height of 11.6 cm), as per the guidelines presented by ASTM D1557-12. Tarantino et al. (2008) reported that TDR waveforms would transfer only through the waveguides and measure the volumetric moisture content enclosed within the probe size. Susha et al. (2016) proved that effective magnetic field width (zone of influence) generated across the electrodes (diameter 0.2 cm) would be 2 cm. For the present study, diameter of the TDR probe is 0.159cm and hence, there was no effect of the proctor mould in the electromagnetic waves generated. Moreover, multiple readings of the measurements were taken by the probes which ensured no distorted TDR waveforms (refer Fig. 3) and capacitance probe measurements. Simultaneously, three specimens from the matured soils were used for determining the w, as per ASTM D 2216 (2008). The volumetric moisture content, θ, electrical conductivity, σ, and the dielectric constant, Ka of the compacted soil were determined by employing both TDR and capacitance probes, in a sequential manner.
Results and Discussions
Calibration of the TDR and capacitance probes was conducted by placing them in different media (water, air and NaCl solutions of different molarities), for which the dielectric constant and electrical conductivity values are known. The resultant TDR waveforms are depicted in Fig. 4. Incidentally, the reproducibility (i.e. multiple waveforms for the same soil sample) of the resultant TDR waveforms was also ascertained, as depicted in Fig. 3. An overlap of the results indicates an excellent reproducibility of the TDR wave forms. It can 3
For Review Only
also be observed from Fig. 4 that as electrical conductivity of the media increases, the travel time of the TDR wave form decreases.
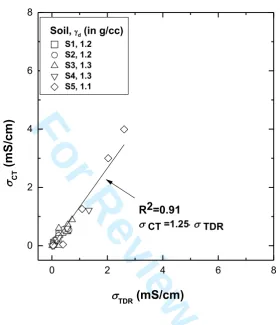
To understand the performance of the TDR and capacitance probes, comparisons have been made between the obtained Ka-TDR and Ka-CT, θTDR and θCT and σTDR and σCT values corresponding to various compacted states of the soils (S1 to S5, refer Table 1) considered in this study. It can be observed from Figures 2 and 5 that there is a mismatch between the K a-TDR and Ka-CT, θTDR and θCT, and σTDR and σCT. In fact, as depicted in Fig. 2a, it can be observed that the value of the dielectric constant obtained from the TDR measurements, K a-TDR, is much higher (almost twice) than that obtained from the capacitance (CT) probe, Ka-CT. As a result, the volumetric moisture content obtained from the CT probe, θCT, is about 50% of the value obtained from the TDR probe, θTDR (refer Fig. 2b). Furthermore, it can be observed from Fig. 5 that the electrical conductivity of the soil obtained from the CT probe, σCT is 25% higher than that obtained from the TDR probe, σTDR. For standardization of these observations, all these variables (Ka-TDR and Ka-CT) were compared against the calculated volumetric soil moisture content computed, θc (=6.
γ7
γ8, refer Eq. 3) and the results are
depicted in Fig. 6. The trends depicted in Fig. 6, corresponding to the variation of Ka-TDR and
Ka-CT with θc, respectively, are pretty well defined and can be presented in an exponential form [Ka=A.eθc·B], where A and B are empirical coefficients. As depicted in these figures, an increasing trend between the two parameters (dielectric constant and electrical conductivity) indicates that starting from the dry state of compacted soil samples, which contain air (with lower dielectric constant 1 to 3) in the voids, gets replaced by the water (with higher dielectric constant 81). This in turn results in an increased dielectric constant of the soil. Furthermore, the water (pore-solution) present in the interconnected pores would offer much lower resistance to the flow of current (i.e., an increase in the electrical conductivity, σ. However, if the soil exhibits higher electrical conductivity, σ (refer the data for soil S5 listed 3
For Review Only
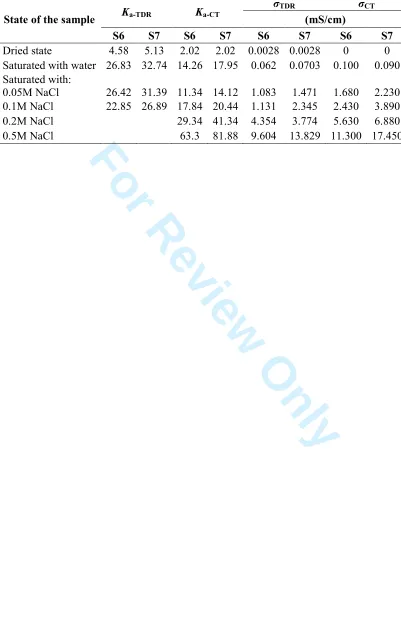
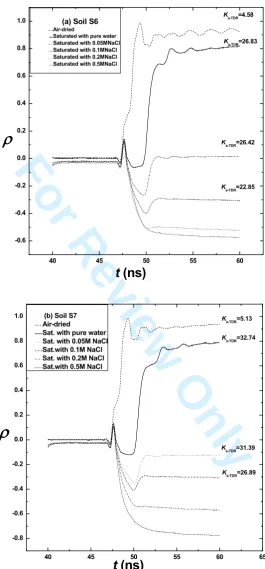
in Table 2b), due to the presence of higher concentrations of ions in the pore-solution, its dielectric constant would be lesser. In order to verify this, standard sands (soils S6 and S7) were saturated with different molar concentrations of the pore-solutions (viz., 0.05M, 0.1M, 0.2M and 0.5 M NaCl solutions) and the results obtained from the two probes are presented in Fig. 7 and Table 4. From Fig. 7 and Table 4, it can be noticed that, in general, as NaCl concentration increases, the dielectric constant of soils S6 and S7 which are essentially sands decreases. This can be attributed to the fact that, as stated earlier, in case of the TDR probe, an increase in salinity of the medium, increases its conductivity which results in a decreased
tend. Thus due to an increase in conduction of the current through the medium, its dielectric constant, Ka-TDR, reduces. Moreover, dielectric constant and electrical conductivity as a function of frequency take account of the inherent asymmetry and broadness of the dielectric dispersion and polarization effects which are characterised by Debye Relaxation Equation. For higher saline medium, as the medium approaches a relaxation point, the dielectric loss factor increases which corresponds to a drop in the dielectric constant (Robinson et al. 2003). As per the tangent method, Ka-TDR cannot be obtained for the soils S6 and S7, the soils saturated with 0.2 M and 0.5M NaCl solutions, as their end signals of the TDR waveforms are flat which means the electromagnetic wave is dissipated and no reflection could be obtained (refer Fig. 7). Similarly, in case of the capacitance probe, the capacitance of the medium reduces due to an increase in the salinity, and hence Ka-CT decreases. Incidentally, Table 4 also reveals that the electrical conductivity measured by the capacitance probe, σCT, is higher as compared to σTDR, for the entire range of volumetric moisture content considered in this study, except for the dried state of the soils S6 and S7, where these measurements are 0 mS/cm and 0.0028 mS/cm, respectively.
As TDR and capacitance probes employ Topp’s equation (Eq. 3) to correlate Ka and
θ, the Ka-TDR and Ka-CT of the soil samples were also compared with those computed from Eq. 3
For Review Only
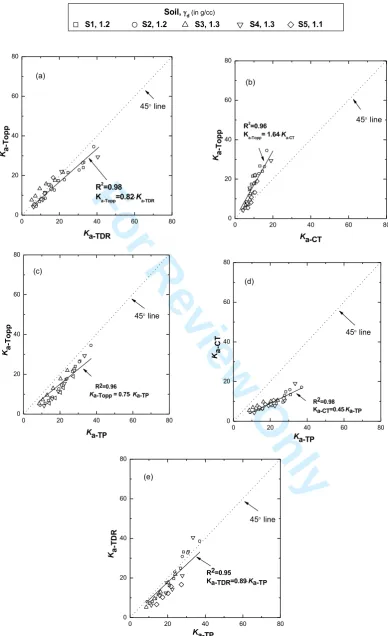
2, Ka-Topp, as depicted in Fig. 8(a) and (b). From these figures, it can be noticed that a linear relationship exists between Ka-Topp and Ka-TDR, and Ka-Topp and Ka-CT, though it appears to be an over-prediction of Ka-TDR and under-prediction of Ka-CT with respect to Ka-Topp. To overcome this situation, Ka-TDR, Ka-CT and Ka-Topp were also compared with the Ka-TP (i.e., the dielectric constant obtained from the ‘Time Propagation mixing model’, which is also referred as TP-Mixing model), as shown in Fig.8 (c), (d) and (e). Knoll (1996) has reported that TP-Mixing model can be effectively employed for estimating the dielectric constant of the heterogeneous materials, especially geologic materials. The TP-Mixing model incorporates soil specific parameters (mineralogical constitution of the soil, porosity and saturation of the soil and presence of various phases, air or water, of the pore solution in the soil) for estimation of the dielectric constant, Ka-TP, as presented by Eq. 9 (Knoll 1996; Bhat et al. 2007; Martinez and Byrnes 2001) and the details of Ka-TP is shown in Table 5. From Fig. 9, it can be noticed that Ka-TP is linearly correlated to θc (R2=0.99) and the intercept is 5.0 which corresponds to the dielectric constant of the dry soil (θc=0 %). However, TP-Mixing model does not account for the effect of frequency of the AC, while computing the effective dielectric constant, Ka-TP. Moreover, the quantification of the minerals present in the soil and estimation of their dielectric constants are arduous tasks.
(9) VW= X1 − ƞ · [G· V\]+ [· V\^$ + ƞ · _N· V`a]+ 1 − _N · V`a^$b where, ƞ is the porosity and Sr is the degree of saturation (with moisture) of the soil, M corresponds to the percentage of the mineral present in the soil, KM corresponds to the dielectric constant of the respective mineral (refer Table 3 and 5) and KPF corresponds to the dielectric constant of the pore-solutions (viz., air (2) and water (81) ) present in the soil.
From Figures 8(c), (d) and (e), it can be noticed that Ka-TDR, Ka-CT and Ka-Topp yield good correlations with Ka-TP. The slope of Ka-TDR and Ka-TP (0.89, refer Fig. 8e) relationship is higher as compared to Ka-CT and Ka-TP (0.45, refer Fig. 8d), and Ka-Topp and Ka-TP (0.75, refer 3
For Review Only
Fig. 8c), relationships. Hence, it can be inferred that the TDR probe performs better at matching with Ka-TP and Ka-Topp in comparison with Ka-CT. This exercise also indicates that the values of Ka obtained from various techniques differ and hence θ, obtained from Eq. 3, would also vary. As most of the dielectric techniques employ Eq. 3 (Topp et al. 1980), Eq. 10 which is a relationship between Ka-Topp with Ka-TDR, Ka-CT and Ka-TP from Figures 8 (a), (b) and (c) was derived. One of the applications of Eq. 10 would be that Ka-Topp can be obtained if Ka-TDR,
Ka-CT and Ka-TP are known. This in turn would facilitate determination of θ of the soil, by employing Eq. 3.Hence, the proposed relationship can be used to estimate dielectric constant and subsequently volumetric moisture content irrespective to the dielectric techniques
(10) cdMee = 0.82 · cdhi = 1.64 · cjd = 0.75 · cd` However, it should be borne in mind that Ka-TDR and Ka-CT, appearing in Eq. 10, are the effective dielectric constants and that would get influenced due to the presence of interfaces, from which the electromagnetic waves would get reflected due to change in the impedance. Such interfaces might develop within the compacted soil sample due to (a) its compaction in multiple layers or (b) the compaction induced moisture migration. Another explanation which could be ascribed to the interface formation in the sample could be the variation in the dry density along the depth of the soil mas since the bottom layers of sample receive higher cumulative compaction as compared to the middle and top layers. Moreover, due to compaction, moisture migration from top to bottom layers or vice versa occurs, which might cause moisture contrast, and hence the contrast in Ka, along the length of the sample. As such, in all these circumstances, the effective Ka of the soil would prevail. To address such situations and simulate their effect on the measurement of dielectric constant, an effort was made to realize the influence of an interface (air and water, and the stratification of the soil due to its compaction) media in which the dielectric probes were inserted. The TDR and CT probes were immersed in water corresponding to different insertion levels of the TDR and 3
For Review Only
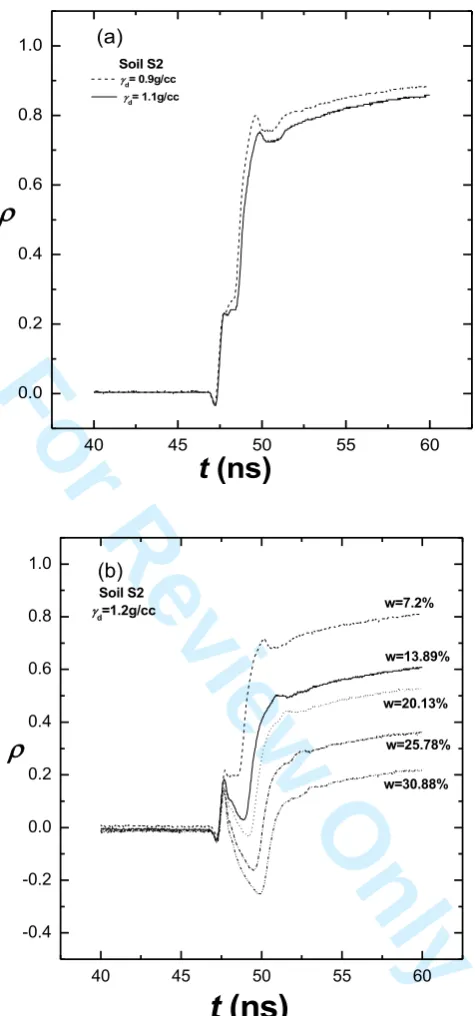
CT, defined as zTDR and zCT (in cm), respectively (refer Fig. 10 , which presents results for the TDR probe). The TDR waveforms as depicted in Fig. 10 were obtained to determine K a-TDR andθTDR. The variations of zTDR show difference in the shape of the TDR waveform and hence the travel time would also differ. This in turn results in a change in the values of Ka-TDR and θTDR. On the contrary, the CT probe would yield only the values of volumetric moisture content, θCT and dielectric constant, Ka-CT and not any wave form. It can also be observed from Fig. 11 that these probes would yield correct values of Ka (81) and θ (100%) for water, when they are completely immersed in a medium. This indicates that due to the presence of an interface (in this case, air and water), the probes would yield an effective dielectric constant of the media. Incidentally, it can also be observed from the Figures 12 (a) and (b) that the time of travel (= tend-thead) of the TDR waves increases with an increase in the dry density and the moisture content. However, it can be clearly inferred from Fig. 12 that the travel time is more sensitive to the increase in moisture content and hence the Ka-TDR increases. However, as stated earlier, depending on the soil characteristics (especially saline soils), pore-solution may contain more ions which would enhance the velocity of the electro-magnetic waves and hence tend would decrease. It is worth noting that in case of the capacitance probe, the capacitance of the medium along the length of the soil sample varies due to the change in moisture content and hence Ka-CT changes.
Conclusions
Detailed investigations on the performance of TDR and capacitance technique, CT, based probes were conducted by measuring the dielectric constant (Ka), moisture content (θ) and electrical conductivity (σ) of the soils of entirely different characteristics compacted at different moisture contents and densities. The obtained dielectric constant values from these instruments (viz. Ka-TDR and Ka-CT) have been compared with Ka-Topp and Ka-TP. It has been observed that the measured K is not unique and varies with the types of techniques employed 3
For Review Only
for the soil moisture measurement. As these dielectric techniques employ Topp’s equation for relating Ka and θ, the change in Ka of different techniques might yield different values of the moisture content for the same state of the soil. An effort was also made to relate Ka-TDR, Ka-CT,
Ka-TP with Ka-Topp which would help in determining the θ of the soil. It has been observed that
Ka-TDR matches well with the Ka-Topp and Ka-TP, while the best match has been observed between Ka-TDR and Ka-Topp as compared to the Ka-CT. The study also demonstrates that the Topp’s equation, which though lacks the soil specific parameters in it, is capable of predicting the soil moisture content quite effectively. However, utility and efficiency of the relationship developed between Ka-Topp, Ka-TDR, Ka-CT and Ka-TP should be further investigated for various soils of the world.
Acknowledgement
The authors would like to acknowledge the funding received from the Department of Electronics and Information Technology (DeitY), MCIT, Government of India, through the Center of Excellence in Nanoelectronics, Department of Electrical Engineering, IIT-Bombay and the support of the European Commission via the Marie Curie IRSES project GREAT ‘Geotechnical and geological Responses to climate change: Exchanging Approaches and Technologies on a world-wide scale’ (FP7-PEOPLE-2013-IRSES-612665)EC/FP7 project GREAT (Geotechnical and Geological Responses to Climate Change: Exchanging Approaches and Technologies on a World-wide scale), University of Strathclyde, Scotland.
References
Acar, Y.B. and Olivieri, I., 1989, “Pore fluid effects on the fabric and hydraulic conductivity of laboratory compacted clay”, Transportation Research Record , Vol. 1219, pp.144-159.
For Review Only
Arnepalli D.N., Santhakumar S., Hanumantha Rao B., and Singh D.N., 2008, “Comparison of methods for determining specific surface area of fine-grained soils”, Geotechnical and Geological Engineering, Vol. 26, pp. 121-132.
Arulanandan, K. and Smith, S.S., 1973, “Electrical dispersion in relation to soil structure”,
Journal of Soil Mechanics and Foundation Division, ASCE, Vol.99, No.12, pp.1113-1133.
ASTM D 2216, 2008, “Standard Test Methods for Laboratory Determination of Moisture Content of Soil”, Annual book of ASTM standards ASTM International, West Conshohocken, PA.
ASTM D 422-63, 2007, “ Standard Test Method for Particle Size Analysis of Soils”, Annual book of ASTM standards, ASTM International, West Conshohocken, PA, Vol. 04.01. ASTM D 4318-10, 2013, “Standard Test Method for Liquid Limit, Plastic Limit and
Plasticity Index of Soils”, Annual book of ASTM standards, ASTM International West Conshohocken, PA., Vol. 04.08.
ASTM D1557-12, 2012, “Standard test methods for laboratory compaction characteristics of soil using modified effort (56,000 ft-lbf/ft3 (2,700 kN-m/m3))”, ASTM International, West Conshohocken, PA, DOI: 10.1520/D1557-12.
ASTM D2974-14, 2014, “Standard test methods for moisture, ash, and organic matter of peat and other organic soils”, Annual book of ASTM standards 04.08, ASTM, Philadelphia, USA.
Baudena, M., Bevilacqua, I., Canone, D., Ferraris, S., Previati, M. and Provenzale, A., 2012, “Soil water dynamics at a midlatitude test site: Field measurements and box modeling approaches”, Journal of Hydrology, Vol. 414-415, pp. 329-340.
For Review Only
Bhat, A. M., Rao, B.H. and Singh, D.N., 2007, “A generalized relationship for estimating dielectric constant of soils”, Journal of ASTM International, Vol. 4, No. 7, pp. 1–17. Camporese, M., Ferraris, S., Putti, M., Salandin, P. and Teatini, P., 2006, “Hydrological
modeling in swelling/shrinking peat soils”, Water Resources Research, Vol. 42, No. 6. Canone, D., Previati, M., Ferraris, S. and Haverkamp, R., 2009,“A new coaxial Time Domain
Reflectometry probe for water content measurement in forest floor litter”, Vadose Zone Journal, Vol. 8, No.2, pp.363-372.
Carter, D. L., Mortland, M. M., and Kemper, W. D., 1986, “Specific surface- Methods of Soil Analysis”, American Society of Agronomy, USA.
Castiglione, P. and Shouse, P.J., 2003, “The effect of ohmic cable losses on time-domain reflectometry measurements of electrical conductivity”, Soil Sci. Soc. Am. J., Vol.67, pp.414-424.
Cerato, A. B. and Lutenegger, A. J., 2002, “Determination of surface area of fine grained soils by the ethylene glycol mono-ethyl ether (EGME) method”, Geotechnical Testing Journal, ASTM, Vol. 25, No. 3, pp. 1-7.
Cullity, B. D., and Stock, S. R., 2001, “Elements of X-Ray diffraction”, 3rd Ed., Prentice-Hall Inc., ISBN 0-201-61091-4.
DeVries D. A, 1963, “Thermal properties of soil”, Physics of plant environment, Jhon Wiley and Sons, Newyork.
Decagon Devices 5TE water content, 2012, “EC and temperature sensors”, Operator’s Manual, Version 8, USA.
Elder, N and Rasmussen, T.C., 1994, “Neutron probe calibration in unsaturated tuff”, Soil Science Society of America Journal , Vol.58, No.5,p p.1301-1307.
For Review Only
EPA, 9081, 1967, “Cation-exchange capacity of soils (Sodium Acetate)”, Environmental Protection Agency, United States.
Evett, R.S., 2000, “The TACQ computer program for automatic time domain reflectometry measurement:II waveform interpretation methods”, Transactions of ASAE, Vol. 43, No.6, pp. 1947-1956.
Fityus, S., Wells, T. and Huang, W., 2011, “Moisture content measurement in expansive soils using the neutron probe”, Geotechnical Testing JournalASTM, Vol. 34, No.3,pp. 1-10. Giese, K. and Tiemann, R., 1975, “Determination of the complex permittivity from
thin-sample time domain reflectometry improved analysis of the step response waveform”,
Advances Molecular Relaxation Processes, Vol. 7, pp.45–59.
Heimovaara, T.J. and Bouten, W., 1990, “A computer controlled 36 channel time domain reflectometry system for monitoring soil water contents”, Water Resource Research, Vol. 26, pp.2311-2316.
Hilhorst, M.A., 2000, “A pore moisture conductivity sensor”, Soil Science Society of America Journal , Vol. 64, pp.1922-1925.
Hillel, D., 1982, “Introduction to soil physics”, Academic press, Orlando, Florida.
Jones, S. B. and Or, D., 2004, “Frequency domain analysis for extending time domain reflectometry water content measurement in highly saline soils”, Soil Sci. Soc. Am. J.,
Vol. 68, pp.1568-1577.
Julie, M.T. and Jay, M.H., 1997, “Measuring soil moisture content in the laboratory and field with dual probe heat capacity sensors”, Agronomy Journal, Vol. 89, No.4, pp. 535-542. 3
For Review Only
Knoll, M. D., 1996, “A petrophysical basis for ground-penetrating radar and very early time electromagnetics, electrical properties of sand-clay mixtures”, Ph.D. dissertation, University of British Columbia, pp.316 .
Martinez, A., and Byrnes, A. P., 2001, “Modelling dielectric-constant values of geologic materials: an aid to ground penetrating radar data collection and interpretation”, Current Research in Earth Sciences, Bulletin 247 part 1.
Moret-Fernandez, D., Arrue, J.L., Perez, V. and Lopez, M.V., 2008, “A TDR-pressure cell design for measuring the soil-water retention curve”, Soil and Tillage Research, Vol. 100, pp.114-119.
Nissen, H.H. and Moldrup, P., 1994, “Theoretical background for the TDR methodology. In: proceedings of the symposium: time domain reflectometry applications in soil science”, Vol. 3.
Previati, M., Canone, D., Bevilacqua, I., Boetto, G., Pognant, D. and Ferraris, S., 2012, “Evaluation of wood degradation for timber check dams using time domain reflectometry water content measurements”, Ecological Engineering, Vol. 44, pp.259-268.
Previati, M., Godio, A. and Ferraris, S., 2011, “Validation of spatial variability of snowpack thickness and density obtained with GPR and TDR methods”, Journal of Applied Geophysics, Vol.75, No. 2, pp.284-293.
Rao, B.H. and Singh, D.N., 2011, “Moisture content determination by TDR and capacitance techniques: a comparitive study”, International Journal of Earth Sciences and Engineering, Vol. 4, No.6, pp.132-137.
For Review Only
Rhoades, J.D., Raats, P.A.C. and Prather, R.J., 1976, “Effects of liquid-phase electrical conductivity, water content and surface conductivity on bulk soil electrical conductivity”,
Soil Science Society of America Journal, Vol. 40, pp.651-655.
Robinson, D.A., Jones, S.B., Wraith, J. M, Or, D. and Friedman, S. P., 2003, “A Review of Advances in Dielectric and Electrical Conductivity Measurement in Soils Using Time Domain Reflectometry”, Vadose Zone Journal, Vol.2, pp. 444-475.
Robinson, D.A., Campbell, C.S., Hopmans, J.W., Hornbuckle, B.K., Jones, S.B. and Knight, R., 2008, “Soil Moisture Measurement for Ecological and Hydrological Moistureshed-Scale Observatories: A Review”, Vadose Zone Journal, Vol. 7, No.1, pp. 358-389. Sadeghi, M., Jones, S. B. and. Philpot, W.D ., 2015, “A linear physically-based model for
remote sensing of soil moisture using short wave infrared bands”, Remote Sensing of Environment, Vol. 164, pp. 66-76.
Sayde, C., Gregory, G.R., Maria, T., Nick, T., Scott, N. and van de Giesen, 2010,”Feasibility of soil moisture monitoring with heated fiber optics”, Water Resources Research, Vol. 46, pp.1-8.
Selig, E.T. and Manusukhani, S., 1975, “Relationship of soil moisture to the dielectric property”, Journal of Geotechnical engineering, ASCE, Vol. 101, No.8, pp. 775-770. Shah, P.H. and Singh, D.N., 2004, “A simple methodology for determining electrical
conductivity of soils”, Journal of ASTM International, Vo.1, No.5.
Shah, P.H. and Singh, D.N., 2005, “Generalized Archie’s law for estimation of soil electrical conductivity”, Journal of ASTM International, Vol.2, No.5.
For Review Only
Shainberg, J., Rhoades, J.D.and Prather, R.J., 1980, “Effect of exchangeable sodium percentage, cation exchange capacity and soil solution concentration on electrical conductivity”, Soil Science Society of America Journal, Vol. 44, pp.469-473.
Smith, S.S. and Arulanandan, K., 1981, “Relationship of electrical dispersion to soil properties”, Journal of Geotechnical Engineering, ASCE, Vol. 107, No.5, pp. 591-604. Sparks, D.L., 1986, “Soil Physical Chemistry”, CRC Press, Boca Raton.
Sreedeep, S., Reshma, A.C. and Singh, D.N., 2004, “Measuring Soil Electrical Resistivity Using a Resistivity Box and a Resistivity Probe”, ASTM International, West Conshohocken, PA, pp.19428-2959.
Susha Lekshmi, S.U., Singh, D. N., and Maryam Shojaei Baghini, 2014, “A critical review of soil moisture measurement”, Measurement, Vol. 54, pp. 92-105.
Susha Lekshmi S. U., Prathyusha N. V. J., Aravind, P., Singh, D.N., and Maryam S. B., 2016, "A Critical Analysis of the Performance of Plate- and Point-electrodes for Determination of Electrical Properties of the Soil mass", Measurement, Vol.93, pp. 552-562.
Tarantino, A., Ridley, A.M. and Toll, D.G., 2008, “Field measurement of suction, water content, and water permeability”, Geotech. Geol. Eng. Vol.26, pp.751-782.
Topp, G. C., Davis, J. L., and Annan, A. P., 1980, “Electromagnetic determination of soil moisture content: measurements in coaxial transmission lines”, Water Resour. Res., Vol.16, No.3, pp. 574–582.
Topp, G.C. and Zegelin, S, and White, I., 2000, “Impacts of the real and imaginary components of relative permittivity on Time Domain Reflectometry measurements in soils”, Soil Sci. Soc. Am. J., Vol.64, pp.1244–1252.
For Review Only
Topp, G.C., Davis, J. L., and Annan, A. P., 1982, “Electromagnetic determination of soil moisture content using TDR: applications to wetting fronts and steep gradients”, Soil Sci. Soc. Am. J. Vol. 46, pp. 672–678.
Topp, G.C., Yanuka, M., Zebchuk, W.D. and Zegelin, S., 1988, “Determination of electrical conductivity using TDR: soil and water experiments in coaxial lines”, Water Resour Res., Vol.24, No.7, pp.945–952.
Wojciech, S., Wilczek, A.and Alokhina, O., 2008, “Calibration of a TDR probe for low soil water content measurements”, Sensors and Actuators A: Physical , Vol.147, No.2, pp.544-552.
Yin, Z., Lei, T., Yan, Q., Chen, Z. and Dong, Y., 2013, “A near-infrared reflectance sensor for soil surface moisture measurement”, Computers and electronics in agriculture, Vol.99, pp.101-107.
Yukselen, Y. and Kaya, A., 2003, “Zeta potential of kaolinite in the presence of alkali, alkaline earth and hydrolyzable metal ions”, Journal of Water, Air and Soil Pollution, Vol. 145, No.1-4, pp.155-168.
For Review Only
Table 1. Physical properties of the soils used in the present study
Soil ϒ(g/cc) d G SSA
(m2/g)
Size-fraction (%) %
USCS*
Sand Silt Clay LL PL PI OM
S1 1.2 2.77 160 0 20 80 64 32 32 0 CH
S2 1.2 2.63 62 0 46 54 54 27 27 0 CH
S3 1.3 2.66 358 16 67 17 56 32 24 2 CH
S4 1.3 2.76 216 25 59 16 51 29 22 2 CH
S5 1.1 2.60 359 3 59 38 79 28 51 21 CH
S6 1.5 2.64 9 100 0 0
Not Applicable 0 SP
S7 1.5 2.32 6 100 0 0 0 SP
CH: Clay of high plasticity, SP: poorly graded sand *
The Unified Soil Classification System 3
For Review Only
Table 2 (a). Chemical composition of the soils used in the present study Soil
% by weight
SiO2 Al2O3 Fe2O3 CaO MgO K2O Na2O TiO2 P2O5 S1 40.59 55.87 1.27 0.03 0.11 1.38 0.69 0.02 0 S2 37.94 52.84 2.52 1.59 0.20 1.84 0.19 2.69 0.03 S3 48.19 17.69 22.67 5.18 1.49 0.132 1.32 2.72 0.31 S4 42.16 19.77 29.67 1.39 0.50 1.03 0.27 4.31 0.51 S5 29.12 44.39 9.45 5.61 0.97 3.31 5.51 1.21 0.33 S6 86.88 9.85 1.22 0.14 0.10 0.51 1.03 0.16 0 S7 85.44 10.04 2.43 0.16 0.03 0.35 1.43 0.02 0
Table 2 (b). Chemical characterization of the soils used in the present study
Soil pH σ
(mS/cm)
TDS
(ppm)
CEC
(meq./100g)
ξ
(-mV) S1 7.72 0.142 91.88 10.23 10.66 S2 7.89 0.193 97 14.77 17.5 S3 7.18 0.330 164.2 65.67 16.4 S4 6.95 0.179 90.02 90.8 15.4 S5 7.7 3.429 1736 130 26.47 3
[image:27.612.124.489.456.577.2] [image:27.612.178.434.623.744.2]For Review Only
S6 7.64 0.093 60.62 0.70 24.19 S7 7.97 0.0689 44.57 1.15 20.11Table 3. Mineralogical characteristics of the soils used in the present study
Soils Minerals
S1 Kaolinite (99.5%), Laumonite (0.5%)
S2 Kaolinite (87.5%), Quartz (5.5%), Illite (7.0%)
S3 Anorthite (66.2%), Montmorillonite (2.2%), Quartz (20.7%), Hematite (10.2%), Dolomite (0.7%)
S4 Goethite (46.8%), Quartz (41.7%), Montmorillonite (0.3%), Maghemite (7.4%), Hematite (3.8%)
S5 Orthoclase (38.3%), Anorthite (24.6%), Magnetite (21.0%), Quartz (16.1%), S6 Quartz (100%)
S7 3
For Review Only
Table 4. Comparison of Ka-TDR, Ka-CT, σTDR and σCT for Soils S6 and S7 State of the sample Ka-TDR Ka-CT
σTDR σCT
(mS/cm)
S6 S7 S6 S7 S6 S7 S6 S7
Dried state 4.58 5.13 2.02 2.02 0.0028 0.0028 0 0 Saturated with water 26.83 32.74 14.26 17.95 0.062 0.0703 0.100 0.090 Saturated with:
0.05M NaCl 26.42 31.39 11.34 14.12 1.083 1.471 1.680 2.230 0.1M NaCl 22.85 26.89 17.84 20.44 1.131 2.345 2.430 3.890 0.2M NaCl 29.34 41.34 4.354 3.774 5.630 6.880 0.5M NaCl 63.3 81.88 9.604 13.829 11.300 17.450 3
For Review Only
Table 5. Details of the parameters used for TP-Mixing model
Soil ηηηη Sr percentage of Minerals Dielectric constant of the minerals Ka-TP
% M1 M2 M3 M4 M5 KM1 KM2 KM3 KM4 KM5
S1
0.58 0.17
0.995 0.005 11.18 7.66
11.99
0.57 0.23 13.85
0.57 0.28 15.16
0.50 0.51 21.83
0.52 0.55 23.14
0.55 0.64 27.03
0.58 0.67 28.60
0.55 0.75 31.12
S2
0.64 0.10
0.875 0.055 0.070 11.18 6.53 10
9.24
0.54 0.31 16.02
0.55 0.43 19.56
0.54 0.57 24.01
0.54 0.68 27.93
0.54 0.76 30.78
0.54 0.92 37.21
S3
0.49 0.20
0.662 0.022 0.207 0.102 0.007 5.47 8 6.53 60 8.45 8.60
0.52 0.28 10.57
0.52 0.37 12.92
0.51 0.48 16.25
0.52 0.59 20.29
0.52 0.70 24.03
S4
0.53 0.12
0.468 0.003 0.417 0.074 0.038 12 8 6.53 20 60
11.30
0.52 0.27 15.14
0.54 0.41 19.04
0.54 0.52 22.47
0.53 0.68 27.81
0.54 0.83 33.50
S5
0.57 0.18
0.468 0.003 0.417 0.074 33.7 6.53 6.2 5.47
14.14
0.57 0.29 17.32
0.57 0.37 20.23
0.59 0.42 21.77
0.57 0.57 27.27
https://mc04.manuscriptcentral.com/astm-gtj
For Review Only
List of FiguresFIG.1. Typical TDR waveforms for finding out thead, tend and ρmax corresponding to various states of medium
FIG. 2. Comparison of (a) Ka-CT with Ka-TDR and (b) θCTwith θTDR for different soils FIG. 3. Reproducibility of the TDR waveforms
FIG. 4.TDR waveforms in air, water and NaCl solutions of different molarities FIG. 5. Variation of σa-CT with σa-TDR for different soils
FIG. 6. Variation of Ka-TDR and Ka-CT with θc for different soils
FIG. 7. Variation of TDR waveforms for Soils S6 and S7 in their dry and saturated (with water and NaCl solutions) states
FIG. 8. Comparison of the dielectric constant obtained from different methods for the soils considered in the present study
FIG. 9. Variation of Ka-TP with θc for different soils
FIG. 10. TDR waveforms for various levels of immersion (zTDR in cm) of the TDR probe (l=7.5cm length) in water
FIG. 11. Variation of Ka and θ measured from the TDR and CT probes with their immersion in water up to different levels
FIG. 12. TDR waveforms of the Soil S2 for different (a) dry density and (b) moisture content values
For Review Only
40 45 50 55 60 65 -0.50.0 0.5 1.0
40 60 80 100 120 140 160
-0.5 0.0 0.5 1.0
tend
thead
Wet Saline soil Water
Air dried soil
tend
(a)
rmax rmax
r
t
(ns)
[image:32.595.155.485.80.519.2](b)
FIG. 1. Typical TDR waveforms for determining
t
head,
t
endand
ρ
max(reflection
coefficient occurring at infinite time) corresponding to various states of medium
For Review Only
0 10 20 30 40 50 60 70 80
Soil, gd (in g/cc)
S1, 1.2 S2, 1.2 S3, 1.3 S4, 1.3 S5, 1.1
Ka-TDR
0 10 20 30 40 50 60 70 80
0 10 20 30 40 50 60 70 80
R2=0.97 Ka-CT=0.5×Ka-TDR
K a-CT
Ka-TDR
(a)
0 20 40 60 80 100
0 20 40 60 80 100
R2=0.98
q CT=0.58×q TDR
qTDR q CT
(b)
FIG. 2. Comparison of (a)
K
a-CTwith
K
a-TDRand (b)
θ
CTwith
θ
TDRfor different soils
For Review Only
40 45 50 55 60
-1.0 -0.5 0.0 0.5 1.0
0.2M NaCl Water Soil S4 Water
0.2 M NaCl
Soil S4 w=4.9%,gd=1.3g/cc
r
t
(ns)
FIG. 3. Reproducibility of the TDR waveforms
For Review Only
40 45 50 55 60
-1.0 -0.8 -0.6 -0.4 -0.2 0.0 0.2 0.4 0.6 0.8 1.0
0.5NaCl 0.1NaCl 0.05NaCl
Air
r
t (ns)
Water
FIG. 4. TDR waveforms in air, water and NaCl solutions of different molarities
For Review Only
0 2 4 6 8
0 2 4 6 8
R2=0.91
sCT =1.25× sTDR
sTDR
(mS/cm)
s CT
(
m
S/c
m
)
Soil,
gd (in g/cc) [image:36.595.148.429.146.472.2]S1, 1.2 S2, 1.2 S3, 1.3 S4, 1.3 S5, 1.1
FIG. 5. Compariosn of
σ
a-CTwith
σ
a-TDRfor different soils
For Review Only
Soil, gd(in g/cc)S1, 1.2 S2, 1.2 S3, 1.3 S4, 1.3 S5, 1.1
0 20 40 60 80 100
0 10 20 30 40 50
R2= 0.87
Ka-CT = 4.09× e0.03×qc R2= 0.92
Ka-TDR = 5.1× e0.04×qc
q
c
(
%
)
[image:37.595.137.432.177.571.2]K
aFIG. 6. Variation of
K
a-TDR andK
a-CT withθ
c for different soilsFor Review Only
(a) Soil S6
Air-dried
Saturated with pure water Saturated with 0.05MNaCl Saturated with 0.1MNaCl Saturated with 0.2MNaCl Saturated with 0.5MNaCl
40 45 50 55 60
-0.6 -0.4 -0.2 0.0 0.2 0.4 0.6 0.8 1.0
t
(ns)
r
K
a-TDR=22.85
K
a-TDR=26.42
Ka-TDR=26.83
Ka-TDR=4.58
40 45 50 55 60 65
-0.8 -0.6 -0.4 -0.2 0.0 0.2 0.4 0.6 0.8 1.0
Ka-TDR=26.89
Ka-TDR=31.39
K a-TDR=32.74
(b) Soil S7 Air-dried
Sat. with pure water Sat. with 0.05M NaCl Sat.with 0.1M NaCl Sat. with 0.2M NaCl Sat.with 0.5M NaCl
r
t
(ns)
[image:38.595.164.430.103.674.2]Ka-TDR=5.13
FIG. 7. Variation of TDR waveforms for Soils S6 and S7 in their dry and saturated (with
water and NaCl solutions) states
For Review Only
Soil, gd (in g/cc)
S1, 1.2 S2, 1.2 S3, 1.3 S4, 1.3 S5, 1.1
0 20 40 60 80
0 20 40 60 80
R2=0.98
Ka-Topp=0.82×Ka-TDR
Ka-TDR K a-T o p p (a)
45° line
0 20 40 60 80
0 20 40 60 80
R2=0.96
Ka-Topp= 1.64×Ka-CT
Ka-CT K a-T o p p (b)
45° line
0 20 40 60 80
0 20 40 60 80 R2=0.96
Ka-Topp = 0.75× Ka-TP
K a-T o p p Ka-TP (c)
45° line
0 20 40 60 80
0 20 40 60 80 R2=0.98
Ka-CT=0.45×Ka-TP
K
a-C
T
Ka-TP
(d)
45° line
0 20 40 60 80
0 20 40 60 80 R2=0.95
Ka-TDR=0.89×Ka-TP
K a-T D R Ka-TP (e)
[image:39.595.87.476.76.713.2]45° line
FIG. 8. Comparison of the dielectric constants obtained from different methods for the soils
considered in the present study
For Review Only
0 20 40 60 80 100
0 10 20 30 40 50
Soil, gd (in g/cc)
S1, 1.2 S2, 1.2 S3, 1.3 S4, 1.3 S5, 1.1
R2= 0.99
Ka-TP = 0.62×qc +5.0
K
a
-TP
q
c (%)
FIG. 9. Variation of
K
a-TPwith
θ
cfor different soils
For Review Only
40 45 50 55 60
-0.4 -0.2 0.0 0.2 0.4 0.6 0.8 1.0 1.2 1.4 r t (ns) 47.3 48.41 z=0 cm Water
40 45 50 55 60 -0.4 -0.2 0.0 0.2 0.4 0.6 0.8 1.0 r
t (ns) 47.3 48.99 z=1.5 cm
40 45 50 55 60
-0.4 -0.2 0.0 0.2 0.4 0.6 0.8 1.0 r
t (ns) 47.3
49.62 z= 3cm
40 45 50 55 60
-0.4 -0.2 0.0 0.2 0.4 0.6 0.8 1.0 r
t (ns) 47.3
50.32 z=4.5cm
40 45 50 55 60 -0.4 -0.2 0.0 0.2 0.4 0.6 0.8 1.0 r
t (ns)
z = 6 cm
47.3
51.19
40 45 50 55 60 -0.4 -0.2 0.0 0.2 0.4 0.6 0.8 1.0 r
t (ns) 47.3
51.86 z=l =7.5cm
FIG. 10. TDR waveforms for various levels of immersion (z
TDRin cm) of the TDR probe
(
l
=7.5cm length) in water
For Review Only
0 1 2 3 4 5 6 7 8 9 10
0 20 40 60 80
0 1 2 3 4 5 6 7 8
0 20 40 60 80 100
0 1 2 3 4 5 6 7 8 9 10
0 20 40 60 80
0 1 2 3 4 5 6 7 8
0 20 40 60 80 100 Ka-TD
R
zTDR (cm)
qTopp
(%
)
zTDR (cm)
z CT (cm) Ka-CT
zCT (cm)
qTopp
(%
[image:42.595.136.471.146.449.2])
FIG. 11. Variation of
K
aand
θ
measured from the TDR and CT probes with their immersion
in water up to different levels
For Review Only
40 45 50 55 60
0.0 0.2 0.4 0.6 0.8 1.0
r
t (ns)
Soil S2gd= 0.9g/cc
gd= 1.1g/cc (a)
40 45 50 55 60
-0.4 -0.2 0.0 0.2 0.4 0.6 0.8 1.0
w=30.88% w=25.78% w=20.13% w=13.89% w=7.2%
Soil S2
gd=1.2g/cc
r
t
(ns)
[image:43.595.181.419.78.587.2](b)