Development of a multi historian SCADA data collection middleware : a thesis presented in partial fulfilment of the requirements for the degree of Master of Engineering in Computer and Electronic Engineering at Massey University, Albany, New Zealand
100
0
0
Full text
(2)
(3) Development of a multi-historian SCADA data collection middleware. A thesis presented in partial fulfilment of the requirements for the degree of Master of Engineering in Computer and Electronic Engineering at Massey University, Albany, New Zealan d. Jeffrey Paul Bridges 2013.
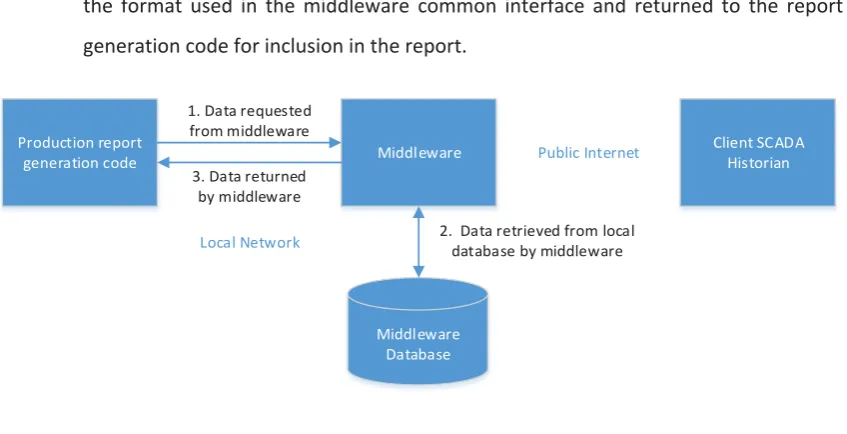
(4) Abstract This thesis details the implementation of a SCADA middleware package designed to provide a common interface to the most commonly used SCADA historians in use within local government in New Zealand. The middleware integrates with a New Zealand developed cloud based solution that is used throughout the country for compliance monitoring and reporting of water and wastewater treatment facilities. The middleware connects via the internet to the historians hosted on-site within council networks and retrieves data which is replicated in a local database. This approach provides backup for the data and allows it to be accessed quickly when required for reporting. The middleware database is hosted within a Microsoft SQL Server instance to ensure compatibility and ease of rollout when paired with the commercial cloud solution. To ensure reliable data collection and resilience to connection interruption all transactions made against the client historians are controlled by a queue stored in the middleware database. The middleware includes an inbuilt mechanism for integrity checking to ensure all data available in the client historian is collected and has been designed to run with minimal intervention of company staff. To reduce storage requirements the middleware includes a data deduplication system that removes repeated samples from the SQL Server database after integrity checking has been performed. This provides a lossless compression mechanism that does not alter the precision of the data collected. The middleware implementation has now been in use in a production environment collecting data from councils for compliance purposes for approximately six months. During this time data collection has been very reliable with the middleware handling numerous connection outages without intervention.. i.
(5) Acknowledgements Thanks to Associate Professor Edmund Lai for providing supervision and guidance over the course of this project. I am very grateful to Dr Peter Johnson for providing the opportunity to work on this project, and providing his support and guidance over the past year. This project was partially funded by the Ministry of Science + Innovation. Thanks to Chris Lock for his efforts in securing this funding. This project would not have been possible without support from the IT and utilities staff at a number of councils around New Zealand who provided access to their operational data. A special thanks to my partner Alexandra for her support and understanding during the long hours required to complete this project. Thanks to my family who provided support and motivation throughout the project.. ii.
(6) Contents Abstract ...........................................................................................................................................i Acknowledgements........................................................................................................................ ii List of Figures ............................................................................................................................... vii List of Tables ................................................................................................................................. ix Chapter 1:. Introduction .......................................................................................................... 1. 1.1. Motivation..................................................................................................................... 1. 1.2. Objectives...................................................................................................................... 1. 1.3. Thesis Overview ............................................................................................................ 2. Chapter 2:. Literature Review .................................................................................................. 4. 2.1. Background Information ............................................................................................... 4. 2.2. Theory ........................................................................................................................... 5. 2.2.1. SCADA Historians .................................................................................................. 5. 2.2.2. Historian Data Access ............................................................................................ 6. 2.2.3. Data Transport and Security ................................................................................. 7. 2.2.4. Data Collector Architecture .................................................................................. 8. 2.2.5. Data Storage.......................................................................................................... 8. 2.2.6. Common Interface ................................................................................................ 9. 2.2.7. Development Methodologies ............................................................................. 10. 2.3. Summary ..................................................................................................................... 12. Chapter 3:. SCADA Historians ................................................................................................ 13. 3.1. Citect Historian............................................................................................................ 13. 3.2. GE Proficy Historian .................................................................................................... 13. 3.3. Invensys Wonderware Historian ................................................................................. 14. 3.4. QTech DATRAN ........................................................................................................... 14. 3.5. Hilltop DataTamer ....................................................................................................... 14. Chapter 4:. Existing Cloud Solution ........................................................................................ 16. 4.1. Production Hardware .................................................................................................. 16. 4.2. Production Software ................................................................................................... 16. 4.3. Production Virtual Machine Software ........................................................................ 17. 4.4. Production Network .................................................................................................... 17. 4.5. Production Schematic ................................................................................................. 18. 4.6. Implementation Requirements ................................................................................... 18. Chapter 5:. Investigation and Planning .................................................................................. 20. iii.
(7) 5.1. Test Environment Hardware ....................................................................................... 20. 5.1.1 5.2. Hardware............................................................................................................. 20. Test Environment Software ........................................................................................ 21. 5.2.1. Hypervisor ........................................................................................................... 21. 5.2.2. Middleware Virtual Machine .............................................................................. 22. 5.2.3. Reporting Virtual Machine .................................................................................. 23. 5.2.4. Citect Historian Virtual Machine ......................................................................... 24. 5.2.5. GE Proficy Virtual Machine ................................................................................. 25. 5.2.6. Invensys Wonderware Virtual Machine .............................................................. 25. 5.2.7. QTech DATRAN Virtual Machine ......................................................................... 26. 5.2.8. Hilltop Virtual Machine ....................................................................................... 27. 5.2.9. Large Dataset Virtual Machine ............................................................................ 27. 5.2.10. Development Workstation .................................................................................. 28. 5.2.11. Network Overview .............................................................................................. 29. 5.3. Common Interface ...................................................................................................... 29. 5.3.1. Tag Listing............................................................................................................ 30. 5.3.2. Tag Collection Status ........................................................................................... 31. 5.3.3. Tag Data Retrieval ............................................................................................... 31. 5.3.4. Tag Data Backfill .................................................................................................. 33. 5.4. Data Access Methodologies ........................................................................................ 34. 5.4.1. Pass-through ....................................................................................................... 34. 5.4.2. Collection and Storage ........................................................................................ 35. 5.5. Reliable Data Collection .............................................................................................. 37. 5.5.1. Data Integrity Checking ....................................................................................... 38. 5.5.2. Last Connection Time Tracking ........................................................................... 39. 5.5.3. Queued Data Collection ...................................................................................... 40. 5.5.4. Queued Data Collection and Integrity Checking ................................................. 41. 5.6. Secure Data Collection ................................................................................................ 42. 5.6.1. Source Address Whitelisting ............................................................................... 43. 5.6.2. Authentication .................................................................................................... 43. 5.6.3. Source Address Whitelisting with Authentication .............................................. 44. 5.6.4. SSL Encryption ..................................................................................................... 44. 5.6.5. VPN Tunnelling .................................................................................................... 44. 5.7. Data Compression ....................................................................................................... 46. 5.7.1. Sampling Deadband ............................................................................................ 46 iv.
(8) 5.7.2. Sample Deduplication ......................................................................................... 48. Chapter 6:. Middleware Implementation .............................................................................. 51. 6.1. Application Runtime Environment .............................................................................. 51. 6.2. Middleware Architecture ............................................................................................ 51. 6.2.1. Middleware Windows Service ............................................................................ 52. 6.2.2. Middleware Database ......................................................................................... 52. 6.2.3. Common Interface Assembly .............................................................................. 53. 6.3. Database Schema ........................................................................................................ 53. 6.3.1. DataSource Table ................................................................................................ 54. 6.3.2. Tag Table ............................................................................................................. 55. 6.3.3. Sample Table ....................................................................................................... 56. 6.3.4. Queue Table ........................................................................................................ 57. 6.3.5. Config Table ........................................................................................................ 58. 6.4. Middleware Configuration .......................................................................................... 58. 6.4.1. Configuration Data Types.................................................................................... 58. 6.4.2. Configuration Parameters ................................................................................... 59. 6.5. Transaction Queue ...................................................................................................... 60. 6.5.1. Queue Operations ............................................................................................... 60. 6.5.2. Operation Status ................................................................................................. 61. 6.5.3. Operation Priorities............................................................................................. 62. 6.5.4. Queue Pruning .................................................................................................... 62. 6.6. Main Application Loop ................................................................................................ 63. 6.7. Worker Application Loop ............................................................................................ 66. 6.8. Data Integrity Checking ............................................................................................... 68. 6.9. Data Cleaning .............................................................................................................. 70. 6.10. Historian Data Provider Interface ............................................................................... 72. 6.10.1. Data Retrieval ...................................................................................................... 72. 6.10.2. Data Integrity Checking ....................................................................................... 72. 6.10.3. Tag Verification ................................................................................................... 73. 6.10.4. Tag Listing............................................................................................................ 73. 6.11. Historian Data Providers ............................................................................................. 74. 6.11.1. Citect Historian Data Provider ............................................................................ 74. 6.11.2. GE Proficy Historian Data Provider ..................................................................... 75. 6.11.3. Invensys Wonderware Historian Data Provider .................................................. 77. 6.11.4. QTech DATRAN Data Provider ............................................................................ 78 v.
(9) 6.11.5. Hilltop DataTamer Data Provider ........................................................................ 79. 6.12. Connection Security .................................................................................................... 80. 6.13. Middleware Deployment ............................................................................................ 80. 6.14. Queue Management Tool ........................................................................................... 81. Chapter 7:. Conclusions ......................................................................................................... 82. 7.1. Conclusions ................................................................................................................. 82. 7.2. Future Enhancements ................................................................................................. 83. 7.2.1. Parallel Worker Threads...................................................................................... 84. 7.2.2. Queue Item Failure Count ................................................................................... 84. 7.2.3. Self-Service Backfill Tools .................................................................................... 84. 7.2.4. Data Collection Processes ................................................................................... 85. 7.2.5. Pass-Through Data Access .................................................................................. 85. References .................................................................................................................................. 87. vi.
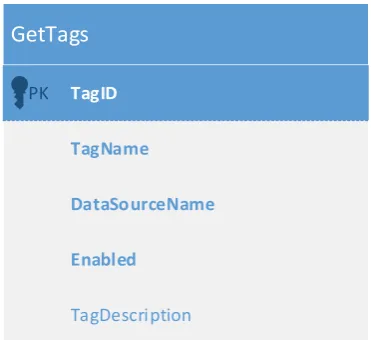
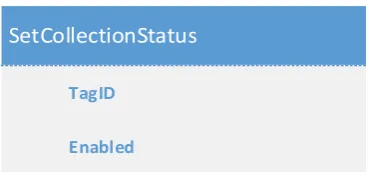
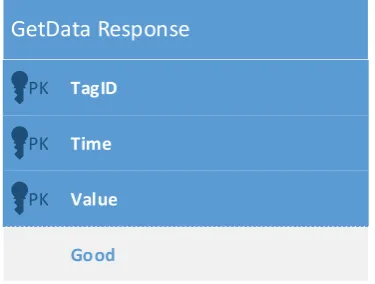
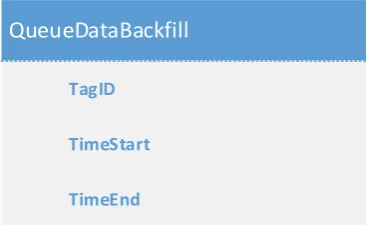
(10) List of Figures Figure 1: The Waterfall method (Shore & Warden, 2008).......................................................... 10 Figure 2: The Iterative method (Shore & Warden, 2008) ........................................................... 11 Figure 3: Agile development (Shore & Warden, 2008) ............................................................... 11 Figure 4: Production environment schematic ............................................................................ 18 Figure 5: Hypervisor type comparison ........................................................................................ 22 Figure 6: Development network ................................................................................................. 29 Figure 7: Common interface GetTags response data table schema ........................................... 30 Figure 8: Common interface SetCollectionStatus method inputs .............................................. 31 Figure 9: Common interface GetData method inputs ................................................................ 32 Figure 10: Common interface GetData response table schema ................................................. 32 Figure 11: Common interface QueueDataBackfill method inputs .............................................. 33 Figure 12: Pass-through connection data access ........................................................................ 34 Figure 13: Data collection and storage ....................................................................................... 36 Figure 14: Stored data access ..................................................................................................... 36 Figure 15: Simple data integrity checking scheme ..................................................................... 38 Figure 16: Last connection time tracking scheme ...................................................................... 39 Figure 17: Example queue showing data sync operations.......................................................... 40 Figure 18: Queue item processing .............................................................................................. 41 Figure 19: Example queue showing data sync and data integrity check operations .................. 42 Figure 20: Source address whitelisted connection ..................................................................... 43 Figure 21: VPN tunnelled connection ......................................................................................... 45 Figure 22: Sampling with a 10% deadband ................................................................................. 46 Figure 23: Sampling with a fixed deadband of 1......................................................................... 47 Figure 24: Results of compression with varying deadbands....................................................... 48 Figure 25: Report generation with raw data .............................................................................. 49 Figure 26: Report generation with deduplicated data ............................................................... 49 Figure 27: Results of compression with sample deduplication .................................................. 50 Figure 28: Implemented middleware architecture ..................................................................... 52 Figure 29: Middleware database schema ................................................................................... 54 Figure 30: Main program loop .................................................................................................... 65 Figure 31: Middleware worker loop ........................................................................................... 67 Figure 32: Extended data integrity checking scheme ................................................................. 69 Figure 33: Data compression algorithm ...................................................................................... 71. vii.
(11) Figure 34: Historian data provider GetData request and respoonse ......................................... 72 Figure 35: Historian data provider GetCount request ................................................................ 73 Figure 36: Historian data provider CheckTagExists request ....................................................... 73 Figure 37: Historian data provider GetTagList request and response ........................................ 74 Figure 38: GE Proficy Connection Methodology ......................................................................... 75 Figure 39: Middleware Queue Tool ............................................................................................ 81. viii.
(12) List of Tables Table 1: Citect Tag Mapping ....................................................................................................... 74 Table 2: Citect Sample Mapping ................................................................................................. 75 Table 3: GE Proficy Tag Mapping ................................................................................................ 76 Table 4: GE Proficy Sample Mapping .......................................................................................... 76 Table 5: Invensys Wonderware Tag Mapping ............................................................................. 77 Table 6: Invensys Wonderware Sample Mapping ...................................................................... 77 Table 7: QTech DATARN Tag Mapping ........................................................................................ 78 Table 8: QTech DATRAN Analog Sample Mapping ..................................................................... 78 Table 9: QTech DATRAN Digital Sample Mapping ...................................................................... 79 Table 10: Hilltop DataTamer Tag Mapping ................................................................................. 80 Table 11: Hilltop DataTamer Sample Mapping ........................................................................... 80. ix.
(13) Chapter 1: Introduction This thesis details the implementation of middleware that facilitates an interface to multiple SCADA historian systems with a particular focus on the SCADA systems and historians in use within the water and wastewater treatment sections of local government in New Zealand. The middleware is intended to integrate with a commercial cloud based compliance monitoring and reporting solution that is used throughout New Zealand by local government. The product provides reporting based on manually collected data which will be augmented with data obtained from SCADA telemetry systems with the introduction of this middleware.. 1.1 Motivation While most SCADA historian packages provide a means to perform reporting the information on which they can report is generally limited in scope as the entire information set needed for compliance is not held in the historian. In the case of the water and wastewater treatment industry the information from the SCADA system is combined with manually tested results and lab data for reporting purposes. The cloud based compliance monitoring and reporting solution for which this middleware is designed aims to provide a seamless reporting interface which bridges all potential data sources and therefore significantly reduce the amount of manual effort required to assemble compliance reports. One important aspect to this is the ability to source data from a number of different SCADA historian implementations. Providing councils with a solution that can report from multiple historians gives them many more options when considering technology upgrades. When building new facilities the potential for vendor lock-in will be reduced as the SCADA system and historian implemented will no longer have to match the product used at other facilities. Where existing infrastructure is being upgraded the historic data can be retained when a new historian solution is implemented, with reporting continuing seamlessly with the legacy data being reported alongside data from the newly implemented historian.. 1.2 Objectives The first objective is to determine the SCADA historian solutions most commonly used in New Zealand. The outcome will be a list of historians for which interfaces will be developed to facilitate access via the middleware.. 1.
(14) The next objective will be the implementation of a test and development environment in which the middleware implementation can occur. Where possible this includes obtaining access to SCADA historian implementations and obtaining historic data from councils for test and benchmarking purposes. This will be followed by the definition of a common interface that will be used by consumers of data contained in the middleware as a means to access stored data. This common interface will be integrated in the commercial cloud solution to enable reporting on data collected by the middleware. The final objective will be to implement the middleware.. This will include devising an. architecture that is both reliable and resilient to connection disruptions. The middleware database will need to provide a level of performance in excess of the volume of data being produced by clients and include compression to ensure disk space is used efficiently. To demonstrate that the middleware is reliable and fit for purpose it will need significant testing in the production environment where it will form part of the compliance reporting solution for clients.. 1.3 Thesis Overview Chapter 2 provides a review of information relevant to the middleware implementation. This includes a background of SCADA systems and their corresponding historian products and methods available for accessing the data they contain, including methodologies for securing data while in transport. This is followed by a brief investigation of data collector architecture and storage concepts. Guidelines for a common interface are then presented, followed by an overview of development methodologies and conclusions. Chapter 3 gives a detailed overview of the SCADA historians most commonly encountered during a survey of local government infrastructure. This includes details of the data storage and data access methodologies adopted by each historian. Chapter 4 covers the existing cloud solution in to which the middleware is designed to integrate. This includes an overview of the hardware and network configurations employed in the production environment. The operating system and software image used for hosting clients is detailed, along with implementation requirements for the middleware. Chapter 5 covers the implementation of a test and development environment including the hardware and software setup for all middleware development and testing. The common. 2.
(15) interface used by the middleware data consumers to extract data from the middleware is then defined. This is followed by an investigation of historian data access methodologies and techniques for ensuring the reliability and resilience of data collection. An overview of potential options for securing historian access and in-transit data is provided, followed by an investigation of data compression techniques. Chapter 6 covers the implementation of the middleware service including the development framework and solution architecture. The database schema used for the middleware database is explained in detail. This is followed by a comprehensive description of the transaction queue used to ensure reliability. The workings of the application and worker threads are detailed, along with the data integrity checking scheme. The data compression scheme implemented is described, followed by details of the access methodology and table mappings used for each target historian. The chapter ends with a brief overview of the security implemented in production and details of the middleware installation in the production environment. Chapter 7 provides the conclusions and an overview of the milestones achieved during implementation of the middleware. This is followed by a number of suggestions for future improvements that could be implemented to improve the performance and functionality of the middleware.. 3.
(16) Chapter 2: Literature Review This chapter gives an overview of supervisory control and data acquisition (SCADA) systems and includes an overview of the current methods used for collecting, archiving and providing access to historic data. Potential data storage solutions for the proposed middleware are investigated along with development methodologies that may be suited to the project.. 2.1 Background Information Supervisory control and data acquisition (SCADA) systems are widely used throughout the water and wastewater sector of local government. The SCADA systems in use in these facilities are used for both data acquisition and process control allowing relatively automated operation of the water and wastewater treatment systems. The system utilizes remote terminal units (RTU) and programmable logic controllers (PLC) interconnected via a control network to implement the functionality required to operate the plant. The RTU devices serve as an interface to the physical world providing telemetry information gathered from connected sensors including temperature monitors, pH probes, flow meters and turbidity meters. These sensors provide an analogue signal which is sampled and converted to a digital representation by the RTU.. The RTU also provide a means to control external. equipment through outputs that can be used to switch relays controlling high powered equipment. Process control logic is implemented using PLCs connected to the control network. The PLCs receive telemetry data from RTU devices installed as required throughout the facility. The PLC contains software which implements the required level of automation through control of RTU outputs based on telemetry data from the facility. Information from both the RTU and PLC devices is made available to the facility operators via a computer display using a human-machine interface (HMI). The HMI can allow operators to view raw data from connected RTUs, show the control data calculated by PLCs and allow overrides of control settings if required. The system running the HMI generally includes a database system containing a log of SCADA tag data. A single SCADA tag can represent either a physical value obtained from an RTU device or a calculated value generated by a PLC. The database contains a log of time-value pairs for each tag and allows the HMI system to perform trending based on historic data. To facilitate long-term centralised storage of data contained in tag databases there are a number of historian products available. The historian connects to the HMI system and can retrieve and 4.
(17) store both real-time and historic data. This data is stored on the historian system using a number of different strategies which are investigated in more detail in the next section. The proprietary and differing nature of these historian systems can make data extraction difficult and is why the common interface described in this thesis has been proposed.. 2.2 Theory This section investigates the theory involved with individual components of the proposed solution. 2.2.1. SCADA Historians. SCADA historians use a variety of database technologies for data storage ranging from commercial relational databases such as Microsoft SQL Server and Oracle to high performance proprietary database systems that may be required for fast real-time data access and highvolume data storage (Zolotová, Flochová, & Ocelíková, 2005).. The advantages and. disadvantages of the relational database when compared with a proprietary solution are covered in this section. Utilizing a proprietary database can provide high rates of data storage with some solutions able to store hundreds of thousands of samples per second when using the appropriate hardware and configuration (GE Intelligent Platforms). This compares favourably with relational database systems which on the appropriate hardware can provide write speeds in the order of approximately ten thousand samples per second (Schnieder Electric Industries SAS, 2011). Using a hybrid model with relatively static data stored in a relational database and high volume time series data stored in a proprietary database can also provide the high write speeds of a fully proprietary solution (Middleton, 2011). The data storage requirement for a historian varies based on the database system used. When storing uncompressed data a typical relational database requires 40 bytes per sample, while proprietary solutions can store the same sample using only 6 bytes of storage (GE Intelligent Platforms). In both the relational and proprietary case compression can be used to reduce data storage requirements. A common strategy for compression relies on the use of a dead band which prevents new samples being committed to storage until the current value has changed more than a given amount when compared to the last stored value (Vasyutynskyy, 2007). In a test of 400,000 samples stored with a 1% dead band GE Intelligent Platforms found the data storage required was reduced by 78%.. 5.
(18) 2.2.2. Historian Data Access. A crucial part of historian functionality is to facilitate the retrieval of stored data for later use. Most historians provide a number of different means to access the data they contain; these are detailed in this section. For historians utilizing a Microsoft SQL Server database access is available via a number of methods, the two more common being the SQL Server Native Client and the SQL Server Managed Provider.. The SQL Server Native Client provides both an Object Linking and. Embedding, Database (OLE DB) driver and an Open Database Connectivity (ODBC) driver for accessing data stored within the historian SQL database. The OLE DB driver provides a Component Object Model (COM) application programming interface (API) which allows applications written for the Microsoft Windows platform to execute queries against the SQL server. As COM is language neutral these queries can be made from applications written in a variety of programming languages. ODBC is a standard C API for accessing databases. The SQL Server ODBC driver can be used by applications written in C, C++ and Visual Basic (Microsoft Corporation). Applications written to utilize the ODBC driver communicate with the SQL Server using C function calls with the driver passing SQL statements to the server and returning the results to the application. The SQL Server Managed Provider is an ADO.NET data provider that can be used by applications written for the .NET Common Language Runtime, including those written using C#, VB.NET and other .NET languages. ADO.NET data providers implement a consistent interface for access to a variety of data sources, including SQL Server (Microsoft Corporation). The SQL Server ADO.NET provider allows commands to be executed directly against the server while also allowing the Language-Integrated Query model to be used to create objects representing the data model of the relational database (Microsoft Corporation). SQL Server is also accessible from other operating systems such as Linux using tools such as FreeTDS. This tool allows native access to data stored within SQL databases from UNIX and Linux based platforms (FreeTDS Project, 2011). FreeTDS consists of C libraries that implement the tabular data stream protocol used for communication with SQL Server. Historians utilizing proprietary database storage provide access to stored data using similar data access drivers. In some cases an OLE DB driver is provided (GE Intelligent Platforms) which implements the standard interfaces required for querying the historian database. Despite the. 6.
(19) interface to the driver being standard the language and structure of the queries required to extract data can vary between historian implementations. Data access to some historians is also provided via an open connectivity historical data access (OPC HDA) API. OPC HDA describes a standard interface for retrieving data from applications that store historical data. An OPC HDA client can connect and retrieve data from any OPC HDA compliant server with the OPC HDA API (OPC Foundation, 2013). The server is able to both provide raw and interpreted data as requested by the client. Proprietary APIs for data access are also provided by the manufacturers of some historians (GE Intelligent Platforms). These APIs require code or libraries provided by the manufacturer to be included in the application code to facilitate access to the data (GE Fanuc Automation, 2006). These APIs can be manufacturer specific preventing application data access code being used across historians from different manufacturers. 2.2.3. Data Transport and Security. To access data from SCADA historians a connection over TCP/IP is used (GE Intelligent Platforms). As TCP/IP encompasses the protocols used for internet communication it is possible for historian data to be accessed remotely via the internet. The protocol at the application layer varies between historians based on the data access methodologies implemented by the manufacturers. As the historian data may travel over the public internet security can be required to limit access to only desired users. For historians utilizing Microsoft SQL Server for data storage the security scheme provided within SQL Server can be used to assign permissions on a per-user basis. Roles are assigned per user and can limit the data the user can read and write on a per database table basis. This can prevent private data being read or data being overwritten. Requiring a login for all users also prevents unauthorised access to the database. Historians utilizing a proprietary database can rely on other security mechanisms for data protection. If the historian makes data available via OPC HDA the authentication scheme contained within the OPC HDA specification can prevent unauthorized access to the content of the database with permissions able to be specified on a per-user basis to prevent read or write of specified data (Mahnke, Leitner, & Damm, 2009). Where an OLE DB provider is used for data access the authentication scheme must be implemented by the historian manufacturer and varies between historians. In most historian implementations this authentication is implemented as a username and password combination. 7.
(20) To provide additional security a firewall can be used to restrict access to the historian computer. Using firewall rules access can be restricted by IP address to only those computers allowed to access historian data. This adds an additional layer of security that helps prevent data access in the event that authentication details are compromised as requests from computers that are not in the allow list are ignored. Firewalling also helps prevent brute force attacks and attempts to compromise the security model using flaws in application code. When data travels across the public internet there can be no guarantee that the transmission is private. To prevent snooping of data in transit an encryption scheme is required. Microsoft SQL Server provides encryption through the optional use of Secure Sockets Layer (Microsoft Corporation). SSL encryption can be made either optional or mandatory for connecting clients with either a 40-bit or 128-bit level of encryption available. The client-server authentication process is always encrypted to prevent credentials being stolen. The OPC HDA specification allows for a secure channel to be used for communications. The encryption algorithm used is negotiated when a session is established between historian and client (Mahnke, Leitner, & Damm, 2009). For OLE DB providers any encryption must be implemented by the manufacturer in the proprietary protocol used for communication between historian and client. 2.2.4. Data Collector Architecture. As the data collector implemented for this middleware will be running and continually collecting data a high degree of reliability and resilience is required. As the data may be collected via unreliable links the collector needs the ability to track data that may have been missed and populate this data when the link is restored. To further ensure the validity and completeness of collected data a method for integrity checking is also required. Existing research regarding the architecture of such an application proved difficult to locate so a substantial amount of development and testing in this area will be required to ensure a robust solution. 2.2.5. Data Storage. Once data has been collected from the historian a system for storing the data locally is required. This role is typically performed by a relational database with entities representing the data needing to be stored. Relationships can be made using foreign keys to link between attributes in database tables.. 8.
(21) Data is added to and retrieved from the database using Structured Query Language (SQL). Some languages allow SQL tables and their relationships to be represented as entities in code. C# provides LINQ to SQL which allows the traditional stream of records queried from an SQL Server to be represented as objects which can be interacted with using standard object-orientated programming techniques (Troelsen, 2007). To improve the speed of queries it is essential a proper index be used. The database table index is much like that of a book and provides a quick means of finding a particular piece of data. Without an index the entire database would need to be scanned until the desired data is located (Allen, 2004). SQL Server databases can contain a large amount of data with the number of rows being limited only by the available storage (Microsoft Corporation, n.d.). The tables can contain up to 1000 unique indexes to improve data retrieval performance. 2.2.6. Common Interface. An application programming interface facilitates interaction between software components. The interface can facilitate the sharing of information between two separate applications and can include specifications for tasks and data structures. Developing a good interface is crucial as incorrect design decisions can be magnified as a single interface is often reused by numerous applications. A good application programming interface will facilitate simple development of a client application without additional code needed to manage operations performed using the interface. To help ensure a good interface design the interface needs to be designed with the ease of use of the calling application well considered. Self-documenting input and output parameters can make use from a client application easier. Thoroughly documenting the interface before beginning development can help provide an interface that is not encumbered by the host application architecture and ensure the interface meets the needs of calling applications. To facilitate software using the common interface to access samples from multiple SCADA historians the collected data needs to be presented in a consistent form. This could take the form of a common interface that only exposes features common to all historians, or an interface with the ability to report the attributes and features supported by the selected data source.. 9.
(22) While SCADA historians perform a similar function the data stored by individual products does vary. The basic information stored by all historians for a given sample incudes the date and time at which the sample was taken and the value of the sample at that time. Some historians store additional information with each sample. This additional metadata can include sample quality information, time zone data and the sampling mode used to obtain the data (GE Fanuc Automation, 2006). 2.2.7. Development Methodologies. There are a number of different programming methodologies that aim to bring structure and discipline to the software development process.. This section discusses the traditional. heavyweight waterfall approach in comparison to the more lightweight iterative and agile development methodologies. Waterfall development relies on heavy planning and project management to provide a repeatable, predefined liner development process. The development of code should not be started until all requirements have been determined with requirements being frozen early in the project. Project management techniques such as Gantt charts and milestones should be used through the project lifecycle (Edberg, Ivanova, & Kuechler, 2012). A typical project lifecycle for a project utilizing the waterfall method from the planning to deployment stage could last anywhere from three months to two years (Shore & Warden, 2008) and is shown in Figure 1.. Plan. Analysis. Design. Code. Test. Deploy. 3 – 24 months. = Potential Release. Figure 1: The Waterfall method (Shore & Warden, 2008). The iterative method has many similarities when compared to the waterfall method with the same linear timeline consisting of planning, analysis, design, development, testing and deployment. The iterative condenses this linear timeline into a much shorter period of a one to three month cycle which is repeated over the length of the project; this allows for more frequent releases of software for deployment (Shore & Warden, 2008). An example of the iterative method is shown in Figure 2.. 10.
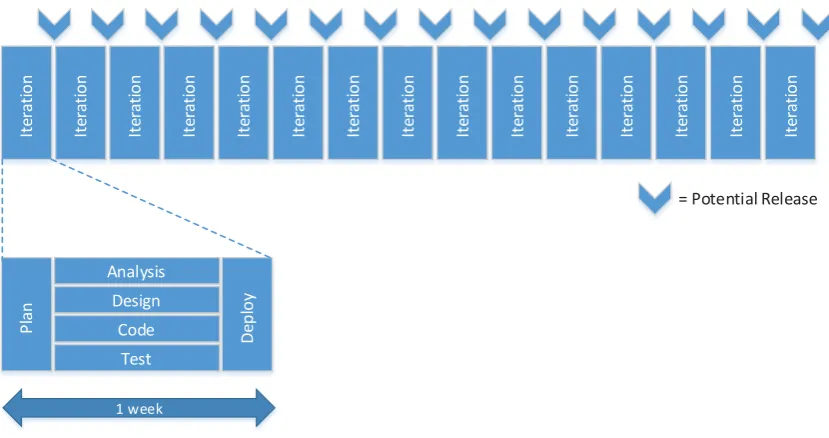
(23) 1 – 3 months. Deploy. Test. Code. Design. Analysis. Plan. p y Deploy. Test. Code. Design. Analysis. Plan. Deploy. Test. Code. Design. Analysis. Plan. 1 – 3 months. 1 – 3 months. = Potential Release. Figure 2: The Iterative method (Shore & Warden, 2008). The agile methodologies provide a much more flexible means of development that is able to accommodate and easily respond to change. Time that would often be devoted to planning is instead spent developing with requirements being continually determined and refined as the project proceeds (Edberg, Ivanova, & Kuechler, 2012). The lifecycle of an agile project is divided into small blocks of approximately a week long with the aim of delivering software that is able to be deployed internally or with customers at the end of each block. After a small amount of planning the analysis, design, coding and testing occur simultaneously building toward the deployment at the end of the week. This approach allows plans to change quickly with new features and changes made available in deployed software within a much shorter timeframe than would be the case with waterfall or iterative development (Shore & Warden, 2008). This. Iteration. Iteration. Iteration. Iteration. Iteration. Iteration. Iteration. Iteration. Iteration. Iteration. Iteration. Iteration. Iteration. Iteration. Iteration. approach is shown in Figure 3.. = Potential Release. Design Code. Deploy. Plan. Analysis. Test 1 week. Figure 3: Agile development (Shore & Warden, 2008). 11.
(24) By definition there are no strict methods by which to perform agile development as it has no concrete practices to follow and may involve an approach that continually changes based on the situation at hand (Shore & Warden, 2008).. 2.3 Summary This chapter has covered a number of components which will be interfaced via the proposed middleware solution. While there are a number of SCADA historian implementations with each generally using a different data storage strategy there are interfaces provided to give access to the stored data. As this data may need to be transferred over the public internet there are methods to secure this data and restrict access to a list of source addresses. Building a reliable, resilient data collector is essential and will require substantial research and testing as existing research isn’t readily available. The data collector will need the ability to collect data that may have been missed due to connectivity or other failures. A relational database such as that offered by SQL Server can provide a large amount of data storage accessible across a number of different platforms. Utilizing correct indexes on the tables within the database is essential to ensure decent performance. Defining a good interface for access to data provided via the middleware is crucial. Once an application programming interface is deployed and integrated into other applications making changes becomes very difficult and a poor interface can make developing downstream software considerably more difficult. Through the use of agile programming methodologies software releases can be produced for testing at regular intervals. The agile approach also allows plans to be quickly changed with new features being introduced throughout the development process being made available quickly in test releases.. 12.
(25) Chapter 3: SCADA Historians This section provides an overview of historians commonly used in the New Zealand Local Government water and wastewater treatment sector. The historian products detailed in this section were selected as they were the most commonly encountered historians in a survey of local government SCADA historian implementations.. 3.1 Citect Historian Citect Historian is produced by Schneider Electric and runs within a Microsoft Windows environment. The historian supports collecting real-time data from Citect SCADA and other open connectivity data access (OPC DA) compliant data sources and can retrieve historic data from trends on Citect SCADA systems. Citect Historian uses the Microsoft SQL Server relational database for storage of collected data and dependent on the historian hardware configuration can store up to 10,000 changes per second into the database. Each piece of collected data is stored with a timestamp and quality flag. Storing this along with the sample value requires 40 bytes of storage for each data point. To reduce the amount of storage required the historian implements a user configurable deadband which prevents new values being written to the database unless the current value is greater or less than the last stored value plus or minus the deadband amount. This prevents small and insignificant changes causing ripples in the stored data. The deadband is configurable per SCADA tag. As Citect Historian uses a Microsoft SQL Server database for data storage a number of methods are available to access the stored data. These methods include native access via ODBC and OLE DB drivers, and managed access using a .NET data access provider. Queries are written using TSQL, a Microsoft proprietary extension to structured query language (SQL). The historian also provides a web interface and plugin for Excel, both of which allow data extraction.. 3.2 GE Proficy Historian Proficy Historian is produced by GE Intelligent Platforms, again for Microsoft Windows platforms. Proficy utilizes individual data collectors implemented for a number of different sources including Proficy HMI/SCADA systems and OPC compliant data sources. The data collectors implement a store and forward architecture to prevent data loss caused by lost connectivity between the historian and data collector. Proficy uses a proprietary data storage solution allowing hundreds of thousands of data points per second to be stored. Raw data can be stored uncompressed with a data size of 6 bytes per. 13.
(26) data point. Data storage requirements can be reduced through the use of a per-tag sampling deadband to filter small insignificant changes to the data value being saved. As the Proficy Historian database is of a proprietary format a Proficy specific component can be required to integrate data from the historian with another system. For this purpose Proficy includes an OLE DB driver and open connectivity historical data access (OPC HDA) interface. OLE DB drivers are discussed in more detail in the next section.. 3.3 Invensys Wonderware Historian Invensys Wonderware Historian is a high-performance historian product that supports up to 500,000 SCADA tags per historian. It runs in a Microsoft Windows environment and is implemented as a time-series extension to Microsoft SQL Server. Implementing the historian in this manner gives the performance and compression advantages of a custom storage format while providing still providing an easy, non-proprietary means of accessing data. In the case of Wonderware Historian the data is accessed via SQL Server through a standard T-SQL implementation with some additional query syntax for accessing historian specific functionality. Microsoft SQL Server has a variety of options available for accessing data, including native access via ODBC and OLE DB drivers, and using the .NET data access provider. This allows Wonderware Historian to be readily accessed from external applications without having any proprietary software or drivers installed on the connecting machine.. 3.4 QTech DATRAN DATRAN is a SCADA solution produced in New Zealand by QTech Data Systems. The DATRAN solution is used across New Zealand in the water & wastewater industry, including in a number of local councils. The DATRAN solution uses an installation of Microsoft SQL Server to store collected data. This results in an access methodology similar to other historians utilizing Microsoft SQL Server, being via ODBC drivers, OLE DB drivers or a .NET data access provider.. 3.5 Hilltop DataTamer Hilltop DataTamer is a suite of products produced in New Zealand by Hilltop Software. The product suite is widely used amongst local and regional councils within New Zealand. Hilltop DataTamer uses a proprietary format for data storage which will reportedly support read speeds of 100,000 rows per second. To facilitate access to this proprietary format stored data a web based module is available. 14.
(27) The web data access module is implemented as a native extension for Internet Information Services 7.5 or higher which requires a minimum operating system of Windows Server 2008 R2 x64 or Windows 7 x64. The module allows requests for site listings, which details sites available to request data from. A list of measurements available for each site can then be requested, from which data for a specified date range can then be obtained. The responses to requests are sent as XML over the HTTP connection made to the module. Utilizing HTTP allows for the connection to be encrypted using HTTPS to prevent the data being intercepted in transit, and also allows authentication to provide a reasonable level of access control and security for the data. An HTTP server also provides a small potential attack surface as the database server containing the data does not need to be directly exposed to the internet. HTTP also provides an inbuilt mechanism for compression to reduce the data transfer bandwidth requirement.. 15.
(28) Chapter 4: Existing Cloud Solution The middleware detailed in this document has been designed to integrate with a New Zealand developed off the shelf product that is used within local and regional government. The software is web-based and hosted for clients from commercial datacentres around the country to provide redundancy and data security. The product is primarily used for compliance monitoring of water and wastewater treatment plants and performs reporting based on manually derived and telemetry sourced data. The middleware is required to integrate with the existing production environment without additional software where possible to simplify deployment to new and existing virtual machines.. Compatibility with the existing hardware and virtual machine. environment is essential to ensure the middleware can be used with existing infrastructure.. 4.1 Production Hardware The existing production hardware consists of a number of 1U rack-mount servers in commercial datacentres around the country. While the specifications of the machines vary based on age the following list gives an approximate overview of a typical production machine: x. 1U rack-mount server. x. Quad core processor. x. 24+ gigabytes memory. x. Hardware based RAID controller. x. Multiple hard disks in a RAID array giving 1-2 terabytes of redundant storage. x. Dual gigabit Ethernet interfaces. These machines have been operating reliably for a number of years without significant downtime or hardware failures. As the service has grown additional machines have been added to allow the service to scale.. 4.2 Production Software The product runs primarily atop Microsoft Windows and Microsoft SQL Server. Each client instance is allocated a virtual machine in the primary datacentre on which their data is held and web portal is hosted. These virtual instances are deployed from a base image containing a Windows installation with SQL Server preinstalled. The following is a list of software loaded in the production image: x. Microsoft Windows Server 2008 R2 x64. x. Microsoft SQL Server 2008 R2 Standard x64. x. Internet Information Services 7.5 running in integrated pipeline mode 16.
(29) x. Microsoft .NET Framework 4.0 with ASP.NET 4.0. x. Web portal application code. Updates to the Microsoft products installed as part of the image are handled via a Windows Server Update Services 3.0 SP2 installation which is configured as the update source. Updates to the web portal code are performed by a custom developed background service which polls an internal server containing MSI packages with updated web portal and background service code. Both the Microsoft updates and web portal updates are installed automatically during a weekly maintenance window at a suitable time contractually agreed with their clients.. 4.3 Production Virtual Machine Software The production virtual machine instances are hosted atop a VMware ESXi v4.1.0 hypervisor, managed by an instance of VMware vSphere Client. New client virtual machines are deployed using VMware vCenter convertor. Utilizing virtual machines for client instances provides the flexibility to move client virtual machine instances easily between servers to balance load as necessary. It also provides redundancy and failover capabilities to unsure uptime requirements are met.. 4.4 Production Network Connectivity in the production environment is provided by two separate networks. An internal network connects all of the client virtual machines hosted on the VMware ESXi server. To facilitate connectivity to the internet another virtual machine is deployed on each ESXi server. This virtual machine runs Debian Linux and has a network interface connected to both the internal network with the client virtual machines and the external network that is connected to the internet. When web requests are made for client virtual machines the HTTP or HTTPS traffic first arrives at the Debian Linux virtual machine. The HTTP or HTTPS request is processed by the open-source web server and proxy nginx. To determine the correct client virtual machine for which the request is intended nginx examines the host headers of the HTTP or HTTPS request. The request is then modified so the response is sent back to nginx, which in turn is forwarded back via the internet to the source of the original request. This approach allows the client virtual machines to be relatively isolated from the internet, with no network interfaces connected to the external network. The Debian Linux machine has only a small number of ports open to requests from the internet, giving a smaller attack surface. As 17.
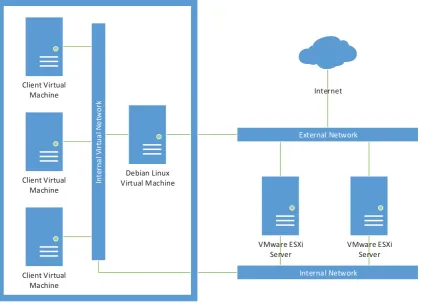
(30) client virtual machines are moved between ESXi server machines communication can be continued without DNS changes as the client virtual machine retains the same IP address on the internal network. To facilitate client virtual machines having access to the internet the Debian Linux virtual machine also performs network address translation via iptables.. The network address. translation process modifies the source and destination of packets as required to route traffic from the client virtual machines to the internet and return responses to the origin.. 4.5 Production Schematic To provide an overview of the production infrastructure including hardware, virtual machines and network configuration a schematic is shown below.. Client Virtual Machine Internal Virtual Network. Client Virtual Machine. Internet. External Network. Debian Linux Virtual Machine. VMware ESXi Server. VMware ESXi Server. Internal Network. Client Virtual Machine VMware ESXi Server. Figure 4: Production environment schematic. 4.6 Implementation Requirements To ensure an easy roll out of the middleware software changes and additions must be kept to a minimum. Any additional software required may need to be manually deployed to each existing client virtual machine, which could amount to a considerable time commitment for staff.. 18.
(31) Additional software will also have resource overheads which may affect the responsiveness of the web portal and resource allocation across the virtual machine pool. Any additional software installed would require a new methodology for deployment of security patches and bug fixes. While this is achieved simply for the Microsoft products currently installed in the image via Windows Server Update Services a generic solution for products from other vendors is not part of the client image. It is imperative to deploy security patches as quickly as possible for internet facing servers to avoid compromise of client data. The commercial solution is provided on a monthly subscription basis to clients, with the software licence costs being integrated as part of this monthly fee. Additional costs of licencing further software may not be agreeable to clients or the solution provider. This provides further incentive to develop a middleware implementation based on the existing Microsoft technologies that are already used in production and are part of the virtual machine image. The contracts with production clients specifies that for disaster recovery purposes a copy of the SQL database containing their data will be transferred to a location they designate on a daily basis. This is supplemented periodically by an installer containing the web portal and associated applications which can be installed on a local server by the client should extended downtime occur in the production environment. The middleware implementation must be installable by clients on a server or virtual machine with specifications and software similar to that of the production virtual machines should the need arise.. 19.
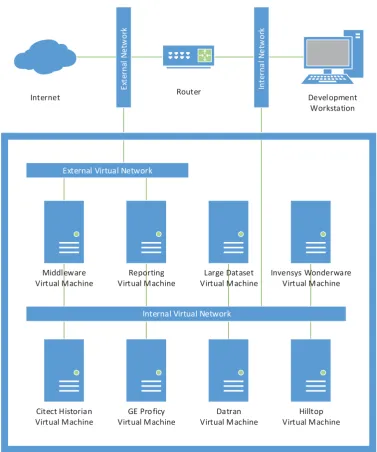
(32) Chapter 5: Investigation and Planning This section details work performed during the investigation and planning stage of the project. This encompassed building a self-contained test and development environment with a number of virtual machine instances used for emulation of the production cloud solution and client historians. After provisioning the development hardware a common interface was planned which when used in production will facilitate access to the middleware implementation. Investigation of potential solutions for aspects of the middleware implementation were then performed to ensure when developed the middleware would achieve the required specifications.. 5.1 Test Environment Hardware To facilitate development and testing of the SCADA middleware a test environment was required. Ensuring compatibility with the production hardware and software was essential, so therefore the test environment used hardware that was as similar as practicably available. To facilitate connection to remote historians a 10 Mb fibre-based internet connection with multiple fixed IP address was used. 5.1.1. Hardware. The hardware provided consisted of a Supermicro 1U rack mount server with specifications as listed below. x. Supermicro SuperServer 5016T-TB 1U rack mount server. x. Intel Core i7-950 Quad-core CPU at 3.06 GHz. x. 24 GB DDR3 1333 MHz non-ECC memory. x. Intel SASWT4I SAS/SATA RAID controller. x. 2x Seagate ST31000333AS 1TB hard disks in RAID1 redundant array. x. 2x Intel 82547L Gigabit Ethernet controllers. The server was mounted in a rack with other development machines and was very similar in specification to the production servers on which the middleware will be used. As multiple virtual machines ran on the server a reasonable amount of RAM was required. The 24GB installed in the server allowed approximately 4GB per virtual machine to be allocated as is described in the following software section. To allow for a high level of availability and data security a RAID1 mirrored array was used. In a RAID1 setup an identical copy of the stored data and application software is stored on each of 20.
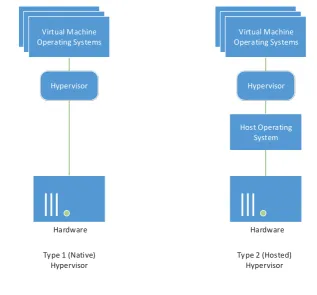
(33) the two hard disks in the array. In the event of a disk failure the machine continues to run as normal on a single hard disk until the failed disk is replaced, at which point the array is rebuilt from the still-functional drive. This setup proved invaluable during development and testing as one of the drives in the machine failed. A replacement drive was sourced while the failed drive was sent for replacement under warranty which ensured the RAID array was restored to an optimal state as quickly as possible. There was no downtime, data loss or other interruptions caused by the drive failure. The Intel hardware RAID controller was used to support this RAID array as software RAID solutions were not supported by the hypervisor used on the server. Two Ethernet ports were available on the server. To facilitate communication with machines on the internal network one of these ports was connected to a gigabit switch shared with other machines on the local network. The other port was connected to the router/switch providing internet access.. 5.2 Test Environment Software The software installed in the test environment was identical to that used in production. To facilitate running multiple distinct machine instances and simulate the disparate nature of the historian, middleware and data consumers a hypervisor was used. 5.2.1. Hypervisor. To facilitate running multiple virtual machine instances on the test environment server a hypervisor was installed. Two options were considered for the hypervisor – the first option being a hosted hypervisor package that ran atop an existing operating system installation. This approach results in a larger amount of abstraction between the hypervisor and the underlying hardware as all access to the server hardware is managed by the operating system hosting the hypervisor.. The hosting operating system also requires memory and additional system. resources, meaning less resource is available to the virtual machines running atop the hypervisor. The second option was a native bare-metal hypervisor that ran on the hardware directly. Without the abstraction of another underlying operating system the hypervisor is free to use and manage system resources as needed. The bare-metal hypervisor has a comparatively low memory requirement and greatly reduced disk space footprint when compared to a hosted hypervisor. Hardware support can be an issue when using a bare-metal hypervisor as it cannot rely on operating system drivers for communication with hardware. The bare-metal hypervisor must contain driver support for all of the hardware in the server on which it will run so will generally run on a more restricted set of hardware. 21.
(34) Virtual Machine Operating Systems. Virtual Machine Operating Systems. Hypervisor. Hypervisor. Host Operating System. Hardware. Hardware. Type 1 (Native) Hypervisor. Type 2 (Hosted) Hypervisor. Figure 5: Hypervisor type comparison. A bare-metal hypervisor was chosen as with a smaller memory and CPU overhead it makes more resource available to the virtual machines it controls. Both VMware ESXi and Microsoft HyperV were considered as compatible options. Each provided support for the full range of hardware in the Supermicro server including the hardware RAID controller and network interfaces. The management tools provided with both hypervisors were suitable and provided a simple means for deploying new virtual machines and monitoring the server hardware. Both hypervisors were available in free editions which provided ample functionality for the test environment. Ultimately VMware ESXi was chosen as the preferred hypervisor. The primary factor in making this decision was integration with the hardware health monitoring system used in the production environment. This meant the test environment hardware could be monitored alongside the production hardware with email alerting should any failures occur. The version of the hypervisor used was VMware ESXi 4.1.0 as to maintain commonality with the production environment. VMware vSphere Client was used for management of the virtual machines, with VMware vCenter Converter being used for deployment of virtual machines from a base image. 5.2.2. Middleware Virtual Machine. The middleware virtual machine was provisioned to run test versions of the middleware as it was developed. To facilitate this the following hardware was provisioned for the virtual machine: 22.
(35) x. Dual-core processor. x. 4 gigabytes RAM. x. 100 gigabyte virtual disk. x. 2x virtual network interfaces. To mirror the production environment as closely as possible the following software was installed: x. Windows Server 2008 R2 Standard x64 with all Windows Update patches. x. SQL Server 2008 R2 Standard Edition SP1. x. .NET Framework 4.0. To facilitate remote deployment and debugging of the middleware the Visual Studio 2010 remote debugger was also installed on the virtual machine. The remote debugger allowed code to be monitored and stepped-through as if it was running locally on the workstation used for development. This meant the code could be monitored without having a full set of development tools installed on the middleware virtual machine. To provide internal network connectivity one of the virtual network interfaces was bound to the internal virtual switch which was in turn bound to an external port connected to the local LAN switch. This local switch was shared with other machines such as the development workstation. The second virtual network interface was bound to the external virtual switch which allowed a direct connection to the router providing internet access. This virtual network interface had a fixed real-world IP address accessible from the internet and allowed connections to client SCADA historians to be made. 5.2.3. Reporting Virtual Machine. In the production environment reporting functionality is accessed by clients using a web-based interface. This web-based interface and corresponding background services generate the report using data sourced from a number of different sources including data collected manually that is populated via the web interface, and laboratory sample test results that are retrieved from laboratory systems. The reporting virtual machine was built to run a modified copy of the production web interface which contained additional code to allow report data from SCADA systems to be sourced via the SCADA middleware. The reporting virtual machine and the middleware virtual machine both resided on the same virtual network switch to allow direct communication between machines. 23.
(36) The virtual hardware provisioned for the reporting virtual machine was the same as used in the production environment. This consisted of the following: x. Dual-core processor. x. 2 gigabytes RAM. x. 50 gigabyte virtual disk. x. 2x virtual network interfaces. The software installed also mirrored the production environment and was as listed below: x. Windows Server 2008 R2 Standard x64 with all Windows Update patches. x. Internet Information Services 7.5 running in integrated pipeline mode. x. SQL Server 2008 R2 Standard Edition SP1. x. Microsoft .NET Framework 4.0 with ASP.NET 4.0. Debugging of the changes made to the web-based reporting interface was performed on a development workstation with the ASP.NET Development Server so the remote debugging toolkit was not required. In a similar manner to the middleware virtual machine one virtual network interface was bound to the internal network and the other bound to the external internet connection. The external connection allowed the reporting web interface to be accessible to clients via their internet connections. 5.2.4. Citect Historian Virtual Machine. To perform testing against a Citect Historian data source a virtual machine with a Citect database was provisioned. The virtual hardware specifications were as below: x. Dual-core processor. x. 4 gigabytes RAM. x. 100 gigabyte virtual disk. x. 1x virtual network interface. The software installed on the virtual machine was as follows: x. Windows Server 2008 R2 Standard x64 with all Windows Update patches. x. SQL Server 2008 R2 Standard Edition SP1. 24.
(37) As Citect Historian uses an SQL Server database to store its configuration and SCADA data an installation of Citect Historian was not required. A backup database of approximately 12 gigabytes in size with around 10 years of historic data was obtained from a client. This database was restored in the instance of SQL Server running on the virtual machine and used as a data source during initial development and testing of the middleware. As the database stored on this machine was static and the machine had no requirement for incoming connections from the internet only a single network interface was necessary. This interface was connected to the internal virtual switch shared with other virtual machines and the local network. 5.2.5. GE Proficy Virtual Machine. To develop and test the interface to GE Proficy Historian a virtual machine was provisioned. The specifications were as follows: x. Dual-core processor. x. 4 gigabytes RAM. x. 100 gigabyte virtual disk. x. 1x virtual network interface. The software installed on the virtual machine was as follows: x. Windows Server 2008 R2 Standard x64 with all Windows Update patches. x. GE Proficy Historian 4.0. As GE Proficy Historian uses a proprietary means to store data an installation of Proficy Historian was required. GE provide a free 25-tag edition of Proficy Historian which was installed on the virtual machine. The historian comes with a built-in simulated data provider which was configured to log samples to the historian database which were then retrieved by the middleware during development and testing. This provided a Proficy Historian data source without requiring any data to be provided by clients. The historian had no requirement for external connections so the network interface of the virtual machine was connected to the internal virtual switch. The middleware connected via this internal interface to retrieve data from the historian. 5.2.6. Invensys Wonderware Virtual Machine. Invensys Wonderware is in use within numerous New Zealand councils, though during development of the middleware it was not possible to negotiate access to a live installation of 25.
Figure
+7
Related documents
Methods: A follow-up study 5.5 years after the explosion, 330 persons aged 18 – 67 years, compared lung function, lung function decline and airway symptoms among exposed
It was decided that with the presence of such significant red flag signs that she should undergo advanced imaging, in this case an MRI, that revealed an underlying malignancy, which
Also, both diabetic groups there were a positive immunoreactivity of the photoreceptor inner segment, and this was also seen among control ani- mals treated with a
Figure 10: Distribution of Scores on the Social Desirability Scale...89.. Aggression can occur in numerous ways and in many different contexts. A search of the literature revealed
The use of sodium polyacrylate in concrete as a super absorbent polymer has promising potential to increase numerous concrete properties, including concrete
19% serve a county. Fourteen per cent of the centers provide service for adjoining states in addition to the states in which they are located; usually these adjoining states have
Assessing the Impact of Biodiversity Conservation in the Management of Maize Stalk Borer (Busseola f
Field experiments were conducted at Ebonyi State University Research Farm during 2009 and 2010 farming seasons to evaluate the effect of intercropping maize with
