Predicting fire in rainforest
by
Jennifer Karin Styger BSc. Hons.
School of Geography and Environmental Studies
Submitted in fulfilment of the requirements for the degree of Doctor of Philosophy
ii This thesis contains no material which has been accepted for a degree or diploma
by the University or any other institution, except by way of background information and duly acknowledged in the thesis, and to the best of my knowledge and belief no material previously published or written by another person except where due acknowledgement is made in the text of the thesis, nor does the thesis contain any material that infringes copyright.
Signed:
Jennifer Styger
September 2014
Authority of access
This thesis may be made available for loan. Copying of any part of this thesis is prohibited for two years from the date this statement was signed; after that time limited copying is permitted in accordance with the Copyright Act 1968.
Jennifer Styger
iii Cool-temperate rainforest occurs widely within south-west and western Tasmania, where it occurs interspersed with buttongrass moorlands. Rainforest is considered to be a climax vegetation, capable of regenerating in the absence of a major disturbance event, such as fire. Rainforest is also considered to be a fire sensitive community, as many rainforest species are incapable of surviving a fire event. Although fire in rainforest is rare, large rainforest fires have occurred in the past. These fire events are likely to increase with future climate change, which may result in a substantial loss of rainforest communities. It is important to understand the conditions under which fire will sustain and spread within rainforest as this will aid in protective measures, such as hazard-reduction burning, and the allocation of resources during a wildfire.
In this study, I ask, under what conditions it would be likely that a fire would sustain and spread within rainforest. In order to do this the flammability and microclimate of a callidendrous rainforest, implicate rainforest and deciduous beech montane rainforest were characterised. The canopy structure and rainfall distribution of the callidendrous rainforest were also examined. There was very little difference in the flammability of live leaf and litter components between the three rainforest communities and adjacent fire tolerant communities, with the exception of the bark component from a Eucalyptus coccifera woodland. Callidendrous and implicate rainforests were cooler, more humid and less windy than adjacent open areas. There was very little difference in temperature and vapour pressure deficit between the deciduous beech forest and the adjacent open area. The distribution of rainfall within a callidendrous rainforest was found to be heterogeneous. Two millimetres of rain was required to saturate the rainforest canopy. On average, 20% of rainfall was intercepted.
The Soil Dryness Index (SDI) is a tool used by fire managers to provide an indication of drought conditions and is also a component of the McArthur Forest Fire Danger Index (FFDI) in
iv Twelve historical fires that either burned into, or stopped at rainforest boundaries, were
v So many people helped during the scope of this project and to them I wish to express my
sincerest gratitude.
Firstly, I would like to thank my primary supervisor, Jamie Kirkpatrick, for his outstanding guidance, foresight and assistance over the course of this project.
Special thanks also go to Maj-Britt di Folco, Adrian Pyrke, Greg Unwin, Tony Mount, Dave Taylor, Mark Chladil, Sandy Whight, Paul Fox-Hughes, Manuel Nunez and Chris Dean for advice on the project, expert knowledge on many subjects, the provision of many hard-to-get-hold-of references and often pointing me in the right direction, as well as comments on the draft manuscript.
The following people provided invaluable field assistance and company; Steve Leonard, Jamie Kirkpatrick, Sam Wood, Jeremy Little, Gwen Styger, Chris Dean, Dave and Molly Fleming.
The Parks and Wildlife Service fire crew assisted with the final leg of field work; chain sawing and (attempting to) light up my site. Thank-you to Linda Walker, Andrew Cargill, Neville Ward, Daral Petersen and Adam Burt.
Jayne Balmer and Vishnu Prahalad were of enormous assistance, providing expert mapping advice. Jon Marsden-Smedley provided aerial photographs and climate data, while Dave Green and Darren Turner, as always, provided invaluable technical assistance.
Pep Turner and Paddy Dalton assisted with bryophyte identification.
Jennie Whinam assisted with the necessary permits; Tony Blanks and Gary Button generously came into the field and provided support for experimenting with fire in rainforest.
The Parks and Wildlife Service and Forestry Tasmania provided the use of their land for field work.
This project was largely funded by a grant from the Tasmanian Fire Research Fund.
I would also like to thank all the staff and students in the School of Geography and
vii
Declaration...ii
Authority of access...ii
Abstract...iii
Acknowledgements...v
List of Tables...xii
List of Figures...xiv
List of Plates...xvii
Chapter 1 –Introduction...1
1.1 Background...1
1.2 Rainforest distribution...2
1.3 Definition of Australian rainforest...3
1.3.1 Tasmanian cool-temperate rainforest...4
1.3.2 Mixed forest...4
1.4 Rainforest and fire in Tasmania...5
1.4.1 Mitigating rainforest fires – hazard reduction burning...7
1.5 Fire danger indices...8
1.5.1 McArthur Forest Fire Danger Index...8
1.5.1.1 Soil Dryness Index...8
1.5.1.2 Drought Factor...9
1.5.2 Canadian Forest Fire Weather Index...10
1.6 Thesis aims...11
1.7 Structure of thesis...12
Chapter 2 – Study sites...13
viii
2.1.3 Site DB...16
2.1.4 Site Org...16
2.1.5 Control 1...17
2.1.6 Control 2...17
2.1.7 Control 3...18
2.2 Measurements of fuel moisture...18
2.3 Automatic weather station measurements...18
Chapter 3 – Flammability of rainforest components...20
3.1 Introduction...20
3.2 Methods...22
3.2.1 Study sites, site establishment and sampling procedure...22
3.2.2 Laboratory flammability experiments...24
3.2.2.1 Laboratory procedures...24
3.2.2.2 Flammability...25
3.2.2.3 Moisture content...26
3.2.3 Field flammability experiments...27
3.2.3.1 Test fire procedure...27
3.2.3.2 Weather data collection...27
3.2.4 Data analysis...28
3.2.4.1 Laboratory flammability experiments...28
3.2.4.2 Field flammability experiments...31
3.3 Results...31
3.3.1 Leaf samples...31
3.3.2 Woody litter samples...39
ix
Chapter 4 – Structure of the rainforest canopy...50
4.1 Introduction...50
4.2 Methods...54
4.2.1 Site selection...54
4.2.2 Distribution of rain gauges...54
4.2.3 Data collection...54
4.2.4 Data analysis...55
4.3 Results...58
4.3.1 Temporal variation...60
4.3.2 Spatial analysis...65
4.3.3 Canopy saturation and interception...71
4.4 Discussion...74
Chapter 5 – Predicting rainforest microclimate...81
5.1 Introduction...81
5.1.1 Rainforest microclimate...81
5.2 Methods...82
5.3 Results...83
5.3.1 Air temperature...85
5.3.2 Vapour pressure deficit...88
5.3.3 Wind speed and direction...91
5.4 Discussion...92
Chapter 6 – Soil Dryness Index...98
6.1 Introduction...98
6.2 Methods...99
x
7.1 Introduction...111
7.2 Methods...111
7.2.1 Calculation of the Forest Fire Danger Index...111
7.2.2 Rainforest mapping...112
7.2.3 Data analysis...112
7.3 Results and Discussion...112
7.3.1 Individual fires...114
7.3.1.1 1933/34 fire...114
7.3.1.2 Savage River fire...114
7.3.1.3 Harrison’s Opening fire...115
7.3.1.4 Cape Sorell fire...115
7.3.1.5 Mount Frankland-Donaldson fire...115
7.3.1.6 Mount Castor fire...116
7.3.1.7 Cracroft River fire...116
7.3.1.8 Reynolds Creek fire...116
7.3.1.9 Heemskirk Road fire...117
7.3.1.10 Kilmore East – Murrindindi fire...117
7.3.1.11 Lake Mackintosh fire...118
7.3.1.12 Giblin River fire...120
7.3.2 Integration of historical fire data...121
Chapter 8 – Discussion and conclusions...125
8.1 Introduction...125
8.1.1 Community flammability...125
8.1.2 Predictors of rainforest fire...126
xi Appendix 1 – Input variables for calculating the FFDI for each fire...143
xii Table 2.1 Site variables...14
Table 2.2 Automatic weather station variables measured and instruments
used for each site...19
Table 3.1 Species examined for the flammability experiments and their collection
location...22
Table 3.2 Beaufort scale for estimating wind velocity...28 Table 3.3 Community scores for all leaf species examined...29 Table 3.4 Tukey’s multiple range comparison test for species against residuals
of rate of spread and moisture content...32
Table 3.5 General linear model for response variables to rate of spread (mm s-1)
for foliar leaf species...33
Table 3.6 Regression equations, P-values and R-sq for the relationship between
rate of spread (mm s-1) and percentage moisture loss of leaf species...35
Table 3.7 Surface area to volume ratios of foliar leaf species...36 Table 3.8 Pearson’s product moment correlation coefficients for surface area
to volume ratio and rate of spread (mm s-1) for the six foliar species
across all drying times...36
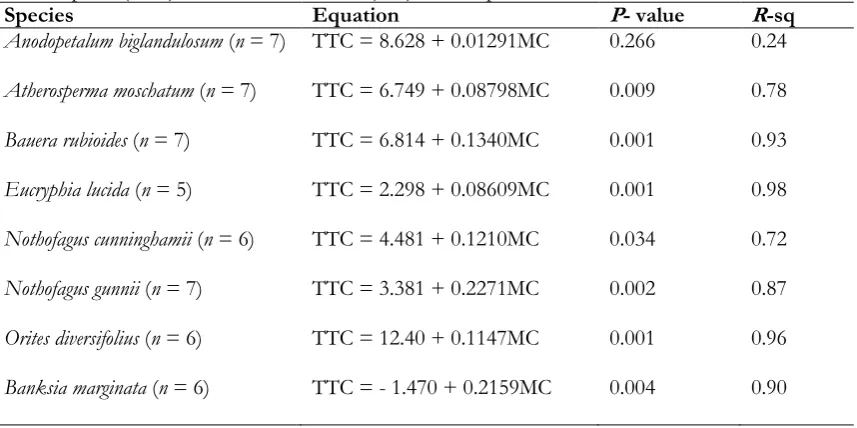
Table 3.9 Regression equations, P-values and R-sq for the relationship between
time to consumption and moisture content of leaf species...37
Table 3.10 General linear model for response variables to time to ignition for all
foliar leaf species...38
Table 3.11 Mean values and results of one-way ANOVA for litter size classes and
rate of spread (mm s-1) between different vegetation types...39
Table 3.12 Mean values and results of one-way ANOVA for rate of spread (mm s-1)
for litter fuel components in each vegetation type...39
Table 3.13 Regression equations, P-values and R-sq for the relationship between rate of spread (mm s-1) and surface area to volume ratio of litter samples
in all size classes...40
Table 3.14 Regression equations, P-values and R-sq for the relationship between
time to sustained ignition and dead fuel moisture content for the litter samples...41
Table 4.1 Abbreviations associated with canopy interception that occur in Chapter 4...51
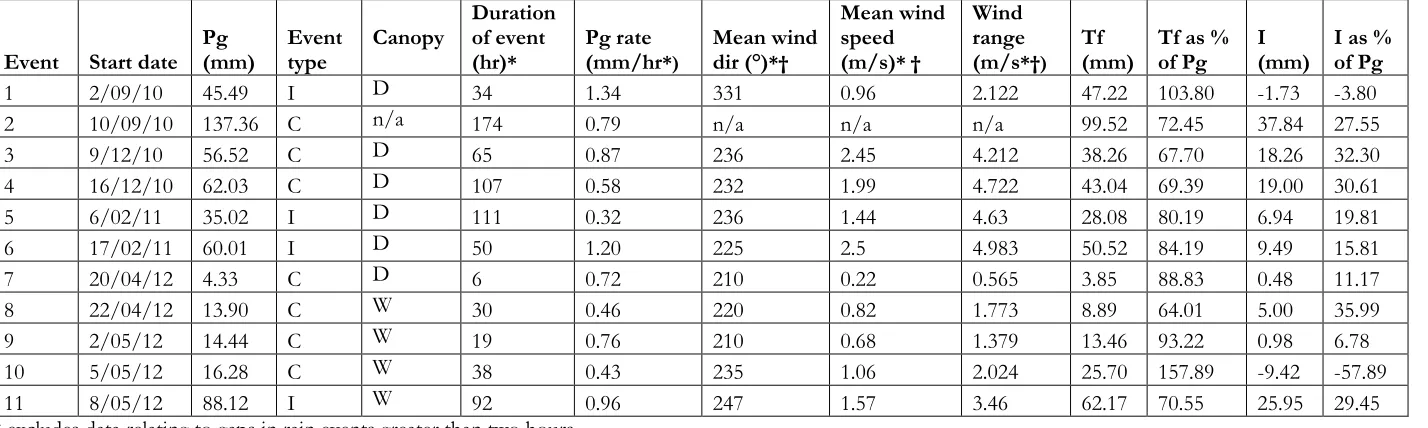
Table 4.2 Rainfall event number, start date of each event, gross rainfall, event type, canopy status at the start of each event, the duration of each event in hours, rainfall rate, mean wind direction, mean wind speed, wind speed range, throughfall, throughfall as a percentage of gross rainfall, interception,
xiii variable inside and outside the forests and the variable at the control...84
Table 6.1 Altered evapo-transpiration values (mm/day). Mount values multiplied by 0.5...100
Table 6.2 Altered evapo-transpiration values (mm/day). Mount values multiplied by 1.25...100
Table 6.3 Name of weather station and its altitude used to record the Soil Dryness Index within south-west Tasmania, areas bordering
south-west Tasmania, and the west coast of Tasmania...109
Table 7.1 Summary table of fires and Forest Fire Danger Index...113
Table 7.2 Percentage rainforest burned, rainfall in the previous 30 days preceding the fire, rainfall in the previous 60 days preceding
the fire and Soil Dryness Index (SDI)...121
Table 7.3 Results of Wilcoxon rank sum tests for determinants of successful rainforest fires...124
Table 8.1 Soil Dryness Index guidelines for hazard-reduction burning in different
xiv
Figure 1.1 Distribution of rainforest within Australia...2
Figure 1.2 Structure of the Canadian Forest Fire Weather Index System...11
Figure 2.1 Location of study sites within Tasmania and nearby localities...13
Figure 3.1 Interval plot of residuals from the regression of rate of spread (mm s-1) on moisture content for each species...32
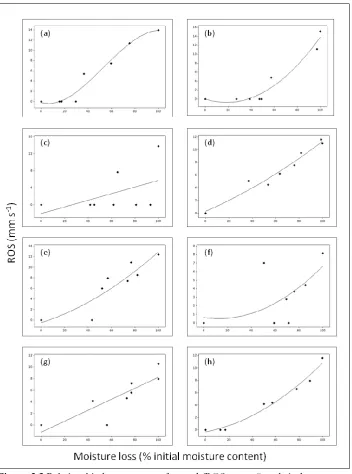
Figure 3.2 Relationship between rate of spread (mm s-1) and air dry moisture loss...34
Figure 3.3 Interval plot for surface area to volume ratio of foliar leaf species...35
Figure 3.4 Relationship between time to consumption and moisture content of leaves of selected species...37
Figure 3.5 Relationship between time to ignition of leaves of selected species and hours air drying...38
Figure 3.6 Relationship between time to sustained ignition of litter material and different litter moisture contents...41
Figure 3.7 Interval plot of time to sustained ignition of litter and litter size class for callidendrous forest litter across all moisture contents...42
Figure 3.8 Interval plot of time to sustained ignition of litter and litter size class for deciduous beech scrub litter across all moisture contents...42
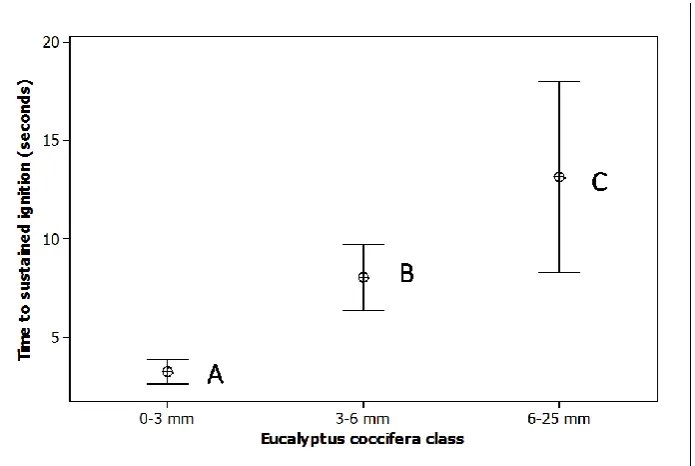
Figure 3.9 Interval plot of time to sustained ignition of litter and litter size class for Eucalyptus coccifera woodland litter across all moisture contents...43
Figure 4.1 Size of rainfall events and sub-events...60
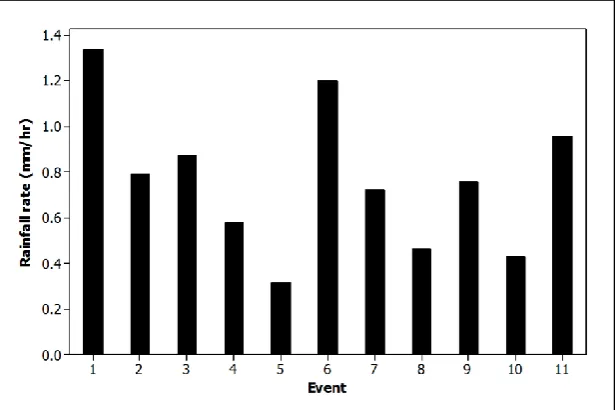
Figure 4.2 Rate of rainfall (mm/hr) for each of the 11 rainfall events...61
Figure 4.3 Rate of rainfall (mm/hr) of events and sub-events...61
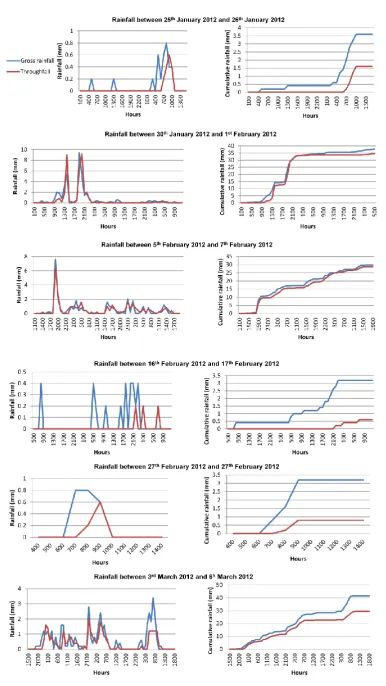
Figure 4.4 Total and cumulative gross rainfall and throughfall for separate events over time...63-64 Figure 4.5 Hemispherical canopy images taken at the site of each funnel rain gauge for gauges 1-12...67
Figure 4.6 Hemispherical canopy images taken at the site of each funnel rain gauge for gauges 13-25...68
xv Figure 4.9 Gross rainfall and throughfall for all events and sub-events...72
Figure 4.10 Gross rainfall and interception for all events and sub-events...73
Figure 4.11 Relationship between interception as a percentage of gross
rainfall and rainfall rate...74
Figure 5.1 Relationship between for each variable and the corresponding
variable at the control...85
Figure 5.2 Frequency histogram of the between inside and outside forest conditions for all temperatures greater than 25 °C and relative
humidities less than 25% at Control 1, for Site Call and Control 1...86
Figure 5.3 Frequecny histogram of the between inside and outside forest
conditions for all temperatures (°C) at Site Call and Control 1...86
Figure 5.4 Frequency histogram of the between inside and outside forest conditions for all temperatures (°C) at Site Call and Control 1 when
the total solar radiation is greater than 1.5 MJ/m2 at Control 1...86
Figure 5.5 Frequency histogram of the between inside and outside forest
conditions for all temperatures (°C) at Site Imp and Control 1...87
Figure 5.6 Frequency histogram of the between inside and outside forest conditions for all temperatures (°C) at Site Imp and Control 1 when
the total solar radiation is greater than 1.5 MJ/m2 at Control 1...87
Figure 5.7 Frequency histogram of the between inside and outside forest
conditions for all temperatures (°C) at Site DB and Control 2...87
Figure 5.8 Frequency histogram of the between inside and outside forest conditions for all temperatures (°C) at Site DB and Control 2 when
the total solar radiation is greater than 1.5 MJ/m2 at Control 2...87
Figure 5.9 Frequency histrogram of the between inside and outside forest conditions for all temperatures (°C) from 1/12/2010 to 28/2/2011
for Site DB and Control 2...88
Figure 5.10 Frequency histogram of the between inside and outside forest conditions for vapour pressure deficit (kPa) when temperatures are greater than 25 °C and relative humidities less than 25% at
control 1, for Site Call and Control 1...89
Figure 5.11 Frequency histogram of the between inside and outside forest
conditions for vapour pressure deficit (kPa) at Site Call and Control 1...89
Figure 5.12 Frequency histogram of the between inside and outside forest conditions for vapour pressure deficit (kPa) at Site Imp and Control 1
xvi Figure 5.14 Frequency histogram of the between inside and outside forest
conditions for vapour pressure deficit (kPa) when the total solar
radiation is greater than 1.5 MJ/m2 at Control 1...90
Figure 5.15 Frequency histogram of the between inside and outside forest
conditions for vapour pressure deficit (kPa) at Site DB and control 2...90
Figure 5.16 Frequency histogram of the between inside and outside forest conditions for vapour pressure deficit (kPa) at Site DB and Control 2
when the total solar radiation is greater than 1.5 MJ/m2 at Control 2...90
Figure 5.17 Frequency histogram of the between inside and outside forest conditions for vapour pressure deficit (°C) from 1/12/2010 to
28/2/2011 for Site DB and Control 2...91
Figure 5.18 Frequency histogram of the between inside and outside forest
conditions for wind speed (m/s) at Site Call and Control 1...91
Figure 5.19 Frequency histogram of the between inside and outside forest
conditions for wind speeds (m/s) at Site DB and Control 2...92
Figure 5.20 Frequency histogram of the between inside and outside forest conditions for wind speeds (m/s) from 1/12/2010 to 28/2/2011
for Site DB and Control 2...92
Figure 6.1 Site Call average daily volumetric soil moisture and 24 hour rainfall
(mm) until 9.00 am between 24 March and 27 May 2012...102
Figure 6.2 Site Org average daily volumetric soil moisture and 24 hour rainfall
(mm) until 9.00 am for Mount Read between 22 February and 24 April 2011...102
Figure 6.3 Average daily volumetric soil moisture and daily Soil Dryness Index
for Site Call between 31 January and 27 May 2012...103
Figure 6.4 Average daily volumetric soil moisture and daily Soil Dryness Index
for Site Org between 22 February and 24 April 2011...103
Figure 6.5 Relationship between average daily volumetric soil moisture at Site Call
and 9.00 am rainfall at Control 1...104
Figure 6.6 Relationship between average daily volumetric soil moisture at Site Org
and 9.00 am rainfall at Mount Read...104
Figure 6.7 Comparison of the Soil Drynee Index calculated for interception class B and F for Scotts Peak Dam automatic weather station from 1 January to
xvii
Plate 5.1 Automatic weather station at Site DB in winter...94
Plate 7.1 Lake Mackintosh, showing burned stags of dead trees protruding from the lake...118
Plate 7.2 Rainforest burned on the edge of Lake Mackintosh on 31 January 2010...119
1.1
Background
Rainforest is an overarching term that generally refers to the lush, cool and shady forests that are so obviously different from the eucalypt forests and woodlands that dominate Australia.
Rainforest communities occur along the eastern seaboard of Australia, with small patches also occurring in the Northern Territory and Kimberly region of Western Australia (Adam 1992; Bowman 2000; Lynch and Neldner 2000). Within Tasmania, rainforest occurs mainly in the west coast and south-west regions of the Island (Jarman and Brown 1983). Rainforest communities are composed of shade-adapted species that are capable of regeneration in the absence of disturbance (Jarman and Brown 1983; Lynch and Neldner 2000). Rainforest species generally show an intolerance of fire, particularly when compared to their eucalypt neighbours (Jackson 1968; Read 2005; Wood et al. 2011; Little et al. 2012). For this reason, rainforest communities are considered to be fire-sensitive (Brown and Podger 1982; Bowman and Brown 1986; Cullen and Kirkpatrick 1988) with fire resulting in either a loss of integrity of the community or its complete destruction (Hill and Read 1984; Shearman et al. 2009). However, the occurrence of fire in rainforest is rare. This has been thought to be due to the low flammability of foliage, a humid microclimate and a low fuel load (Jackson 1968), as well as the propensity for rainforest to occur in topographic fire refugia (Wood et al. 2011). Nevertheless, under extreme weather conditions of high temperature, low humidity and high soil dryness rainforest will occasionally burn (Hill 1982; Barker 1991; Marsden-Smedley 1998; Cruz et al. 2012).
Global climate change is predicted to result in an average warming of the earth’s surface and ocean temperatures. In Tasmania, climate change modelling predicts an increase in temperatures across the State. Although the total annual rainfall is unlikely to change across Tasmania, there is predicted to be a change in regional patterning and seasonality, with a decrease in summer rainfall predicted for the west coast of Tasmania. Combined with an increase in pan evaporation over the summer months, the west coast of Tasmania is predicted to become drier (Grose et al.
2010). These drier conditions are likely to increase the frequency and severity of bushfires
2 Currently the conditions under which rainforest will sustain fire are unknown. Detailed studies have determined fire behaviour and sustainability for buttongrass moorlands (Marsden-Smedley 1998), grasslands (Leonard 2009) and dry eucalypt forest (Luke and McArthur 1978; Gould et al.
2007) but no such model exists for rainforest. Given the predictions of climate change for western Tasmania, an understanding of the fire potential of rainforest is needed.
1.2 Rainforest distribution
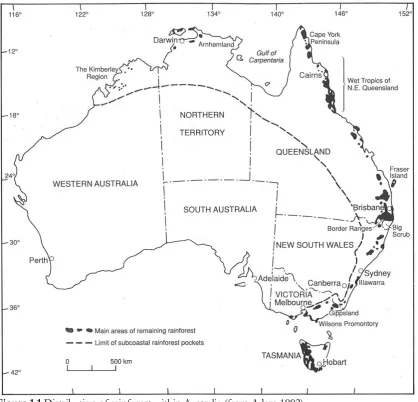
[image:19.595.76.495.350.752.2]Within Australia, communities known as rainforest extend from the cool-temperate zone of Tasmania at 44° S, to the very tip of the Cape York Peninsula in the tropics at 10° S (Adam 1992; Bowman 2000; Lynch and Neldner 2000). There are also small patches extending into the Northern Territory and northern Western Australia (Figure 1.1; Adam 1992; Bowman 2000).
3 Rainforest in Australia can occur in regions of annual rainfall varying from 600 mm to 3,600 mm, and on soils varying in fertility from high to extremely low (Bowman 2000). Rainforest also has a wide altitudinal range, occurring from sea level to the altitudinal limit of forest vegetation (Bowman 2000). However, its distribution within this potential range is highly restricted (Figure 1.1).
1.3 Definition of Australian rainforest
The definition of rainforest as a community has proved difficult (Jarman and Brown 1983; Lynch and Neldner 2000; Bowman 2000) and is often avoided altogether (Adam 1992). This difficulty in definition is partly due to different national and regional perceptions (Adam 1992). Herein, definitions of rainforest will be limited to those that have been developed for Australian forests, as well as some definitions that are applicable only to communities of rainforest occurring in Tasmania. However, even within Australia, the definition of rainforest can be problematic.
A number of complex taxonomic systems have been developed in attempt to classify Australian rainforest types however little agreement between authors and regions has been reached
(Bowman 2000). Bowman (2000) lists a number of classificatory systems that can be used to define rainforest. These include, rainforest defined by climatological parameters; rainforest defined by a priori description; rainforest defined by diagnostic life forms; rainforest defined by forest floor light environment; rainforest defined by biogeographically distinct taxa; rainforest defined by fire susceptibility; and rainforest defined by what it is not (Bowman 2000).
4 outliers occurring at high altitude sites in New South Wales and Queensland (Lynch and Neldner 2000).
1.3.1 Tasmanian cool-temperate rainforest
To overcome problems of a national rainforest definition many researchers have chosen to define and classify rainforest on a local scale (e.g. Webb (1959) in Queensland; Jarman and Brown (1983) in Tasmania; Floyd (1990) in New South Wales; and Russell-Smith (1991) in the Northern Territory). In Tasmania, cool-temperate rainforest has been defined using floristic composition and regeneration processes (Jarman and Brown 1983). This definition includes those communities dominated by trees of Nothofagus, Atherosperma, Eucryphia, Athrotaxis,
Lagarostrobos, Phyllocladus or Diselma and able to regenerate, either vegetatively or from seed, in the absence of large-scale disturbance, such as fire. Tasmanian rainforest has been further classified into four forest types; callidendrous, thamnic, implicate and open montane rainforest (Jarman et al. 2005). The former three forest types intergrade in terms of floristics and structure, with the latter recognised more readily as a distinct group, occupying higher altitudes and dominated by
Athrotaxis cupressoides (Jarman et al. 2005). Callidendrous rainforests are typically medium to tall forests dominated by Nothofagus cunninghamii, with Atherosperma moschatum present as a sub-canopy species. There is very little understorey and a very low diversity of angiosperms within these forests, however, bryophytes and lichens are plentiful and diverse (Jarman et al. 2005). Implicate rainforests are typically low in stature with broken, uneven canopies. The understorey is tangled and often forms a continuous layer from the ground to the canopy. Implicate rainforest tends to occupy less productive sites. Common dominant species include Athrotaxis selaginoides and
Nothofagus gunnii (Jarman et al. 2005). Thamnic rainforest is intermediate between callidendrous and implicate rainforests (Jarman et al. 2005). Low-statured forests dominated by the highly fire-sensitive deciduous beech (N. gunnii) also frequently occur in the subalpine regions of Tasmania (Jackson 2005).
1.3.2 Mixed forest
Frequently a transition zone occurs between stands of rainforest and the adjacent non-rainforest vegetation. This ecotone is characterised by tall eucalypts above a continuous rainforest
5 community, known as mixed forest (Bowman 2000). Mixed forests occur frequently in
Tasmania, Victoria and New South Wales and are often interpreted as a rainforest invasion of tall eucalypt forest (Adam 1992). The fuel loads of mixed forests are higher than those of rainforest and the eucalypt species require fire or other canopy-removing disturbance for regeneration. If fire is absent from these communities for a sufficiently long period of time, the eucalypts will senesce and the mixed forest will succeed to rainforest (Gilbert 1959; Jackson 1968; Adam 1992; Bowman 2000). This mixture of rainforest and eucalypt forest hinders neat definitions of rainforest. In Tasmania, pure rainforest has arbitrarily been defined as having less than 5% eucalypt canopy; however, there is no evidence of any difference in stand ecology above or below this limit (Adam 1992).
1.4 Rainforest and fire in Tasmania
A mosaic of vegetation communities occurs in the rainforest rich regions of western and south-western Tasmania. Jackson (1968) proposed a model of succession, or ‘ecological drift’ whereby vegetation becomes increasingly flammable as the interval between fires decreases. Buttongrass moorlands, dominated by the sedge Gymnoschoenus sphaerocephalus, are considered the most flammable community of western Tasmania and consequently require the most frequent fire (Jackson 1968; Marsden-Smedley 1998). As communities grade from moorland into scrub and sclerophyll forest, they become increasingly less flammable and the interval between fires becomes greater (Jackson 1968). Rainforest is considered to be the climax vegetation and will frequently share boundaries with the highly flammable moorland. Despite these shared
boundaries, fire in rainforest is uncommon (Jackson 1968; Barker 1991; Marsden-Smedley 1998; Read 2005). When fire does occur in rainforest, the intensity is often low (Hill 1982) and the penetration shallow. Nevertheless, on occasion, fire will sustain itself within rainforest, burning large tracts. In Tasmania this was recorded in the 1933/34 fire as well as the 1938/39 fire, where crowning was observed in rainforest (Marsden-Smedley 1998). In 1982 a large fire burned in rainforest near Savage River. In this fire, rainforest was observed burning at a variety of intensities, with peat fires, surface fires, canopy fires and scorching all recorded (Barker 1991).
6 was able to regenerate to rainforest. They concluded that this was due to an absence of wet sclerophyll species within seed dispersal distance of the burned area. Conversely, in the same study, burned areas of mixed forest and rainforest adjacent to wet sclerophyll communities showed a significant reduction in rainforest species and an increase in the range and dominance of the sclerophyll component (Hill and Read 1984). This observed rise in the sclerophyll species increased the flammability of the community, with the chance of a second fire occurring before the regenerating rainforest element reached reproductive maturity becoming greater (Jackson 1968; Hill and Read 1984). Another risk of fire to rainforest is to the community composition of the forest. Although it has been shown that certain rainforest species are able to regenerate after fire, albeit at a competitive disadvantage (Mount 1979; Hill and Read 1984; Read 2005) there are other common rainforest species that show very little capacity to survive fire. These are
invariably killed by a fire event (Read 2005). Many of the conifers including Lagarostrobos franklinii, Phyllocladus aspleniifolius, and Athrotaxis selaginoides, as well as species such as Nothofagus gunnii, are highly sensitive to fire. Recovery only occurs by seed dispersal from unburned stands, which can often take decades (Read 2005). Thus, a fire in rainforest containing any of these species can be disastrous (Kirkpatrick 1986). As such, it can be concluded that in Tasmania, most fires in most rainforests will have a deleterious effect.
7
1.4.1 Mitigating rainforest fires - hazard reduction burning
Prescribed burning is a commonly used method of reducing the chance of wildfires in areas where fire exclusion is desired. Prescribed burning is defined as the deliberate application of fire to fuels under specified conditions such that well-defined management goals are attained
(Fernandes and Botelho 2003). Prescribed burning can be conducted for ecological management purposes (ecological burning), for fuel reduction (hazard-reduction burning) or for a
combination of both. Ecological burning is conducted to provide the requirements for fauna or flora that require particular fire regimes (Askey-Doran 1995; Marsden-Smedley 1998). While the aims of hazard-reduction burning are primarily asset protection, ecological outcomes are often met as hazard-reduction burns aim to broaden the weather conditions under which effective fire suppression can be performed and to provide a landscape within which effective fire
management can be maintained (Marsden-Smedley 1998; King et al. 2006). This has ecological advantages for fire sensitive species and communities, as an increase in hazard-reduction burning leads to a decrease in the amount of fire-sensitive vegetation burned (King et al. 2006). Both facets of prescribed burning generally aim to create a landscape mosaic of various fire ages.
Hazard-reduction burning has been shown to be an effective means of reducing the chance of landscape scale fire under most conditions (Fernandes and Botelho 2003; Gould et al. 2007). However, due to the requirement that hazard-reduction burns be conducted in marginal weather conditions, so as to decrease the chance of fire escape, many burns are ineffective in adequately reducing fuel (Fernandes and Botelho 2003). In Tasmania, buttongrass moorland is one of the major vegetation communities in which hazard-reduction burning is undertaken (King et al. 2006; Marsden-Smedley 2009). The implementation of hazard-reduction burning in buttongrass
moorland aims to remove 70% of the flammable fuel from 70% of the site (Marsden-Smedley et al. 1999). Modelling by King et al. (2006) has shown that performing hazard-reduction burns in buttongrass moorlands can substantially reduce the amount of fire sensitive vegetation burned in unplanned wildfires. They propose a prescribed burning regime of 5-10% of moorland annually, to achieve the multiple management objectives of reducing fire size and fire intensity,
8 hazard-reduction burns can occur and thus their effectiveness. An obvious secure boundary for moorland hazard-reduction burning is cool-temperate rainforest, due to its cool, humid
microclimate and the postulated low flammability of its component vegetation (Read 2005). A clear understanding of the conditions under which rainforest will or will not burn is therefore of paramount importance in planning and implementing burning programs. This knowledge could allow for planned burning to be undertaken under a greater range of conditions, thus extending the season in which it can occur, as well as facilitating more effective fuel removal.
1.5 Fire danger indices
1.5.1 McArthur Forest Fire Danger Index
Fire Danger Ratings (FDR) are based on local weather conditions and make predictions on fire behaviour and suppression chances if a fire were to ignite. FDRs are based on fire danger indices which differ between vegetation types. In southern Australia, fire danger indices have been developed for forest and grasslands (Luke and McArthur 1978) with the McArthur Forest Fire Danger Index (FFDI) used in the forested regions of Tasmania. The FFDI was derived from approximately 400 experimental forest fires, conducted in dry sclerophyll forests with a fuel load of up to 12 t/ha (Williams et al. 2001) and consequently does not necessarily apply well to other Australian forest types, such as rainforest. Inputs for the FFDI are based on standard data from Bureau of Meteorology stations based in open locations and include information about the soil dryness (the Soil Dryness Index in Tasmania), temperature, humidity and wind speed data. There is no explicit calculation of fuel moisture within the FFDI, instead fuel moisture is calculated implicitly by the inclusion of air temperature and relative humidity (Matthews 2009) while the inclusion of a Drought Factor provides information about long term rainfall occurrence and drying effects (Matthews 2009).
1.5.1.1 Soil Dryness Index
9 dryness of the fine litter layer on its surface, a moist soil profile will result in a moist litter layer, with a dry soil profile resulting in a dry litter layer. Furthermore, soil dryness affects the rate of transpiration through vegetation (Mount 1972) with the rate of transpiration decreasing as the soil profile becomes increasingly drier. If water loss continues, green leaves may eventually die, increasing the fuel flammability (Mount 1972). Thus, the dryness of the soil profile has an important effect on fire behaviour, increasing the flammability of the surface and canopy fuels. The SDI is based on the North American Keetch-Byram Drought Index (KBDI; Keetch and Byram 1968). This index was modified to derive the SDI using Australian hydrologic research conducted largely by Bell and Gatenby (1969). The SDI is driven by the meteorological variables of rainfall and maximum temperature with the derived value corresponding to the amount of rain required (in millimetres) to return the soil profile to field capacity (Chladil and Nunez 1995). However, soil dryness can be influenced by factors other than run-off, such as soil type and soil hydrophobocity (Sullivan 2001). The KBDI was originally incorporated into the FFDI (Luke and McArthur 1978), however, in some Australian states, including Tasmania, the SDI is used instead of the KBDI. Sullivan (2001) lists a number of improvements in the SDI compared to the KBDI. These include different interception classes for different canopy densities and types of vegetation and understorey, an allowance for the drying of the canopy following rain on wet days and changes to the subsequent interception, the inclusion of flash run-off as a result of storms and showers, the incorporation of seasonal differences in evapo-transpiration rates, and the lack of assumptions about evapo-transpiration and annual rainfall.
1.5.1.2 Drought Factor
10 2003). When the DF is calculated from the SDI higher values are produced than when the KBDI is used. This is due to a much larger evapo-transpiration term for the SDI in the water balance equation (Finkele et al. 2006).
In addition to the long term wetting component represented by the SDI, the DF incorporates a component based on the number of days since rain during the previous 20 day period (event age) and the amount of the last fall. The rainfall amount is defined within a set of consecutive days, each with rainfall above two millimetres (McArthur 1973; Finkele et al. 2006). However McArthur (1973) is not explicit about how event age should be calculated. Forestry Tasmania has determined that the event age be defined as the number of days since the day with the largest daily rainfall amount within the rain event, and this approach has been adopted by most States using the SDI to calculate DF (Finkele et al. 2006). However, another interpretation of event age is to simply sum the number of consecutive days since the last rain fell (Finkele et al. 2006).
1.5.2 Canadian Forest Fire Weather Index
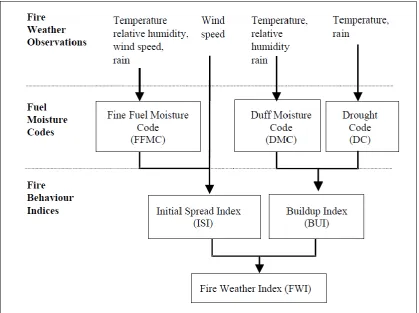
The Canadian Forest Fire Weather Index (FWI) is based on the effects of weather parameters on forest floor fuel moisture conditions and generalised fire behaviour (Figure 1.2). It was
11 Figure 1.2 Structure of the Canadian Forest Fire Weather Index System (Van Wagner 1987).
Comparisons of the FFDI and FWI have been made by Dowdy et al. (2009) and Matthews (2009). Dowdy et al. (2009) found that the FFDI and FWI were similar to each other in that they are most sensitive to wind speed, followed by relative humidity, then temperature and least sensitive to drought. The same study found that the two indices tended to be complementary, with the FWI being more sensitive to wind speed and rainfall and the FFDI being more sensitive to relative humidity and temperature, suggesting that it may be useful for fire managers to
examine both indices.
1.6 Thesis aims
The major aim of this research is to understand the climatic parameters that allow fire to ignite and sustain in rainforest.
12 In particular, it will provide an understanding of the conditions under which rainforest does not burn that will aid in the use of cool-temperate rainforest as a boundary for planned hazard-reduction burns, and will be used to help provide priorities for protection of natural assets during wildfires.
1.7 Structure of thesis
Chapter 2 provides a description of each of the study sites and the data.
Chapter 3 uses laboratory experiments to examine the flammability of common rainforest species and compares these to species from the adjacent sclerophyllous forest communities. Field experiments are used to validate these results.
Chapter 4 examines the spatial effects of rainforest canopy characteristics on the interception and distribution of precipitation within a rainforest.
Chapter 5 examines how the rainforest microclimate differs from that of adjacent open areas.
In the context of the previous chapters, Chapter 6 provides an analysis of the effectiveness of the SDI as a soil moisture prediction tool.
Chapter 7 describes the weather conditions associated with fires in or adjacent to rainforest and uses these data to determine conditions that have resulted in wildfire sustainability within rainforest.
Chapter 2 – Study sites
2.1 Site selection and establishment
Four sites were selected in southern and western Tasmania (Figure 2.1). The criteria for selection were: 1) to represent subalpine, callidendrous and implicate rainforest; 2) to represent both mineral and organic soils; 3) to have a nearby open space to establish a control weather station and; 4) to not be visible to the public but with quick access to the site.
Figure 2.1 Location of study sites (crosses) within Tasmania and nearby localities (squares). + is at GDA94 55G E600000; N5196000.
Table 2.1 Site variables. Site Vegetation
community Location Co-ordinates (GDA 94) Climatic variable Altitude (m a.s.l.) Geology Established Call Callidendrous
rainforest Creepy Crawly nature trail 449598 5257618 Temperature, relative humidity (RH), soil moisture, soil temperature, solar radiation, wind speed/direction, rainfall*
580 Mafic
volcanoclasts 29/6/2010 17/1/2012 14/12/2012
Imp Implicate
rainforest Near Creepy Crawly nature trail
449935
5281751 Temperature, RH, soil moisture, soil temperature, solar radiation
565 Mafic
volcanoclasts 29/6/2010
DB Deciduous beech montane
rainforest
Lake Fenton 469261
5275392 Temperature, RH, soil moisture, soil temperature, solar radiation, wind speed
1,030 Jurassic
dolerite 29/6/2010
Org Implicate rainforest on organic soil
Mount
Murchison 384353 5366789 Temperature, RH, soil moisture, soil temperature, wind speed/direction
580 Pleistocene glacial deposits
23/11/2010
Control 1 Buttongrass
moorland Mueller Road 452251 5259727 Temperature, RH, soil moisture, soil temperature, solar radiation, wind speed/direction, rainfall
490 Dolomite, diamictite and mudstone
29/6/2010 17/1/2012 14/12/2012
Control 2 Low montane heath and disturbed open ground
Lake Fenton 469284
5275058 Temperature, RH, soil moisture, soil temperature, solar radiation, wind speed/direction, rainfall
1,020 Jurassic
dolerite 29/6/2010
Control 3 Buttongrass
moorland Mount Murchison 384134 5366777 Temperature, RH 580 Pleistocene glacial deposits
29/1/2011
15
2.1.1 Site Call
Site Call consisted of callidendrous rainforest dominated by Nothofagus cunninghamii and
Atherosperma moschatum. The site was at 580 m a.s.l. on Cambrian mafic volcanoclastic sandstone-siltstone-limestone of the Cleveland-Waratah Association (Mineral Resources Tasmania 1983). The canopy was about 25 m high. There was very little cover of vascular plants in the
understorey; however, bryophytes and lichens were common.
An automatic weather station was established at the site on 29 June 2010 and ran until 7 April 2011. Climatic variables were logged on a Campbell Scientific CR10X data logger. Climatic variables recorded at the site included air temperature and relative humidity using a Vaisala HMP50 sensor; soil moisture using a CS616 water content reflectometer; soil temperature using a Campbell Scientific 107 temperature sensor; solar radiation using a LI-COR LI200X
pyranometer; and wind speed and direction using a Met One 034B anemometer. Wind variables were measured at two metres above the ground.
The automatic weather station was re-established on 17January 2012 and ran until 28 May 2012, then again on 14 December 2012 and ran until 8 February 2013. The climatic variables collected were as above except that they were logged on a Campbell Scientific CR1000 data logger and rainfall was collected from a Hydrological Services TB4MM tipping bucket rain gauge that can measure rainfall in 0.2 mm increments.
2.1.2 Site Imp
Site Imp consisted of implicate rainforest, with a dense and tangled understorey. The site was dominated by N. cunninghamii and Anodopetalum biglandulosum. The site was at 565 m a.s.l. on Cambrain mafic volcanoclastic sandstone-siltstone-limestone of the Cleveland-Waratah
Association (Mineral Resources Tasmania 1983). The broken and uneven canopy was about 15 m tall.
16 were established within a two metre radius of the weather station. Climatic variables recorded by the weather station were soil moisture, using a CS616 water content reflectometer; soil
temperature, using a Campbell Scientific 107 sensor; and solar radiation, using a LI-COR LI200X pyranometer.
2.1.3 Site DB
Site DB was a deciduous beech (Nothofagus gunnii) montane rainforest. The site was at 1,030 m a.s.l. on Jurassic dolerite (Mineral Resources Tasmania 2008). The canopy was about 5 m high. There was a sparse understorey which largely consisted of Bauera rubioides and Richea pandanifolia. Due to the thick, tangled form of N. gunnii, there was a consistent density of vegetation from ground level to the canopy.
An automatic weather station was established at the site on 29 June 2010 and ran until 7 April 2011. Climatic variables were logged on a Campbell Scientific CR10X data logger with
temperature and relative humidity logged by four Thermocron ibutton sensors, also housed in homemadeStevenson screens. These sensors were established within a two metre radius of the weather station. The climatic variables that were recorded by the weather station were soil moisture, using a CS616 water content reflectometer; soil temperature, using a Campbell Scientific 107 sensor; solar radiation using a LI-COR LI200X pyranometer; and wind speed using a Met One 034B anemometer. Wind speed was measured at two metres above the ground.
2.1.4 Site Org
Site Org consisted of implicate rainforest on organic soils. The dominant tree species were N. cunninghamii and Eucryphia lucida. The site was at 580 m a.s.l. on Pleistocene glacial and glaciogenic deposits (Mineral Resources Tasmania 2004). The canopy was approximately 20 m high and was broken and uneven. The understorey vegetation was very dense. It was dominated by A.
biglandulosum, Trochocarpa cunninghamii and Anopterus glandulosus.
17 sensor; soil moisture, using a CS616 water content reflectometer; soil temperature, using a
Campbell Scientific 107 sensor; solar radiation, using a LI-COR LI200X pyranometer; and wind speed and direction using a Met One 034B anemometer at two metres above the ground.
2.1.5 Control 1
Control 1 was established along Mueller Road, approximately 3,000 m from Sites Call and Imp. The site was established in buttongrass moorland, with low shrubs occurring approximately 30 m to the south and taller trees occurring approximately 50 m to the north. There was no noticeable tall vegetation to the east or west of the site. The site was on Precambrian dolomite, diamictite and mudstone (Mineral Resources Tasmania 1983). The altitude of the site was 490 m a.s.l.
An automatic weather station was established on 29 June 2010 and ran until 7 April 2011. Climatic variables were logged on a Campbell Scientific CR1000 data logger. Climatic variables recorded at the site were air temperature and relative humidity, using a Vaisala HMP50 sensor; soil moisture, using a CS616 water content reflectometer; soil temperature, using a Campbell Scientific 107 sensor; solar radiation, using a LI-COR LI200X pyranometer; wind speed and direction using a Met One 034B anemometer; and rainfall, from a Hydrological Services TB4MM tipping bucket rain gauge that measures rainfall in 0.2 mm increments. Wind variables were measured at two metres above the ground.
The automatic weather station was re-established on 17 January 2012 and ran until 28 May 2012 and then again on 14 December 2012 and ran until 8 February 2013. The climatic variables collected were as above.
2.1.6 Control 2
Control 2 was established at Lake Fenton in an enclosure housing a defunct weather station that was previously operated by Hobart Water. Trees and shrubs were present within 10 m of the enclosure. The site was at 1,020 m a.s.l. on Jurassic dolerite (Mineral Resources Tasmania 2008).
18 air temperature and relative humidity were recorded with a Vaisala HMP45C sensor rather than an HMP50 sensor.
2.1.7 Control 3
Control 3 was established on a slope dominated by buttongrass moorland that occurred adjacent to Site Org. The geology and elevation were identical to those at Site Org.
Control 3 was established on 29 January 2011 and ran until 4 May 2011. The only measurements that were taken at Control 3 were temperature and relative humidity, which were recorded with four Thermocron ibutton sensors, housed in identical Stevenson screens as described above.
2.2 Measurements of fuel moisture
At all sites fuel moisture measurements were made between 2 February 2011 and 7 April 2011. Fuel moisture was measured with fuel moisture sticks (Forestry Tasmania 2005). Three fuel moisture sticks were established at each experimental site and one fuel moisture stick was established at each control site. Sticks were placed within a two metre radius around each weather station on wire supports so that they did not make direct contact with the ground. Fuel moisture sticks were weighed for percentage moisture on every site visit during their
establishment. This was roughly every three weeks for sites Call, Imp and DB and Controls 1 and 2 and every two months for Site Org and Control 3.
The summer of 2010/2011 was both wetter and cooler than average (Bureau of Meteorology 2012a). As a result the rainforests remained damp and the fuel moisture sticks within the rainforest always recorded a greater weight than the scales were able to record.
2.3 Automatic weather station measurements
19 Table 2.2 Automatic weather station variables measured and instruments used for each site. C1 =
Control 1; C2 = Control 2; C3 = Control 3.
Climatic variable Sensor Data type Record
(mins) Sites Air temperature (°C) Vaisala HMP50 Average,
Maximum 60 Call, Org & C1 Relative humidity (%) Vaisala HMP50 Maximum 60 Call, Org & C1
Air temperature (°C) Vaisala HMP45C Average,
Maximum 60 C2
Relative humidity (%) Vaisala HMP45C Maximum 60 C2
Air temperature (°C) Thermocron ibutton Sample 60 Imp, DB, Org & C3
Relative humidity (%) Thermocron ibutton Sample 60 Imp, DB, Org & C3
Volumetric soil moisture (measured at 30 cm) (%)
CS616 Average 60 Call, Imp, DB,
Org, C1, C2 & C3
Soil temperature (measured at 10 cm) (°C)
Campbell Scientific 107 Average 60 Call, Imp, DB, Org, C1, C2 & C3
Solar radiation (kw/m2) LI-COR LI200X Average,
Maximum 60 Call, Imp, DB, C1, C2 & C3 Solar radiation
(MJ/m2)
LI-COR LI200X Total 60 Call, Imp, DB, C1, C2 & C3 Rainfall (mm) Hydrological Services
TB4MM Total 60 C1, C2 & C3
Wind speed (m/s) METONE 034B Average 15 Call, DB, Org, C1, C2 & C3 Wind direction (°) METONE 034B Sample 15 Call, Org, C1, C2
& C3
Each station was downloaded before the data logger memory was filled, which was every 24 days for Controls 1 and 2 and every 60 days for the remaining stations. At each download the battery was replaced with a freshly charged battery. The ibuttons were downloaded and reset roughly every 85 days.
Chapter 3 – Flammability of rainforest components
3.1 Introduction
Rainforest is widely considered to be less flammable than other vegetation types (Jackson 1968; Mount 1979; Bond and van Wilgen 1996; Bowman 2000). Comparisons of the flammability of rainforest components with that of components of adjacent ecosystems have shown lower flammability in some rainforest trees in some locations (e.g. Dickinson and Kirkpatrick 1985) but no difference elsewhere (e.g. Bowman and Wilson 1988).
The flammability of species and litter is critical in predicting the conditions under which rainforest of different types will burn. Flammability consists of four components; ignitability, sustainability, combustability and consumability (Anderson 1970; Martin et al. 1994). These components are not independent of one another (Martin et al. 1994). For example, sustainability, combustibility and consumability are irrelevant in the absence of ignition (White and Zipperer 2010).
Ignitability refers to the delay until ignition occurs, and is the time to first flaming from the time of first exposure to an ignition source (Gill and Moore 1996). Sustainability relates to the ability of fuel to continue burning once ignited, independent of the initial heat source (White and Zipperer 2010). Combustibility describes how rapidly the fuel burns after ignition and is related to the rate of spread and heat of combustion (Behm et al. 2004). Consumability refers to the proportion of mass or volume that is consumed in the combustion process (White and Zipperer 2010). High consumability has been associated with fine fuel biomass and volatile solids (Behm et al. 2004).
21 moisture content increasing the ignition delay time, and increasing surface area to volume ratio decreasing it (Gill and Moore 1996).
Leaves are commonly the only plant component that is examined in laboratory flammability studies (e.g. Gill and Moore 1996; Dimitrakopoulos and Papaioannou 2001). This is because they provide uniformity and because they are often considered the most flammable part of the plant due to high surface area to volume ratios and the presence of volatile compounds
(Dimitrakopoulos and Papaioannou 2001). Moisture content of the litter component is also a very important factor in the flammability of ecosystems. Fernandes et al. (2008) found that above 35% moisture content, the in situ litter of maritime pine forests was unable to sustain fire. Gillon
et al. (1995) found similar results for a French pine forest, with fuel moisture levels above 30% unable to sustain ignition in a windless environment within a laboratory. In Australia, a moisture content of below 20% – 25% has been found necessary for fine eucalypt fuel to burn sustainably (Luke and McArthur 1978).
Some other contributors to flammability are heat content (Pellizzaro et al. 2007), chemical composition (Etlinger and Beall 2004), ash content (Dickinson and Kirkpatrick 1985), the
arrangement of fuels in three dimensions (Fernandes et al. 2008), fuel bed porosity and fuel depth (Dibble et al. 2007). The flammability of plants is not only a function of their intrinsic properties but also of their environment, horticultural or management practices and life stage and all these factors vary among individuals of the same species (Gill and Moore 1996). Consistent results have not been found for these contributors to flammability. For example, Gill and Moore (1996) found that mineral content decreased flammability, whereas Etlinger and Beall (2004) found no such relationship. These discrepancies may be due to the large number of methods that have been used in testing the components of flammability as well as a lack of independence between the factors (Behm et al. 2004).
22 are not necessarily transferable to fire sustainability in the field (Fernandes et al. 2008). Fire sustainability studies have been conducted in numerous vegetation types, including grassland (Leonard 2009), buttongrass moorland (Marsden-Smedley et al. 2001), shrublands (Weise et al.
2005) conifer forest surface fuels (Beverly and Wotton 2007; Fernandes et al. 2008) as well as tropical rainforest surface fuels (Uhl et al. 1988), however the capacity for fire to be sustained within cool-temperate rainforest has not been examined.
This chapter aims to determine if leaf and litter material from species that dominate cool-temperate rainforest and mixed forest are less flammable than leaf and litter material from species that occur in surrounding fire dependent ecosystems, such as Banksia marginata scrubland and Eucalyptus coccifera woodland, as well as determining if it is possible to predict flammability from other fuel properties, such as surface area to volume ratio. The chapter also looks at the fuel moisture conditions in a small-scale field based ignition experiment to see how rainforest litter responds to ignition in situ.
3.2 Methods
3.2.1 Study sites, site establishment and sampling procedure
The sites sampled for the laboratory component of this study are described in Chapter 2. Fresh leaf samples were mostly collected from Site Call, with additional collection taking place at Site Imp and Site DB when species of interest were absent from Site Call (Table 3.1). Species of interest for flammability studies were identified by dominance within each of the three rainforest communities and adjacent communities.
Table 3.1 Species examined for the flammability experiments and their collection location.
Species Site
Atherosperma moschatum Call
Eucryphia lucida Call
Nothofagus cunninghamii Call
Orites diversifolius Call
Anodopetalum biglandulosum Imp
Nothofagus gunnii DB
Bauera rubioides DB
Eucalyptus nitida Scotts Peak Road
23 Fresh leaf material of each species was collected from at least four different individual plants within each community. The samples were immediately sealed in snap lock bags then placed in plastic buckets with sealing lids to minimise moisture loss during transport.
Surface litter samples were taken from three different sites. These were the callidendrous rainforest at Site Call (referred to as callidendrous forest), the Nothofagus gunnii dominated Site DB (referred to as deciduous beech scrub), and the Eucalyptus coccifera dominated woodland surrounding Site DB (referred to as Eucalyptus coccifera woodland). Litter samples were collected from at least 6 different locations within each vegetation type and immediately placed in plastic bags for transport back to the laboratory.
The site used for the field component of this study occurred in thamnic rainforest and was located about one hour south of Hobart, along Arve Road, west of Geeveston. The site was selected as it met the following criteria: 1) was accessible to a road for fire suppression purposes; 2) was not steeply sloped; 3) has no eucalypt litter; and 4) was within a one hour drive of Hobart.
Test fire plots were identified in the field in November 2012 and marked. Some modification of the vegetation was required in order to establish tarpaulins over the plots with the purpose of manipulating the fuel dryness. This occurred on one day in November 2012 and involved pruning of saplings and other scrub but did not affect the litter layer. Most plots in which test fires were to be carried out were covered by a 4.9 by 6.1 metre tarpaulin, which was pitched roughly one metre above the ground. Tarpaulins were established throughout November and December 2012 and January and February 2013. This resulted in 9 plots with different durations since it last rained.
In order to estimate the fuel load of each plot without destroying it, a double sampling approach was used (Catchpole and Wheeler 1992; Catchpole and Catchpole 1993). Cover and height of leaf litter, branch litter less than 6 mm in diameter, branch litter greater than 6 mm in diameter and bare ground/roots were recorded for 10 one by one metre quadrats. The fuel within these quadrats was then collected and taken to the laboratory where it was dried at 105 °C for 48 hours. The following equation was then used to determine percent moisture content (van Wilgen
24 Percent moisture content = (mwet – mdry)/mdry * 100
Equation 3.1
where mwet is the mass of the litter batch before drying, and mdry is the mass of the litter batch after drying. Each sample was then sorted into leaf litter, branch litter less than 6 mm in diameter and branch litter greater than 6 mm in diameter, with each component weighed separately.
3.2.2 Laboratory flammability experiments
Flammability experiments were undertaken on the fresh leaf material collected from the live plants, and surface litter, which consisted of woody branch and bark material. All leaf material was excluded from the litter samples as leaves of varying dryness were examined separately.
3.2.2.1 Laboratory procedures
The samples of fresh leaf material were processed as soon as possible on return to the laboratory, which was generally about two hours after collection. For each species, 10 leaf samples were randomly selected from the original pool of material. From the same pool of material a pair was then selected for each of the original 10 samples which was of near identical size and shape. The duplicate leaves were weighed as a batch and placed in the drying oven at 105 °C for 48 hours, while the original leaves were used in the flammability experiments. This was done in order to determine an estimate of foliar moisture content from samples that were to be destroyed in the flammability experiments. The dried batch was then re-weighed to determine an estimate of percent foliar moisture content using equation 3.1.
25 thickness two-thirds of the way to the midrib, near the midpoint of the lamina (Gill and Moore 1996). For N. gunnii and N. cunninghamii the leaf thickness was measured as the thickness of the leading leaf two-thirds of the way to the midrib. For B. rubioides, thickness was recorded as the thickness of the stem, half way along the length of the branchlet. Area of each leaf was
determined by scanning the samples, calculating the number of pixels and converting this number to millimetres squared. For N. gunnii and N. cunninghamii branchlets, the area was calculated individually for each sample. For all other leaf material the average area was calculated from between 18 and 77 randomly selected samples, depending on the size of the leaves, with a greater number of samples taken from smaller leaves. Area was not calculated for B. rubioides. The volume of each leaf was determined for Anodopetalum biglandulosum, Atherosperma moschatum,
Banksia marginata, Eucryphia lucida, Eucalyptus nitida and Orites diversifolius using the following equation:
Volume = (SA * 2) * t
Equation 3.2
where SA is the mean surface area for each species and t is the thickness of the leaf sample, measured two-thirds of the way to the midrib.
Branch litter was divided into the following diameter size classes: 0-3 mm, 3.1-6 mm, and 6.1-25 mm, modified from Brown et al. (1982). Fresh weight, diameter and length were recorded as for the leaf samples. Volume was determined for each branch by assuming a cylindrical shape and applying the formula for a cylinder, with diameter measured from the mid-length of each sample. In addition, bark litter was prominent in the litter at the Eucalyptus coccifera woodland and this was used as an additional sample, with weight and length of individual pieces being recorded.
3.2.2.2 Flammability
26 Time to ignition was defined as the amount of time required until flames appeared on the leaves. Flaming was not necessarily sustained. Where ignition was not sustained, the time to full
combustion whilst being subjected to the flame was recorded (“time to consumption”). The nature of burning (sparking, spitting, smoking, smouldering) was noted.
3.2.2.3 Moisture content
The effect of moisture content on the flammability of the fresh leaf samples was tested by repeating the above procedures on samples of varying moisture content. Samples were dried slowly by being placed in a plant press with samples then subjected to the flammability tests described above every 18, 24, 42, 48, 72 and 120 hours. At each sampling time, paired samples were taken to determine the percent foliar moisture content using the oven drying method described above and equation 3.1.
The woody litter samples were air dried on a drying rack in the laboratory, where the daily air temperature was an average of 23.5 °C and the mean relative humidity was 44%. Ten samples of each diameter size class were tested periodically for time to sustained ignition, which was
recorded with a stopwatch. The bark sample was only tested once as 100% of the samples ignited. After each test the weight, length and diameter were measured for each sample as well as the combined weight of all samples in each size class. This was used to determine the moisture content for each size class sample after oven drying for 48 hours at 105 °C and using Equation 3.1. Once woody litter samples had been oven-dried to determine moisture content, 10 samples of each size class were tested for rate of spread, using the same methods as for leaves. This provided the rate of spread at zero percent moisture content.
27
3.2.3 Field flammability experiments
3.2.3.1 Test fire procedure
Before any fires were ignited, fuel data were collected from the plot with litter height and cover recorded. Fuel continuity was assessed by assigning a score between one and three, with one being low fuel continuity and three being fuel of continuous cover and height. Fuel moisture was measured by collecting litter samples within each one by one metre burn plot, prior to ignition. These samples were sealed in tins and transported back to the laboratory as soon as the day’s work had concluded. The fuel samples were then weighed before being dried at 105 °C for 48 hours. Fuel moisture was then determined using equation 3.1. Soil moisture was assessed in an identical way from on average three samples under each tarpaulin, collected just below the litter layer. The soil moisture content of each of the three samples was averaged to give one value for all the plots under each tarpaulin.
Test fires were conducted in a one by one metre plot within the area covered by the tarpaulin. A total of 19 sustainability test fires were conducted across all plots on 26 March 2013 and carried out by the Parks and Wildlife Service and Forestry Tasmania in conditions which were unsuitable for the non-manipulated forest to carry fire. This ensured that no undesired fires occurred during the experiment. A drip torch containing a 2:1 diesel/petrol mixture was used to create a one metre ignition line along one edge of the test fire plot. Ignition lines were located along the down slope edge of the plot to provide the fire with the best chance of sustaining. A fire was judged to have sustained if it remained alight for at least 5 minutes or travelled one metre to the opposite end of the plot.
3.2.3.2 Weather data collection
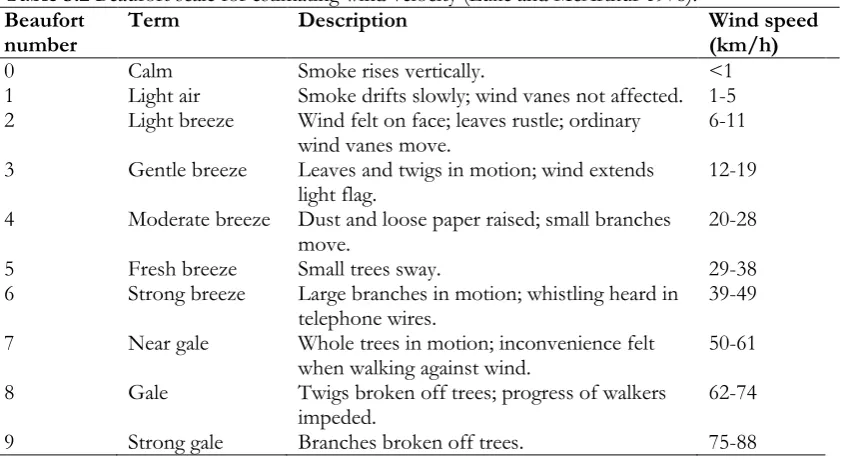
28 Table 3.2 Beaufort scale for estimating wind velocity (Luke and McArthur 1978).
Beaufort
number Term Description Wind speed (km/h)
0 Calm Smoke rises vertically. <1
1 Light air Smoke drifts slowly; wind vanes not affected. 1-5 2 Light breeze Wind felt on face; leaves rustle; ordinary
wind vanes move. 6-11
3 Gentle breeze Leaves and twigs in motion; wind extends
light flag. 12-19
4 Moderate breeze Dust and loose paper raised; small branches
move. 20-28
5 Fresh breeze Small trees sway. 29-38
6 Strong breeze Large branches in motion; whistling heard in
telephone wires. 39-49
7 Near gale Whole trees in motion; inconvenience felt
when walking against wind. 50-61 8 Gale Twigs broken off trees; progress of walkers
impeded. 62-74
9 Strong gale Branches broken off trees. 75-88
3.2.4 Data analysis
3.2.4.1 Laboratory flammability experiments
It was not possible to perform all analyses on all the leaf species as there were differences in the sampling procedures between the species when branchlets were used as the sample unit rather than individual leaves. To distinguish between these sub-groups the species in which whole leaves were sampled individually are referred to as foliar samples.