Master of Philosophy Thesis
Validation of a Sailing Simulator using Full Scale
Experimental Data
Nicholas Adam Clark
November 2014
Supervisors: Dr Jonathan Binns
Professor Neil Bose
Thesis submitted in partial fulfilment of the requirements for the
Degree of Master of Philosophy (Naval Architecture)
ii
DECLARATION
I hereby declare that the whole of this submission is my own work and the result of my own investigation and that, to the best of my knowledge and belief, it contains no material previously published or written by another person, except where due reference is made in the text of the project.
I further declare that the work embodied in this project has not been accepted for the award of any other degree or diploma in any institution, college or university, and is not being concurrently submitted for any other degree or diploma award.
This thesis may be made available for loan and limited copying and communication in accordance with the Copyright Act 1968.
………..
Nicholas Clark
iii
ACKNOWLEDGEMENTS
I acknowledge the patience of all parties with interest in this project. I thank the professional
support given by my supervisor Dr Jonathan Binns and Co-Supervisor Professor Neil Bose.
Personally, thank you to my family for the patience and encouragement you've given me.
This is dedicated to the memory of Thelma 'Grace' Rainbow. I promised I wouldn't give up
iv
TABLE OF CONTENTS
Declaration ... ii
Acknowledgements ... iii
Table of Contents ... iv
List of Tables ... vi
List of Figures ... vii
Nomenclature ... xii
Axis System ... xiii
Abbreviations ... xiv
Terminology ... xv
Abstract ... 1
1. Introduction ... 2
1.1. Background 2 1.2. Problem Definition 3 1.3. Scope of Work 6 1.4. Literature Review 8 1.5. Laser Class Sailing Dinghy 10 2. Full Scale Testing and Data Acquisition ... 12
v
3.1. Introduction 32
3.2. Experimental Setup 32
3.3. Testing Procedure 33
3.4. Data Processing and Analysis 33
3.5. Results and Discussion 34
3.6. Conclusions and Recommendations 38
4. Simulation Validation: Comparison of Full Scale and Simulation Data ... 39
4.1. Introduction 39 4.2. Procedure 39 4.3. Full Course Analysis and Results 39 4.4. Tacking Manoeuvre Analysis and Results 42 4.5. Conclusions and Recommendations 45 5. Conclusion ... 46
5.1. Summary 46 5.2. Conclusions 46 5.3. Recommendations for Future Work 47 6. Reference ... 49
Appendix A – Experimental Procedures ... 51
Shutdown Procedure ... 57
Data Analysis Procedure ... 58
Appendix B – Equipment Error ... 61
vi
LIST OF TABLES
Table 1-1:Standard Laser class dinghy principal particulars ... 10
Table 2-1 - Synchronised GPS data with DAS data using Video timestamp references ... 19
Table 2-2 - Albert Park Course Lap Results ... 25
Table 2-3 - Course Marker Locations ... 25
Table 2-4 - Maximum rudder angles from a series of laps and consecutive upwind tacks. .... 28
Table 3-1 - Sailing Simulator "Virtual Albert Park" Lap Results ... 34
Table 3-2 - Maximum rudder angles from a series of laps and consecutive upwind tacks. .... 36
Table 4-1 - Upwind and Downwind (Windward and Leeward) difference between maximum and average dinghy velocities between Experimental and Simulated, for laps conducted during testing. This data includes time whilst moving only, time when stationary is not a part of the data set. ... 41
Table 4-2 - Average dinghy velocities per lap, averaged over all laps recorded during testing. ... 41
Table 0-1 - File 1,1 data ... 59
Table 0-2 - File 2,1 data ... 59
Table 0-3 - File 3,1 data ... 59
vii
LIST OF FIGURES
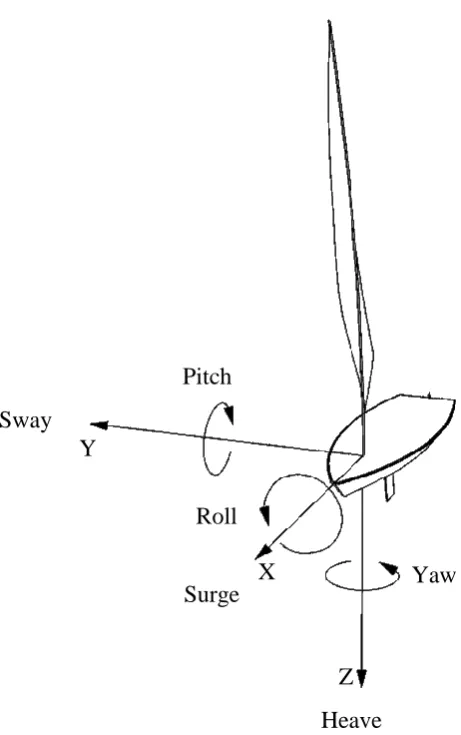
Figure 1-1: This figure illustrates the body fixed axis system used. ... xiii
Figure 1-1:AVSail Trainer suite, including dynamic rolling hull and on screen virtual course
position. Source: www.virtualsailing.com.au. ... 3
Figure 1-2 - Albert Park Lake, Melbourne is located alongside Port Philip Bay. The close
proximity to the bay provides relatively steady wind speed and direction for testing. More
ideal test sites such as a dessert lake or even Lake Wendouree in Ballarat may provide more
stable wind conditions, however at the time of testing the Lake was dry and further travel
abroad was not within the scope of the project budget. ... 4
Figure 1-3 - This close up satellite image of Albert Park Lake is of the test area located at the
northern end of the lake. Wind direction is predominantly seen to come from the South West.
The very North pocket of the lake. ... 4
Figure 1-4: Simplified Work Scope Flow Chart. ... 6
Figure 1-5: Upper mast section sizing common to all Laser classes, used for all full scale
tests. All dimensions are in millimetres, drawing is not to scale. Source: Laser Class Rules
(February, 2008). ... 10
Figure 1-6: Boom section sizing common to all Laser classes, used for all full scale tests. All
dimensions are in millimetres, drawing is not to scale. Source: Laser Class Rules (February,
2008). ... 10
Figure 1-7 Governing sail dimensions for the full size Olympic class sail. This sail size has
been used for all full scale testing. All dimensions are in millimetres, drawing is not to scale.
Source: Laser Class Rules (February, 2008)... 11
Figure 1-8: Lower mast section sizing of the full size Olympic class mast used for all full
scale tests. Mast is split into two sections for ease of transport. All dimensions are in
millimetres, drawing is not to scale. Source: Laser Class Rules (February, 2008). ... 11
Figure 2-1: Dark (Micro-computer) and Light grey (Transmitter) boxes attached to the deck.
The Port/Aft facing camera is attached, with a plate ready for starboard camera mounting.
The mast encoder can be seen to the central left, whilst the base of the anemometer is to the
extreme right at the bow. All this equipment was structurally robust and watertight, ideal for
viii
Figure 2-2: Rudder belt attachment. Figure 2-3: Encoder belt attachment. ... 14
Figure 2-4: Rudder angle markings drawn on the aft deck. Deck markings were used before
each test to obtain rudder angle calibration data. The rudder was rotated through incremental
steps of 10 ° and 20° from side to side to a maximum of 60°, starting at the centre. ... 15
Figure 2-5: Mast Encoder Attached with three loops of fine elastic cord around both mast and
encoder. ... 15
Figure 2-6: DAQ Laptop, and GPS unit (bottom right of bag) in waterproof bag. The bag was
shackled to the deck. ... 16
Figure 2-7: Velocitek SC1 GPS unit in waterproof buoyant casing. ... 16
Figure 2-8: Raw time-series rudder encoder data obtained from a rudder angle calibration
check. The x-axis is discrete data recorded at 20Hz (20 data points represents 1 second), and
the y-axis is 12bit unsigned data (upper values are when rudder is to starboard). One example
of incremental rudder angle steps recorded during calibration are highlighted in red. The
central transverse mean line indicates zero rudder angle... 19
Figure 2-9: Anemometer measurement orientation ... 20
Figure 2-10: Comparison of recorded track overlay (Left) and a track being analysed in the
post processing tool GPS Action Replay Pro.(right). ... 21
Figure 2-11 - Visual representation of the influence Dinghy velocity has on True Wind Speed
and Angle to result in Apparent Wind Speed and Angle at the dinghy and onboard
anemometer. ... 22
Figure 2-12 - Error in true wind velocity with respect to apparent wind angle, for an upwind
continuous leg. ... 24
Figure 2-13 - Error in true wind angle for average wind speed of 12.5 knots with respect to
boat speed. Data was from the windward data set, from 10° to 35° AWA. ... 24
Figure 2-14 - Polar plot of dinghy velocity (knots) through 360degrees of heading relative to
True Wind Angle (TWA) recorded during experimental testing. A 10 point moving average
smoothed the data, and best fit curve was applied. Note that there are flat spots in the data,
especially between 105 to 130 degrees and 150 to 165 degrees. This may be due to a lack of
downwind reach runs conducted, as sailing down the course was primarily at 180 degrees to
ix
Figure 2-15 - Rudder angle during tack number 5 (see Table 2-4) is shown over time. Note
that in this example there is virtually no overshoot correction at the end of the manoeuvre. Of
the tacks analysed, overshoot correction or course correction was identified twice in tacks 6
and 11 (see Table 2-4)... 29
Figure 2-16 - Rudder angle during tack number 8 (see Table 2-4) is shown over time. ... 29
Figure 2-17 - Rudder angle during tack number 6 (see Table 2-4) is shown over time. Note
the course correction required due to overshoot at 13:52:14 to 13:52:16, after 7 seconds of
rudder input to execute the tack. ... 30
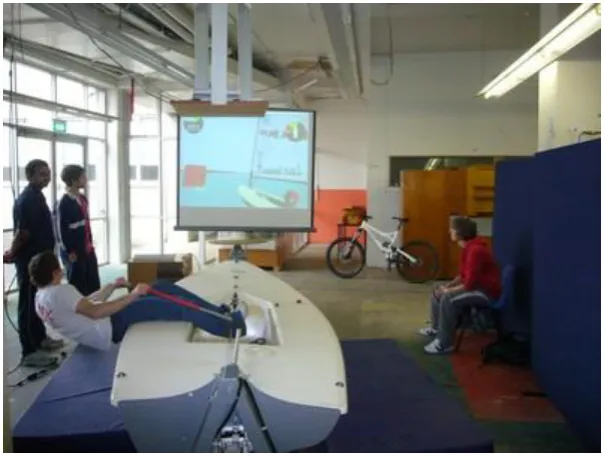
Figure 3-1: Sailing the virtual Albert Park lake course on the sailing simulator. Course
position, wind speed and wind direction data obtained from experimental testing were all
input into the simulation to replicate experimental conditions. ... 33
Figure 3-2 - Sample lap of the set course to windward. ... 34
Figure 3-3 - Dinghy velocity polar plot through 180 degree of heading. The data was
originally through 360 worth of heading, and mirrored about 180 degrees. A ten point moving
average was used to smooth the data and regression analysis applied to provide a curve of
best fit. The peak velocity at around 60 degrees heading of 5 knots was found to occur at
steady maximum heel angle on the simulator. This is thought to be due to reaching maximum
heel limits of the simulator, thus adding to the heeling moment physically available from the
sailor. This outlier data was removed when conducting the average velocity curve fit. ... 35
Figure 3-4 - Rudder angle over time is shown during an upwind Port to Starboard tacking
manoeuvre. Note the overshoot angle at the end of the manoeuvre, which was observed at the
end of all tacks. Correction was to decelerate the yacht in yaw whilst exiting the tack.
Consistently correcting the turning manoeuvre may be a sign of a less experienced sailor, as
an experienced pilot would be expected to not waste as much energy and time and turn
smoothly out of the turn. ... 37
Figure 3-5 - Rudder angle over time is shown during an upwind Starboard to Port tacking
manoeuvre. In this example the overshoot correction occurs (~0:30:6 to 0:30:8) after a second
ruder input (0:30:4 to 0:30:6) is used to fully turn the dinghy to the desired heading. Both
corrections at the end of the turn are examples of opportunities to refine the sailors technique,
x
Figure 4-1 - Dinghy Velocity Polar plot comparing best fit experimental and simulator results
through 180 degrees heading relative to True Wind Angle (TWA), or the direction of the
wind. Experimental velocity is noticeably slower when going to windward (0°-90°) where as velocities are much closer when sailing downwind (90°-180°). Between 0°-30° it was not
considered realistic that the Laser dinghy produces lift and velocity through this heading
range. The resultant velocities were most likely recorded during tacking manoeuvres when
changing heading with speed from a previous tack remaining. ... 41
Figure 4-2: Comparison between simulated (left) and real (right) course track plots. The right
hand plot is inverted, as the wind is coming from the South when the post processing plotter
only faces North. ... 42
Figure 4-3 - Average maximum rudder angles experienced during tacking is shown, with
error bars showing 95% confidence intervals. Due to the consistency of maximum angles
during simulator testing (most likely due to physical rudder limits), the confidence interval is
quite small, whereas in real world conditions the interval is larger as the rudder has a much
larger range of movement. Overlap between the two intervals gives confidence that rudder
angles in the simulator reflect real life. ... 43
Figure 4-4 - Experimental compared with simulated average tack times (excluding overshot
correction at the end of each tack if present), with 95% confidence intervals. Mean values
were 5.90s for the simulator and 6.22s for the simulator. This represents a 5% difference in
tacking durations. ... 43
Figure 4-5: Comparison of full scale „on water‟ rudder angle during a tack manoeuvre,
compared to simulated tacks with active rudder feedback using the same pilot. For this
example, results show close correlation both in terms of maximum angle and durations
between simulated and experimental data. ... 44
Figure 4-6 -Two upwind tacks show GPS resolution is lacking to obtain accurate turning
information. ... 44
Figure 0-1: Dark (Micro-computer) and Light grey (Transmitter) boxes attached to the deck.
Go-Pro cameras are optional. ... 51
Figure 0-2: Rudder belt attachment. Figure 0-3: Encoder belt attachment. ... 51
Figure 0-4: DAQ Laptop, and GPS unit (bottom right of bag) in waterproof bag. Bag is
xi
Figure 0-5: Mast Encoder Attached with three loops of fine elastic cord around both mast and
encoder. ... 53
Figure 0-6: 0 Degrees. Figure 0-7: +90 Degrees. ... 53
Figure 0-8: 0 Degrees. Figure 0-9: -90 Degrees. ... 54
Figure 0-10: 0 Degrees. Figure 0-11: +45 Degrees. ... 54
Figure 0-12: 0 Degrees. Figure 0-13: -45 Degrees. ... 54
Figure 0-14: 0 Degrees. Figure 0-15: +180 Degrees. ... 55
Figure 0-16: 0 Degrees. Figure 0-17: -180 Degrees. ... 55
Figure 0-18: 0 Degrees... 55
Figure 0-19: Picking up the Port Side. Figure 0-20: Picking up the Bow... 56
Figure 0-21: Picking up the Starboard Side. Figure 0-22: Picking up the Stern. ... 56
xii
NOMENCLATURE
Symbol Description Units
AOA Angle of Attack °
AWS Apparent Wind Speed m/s
AWA Apparent Wind Angle m/s
F Output Frequency of wind anemometer Hz
g Acceleration due to Gravity m/s2
hh Hours hr
kn Knot NM/hr
mm Minutes min
P Atmospheric stability index
Density of Air t/m3
ss Seconds s
T Draft m
TWS True Wind Speed m/s
TWA True Wind Angle m/s
U Wind velocity m/s
VDINGHY Forward dinghy velocity m/s
xiii AXIS SYSTEM
Figure 1-1: This figure illustrates the body fixed axis system used. X
Y
Z
Yaw Pitch
Roll
Heave Sway
xiv
ABBREVIATIONS
AOA Angle Of Attack
AWA Apparent Wind Angle
AWS Apparent Wind Speed
DAS Data Acquisition System
GPS Global Positioning System
HITL Human In The Loop
TWA True Wind Angle
xv
TERMINOLOGY
Bow Forward or Front region of dinghy
Stern Aft or rear region of dinghy
Port Left
Starboard Right
Surge Longitudinal motion in the x direction
Heave Vertical motion in the z direction
Sway Transverse motion in the y direction
Roll Rotation about the longitudinal x axis
Yaw Rotation about the vertical z axis
Pitch Rotation about the transverse x axis
Tack The manoeuvre of turning between starboard and port tack
Windward To sail upwind
1
ABSTRACT
Virtual Sailing Pty Ltd is an Australian company that for over 10 years has invested significant
time and resources into developing a ride on sailing simulator, which replicates several classes
including the Laser and megabyte sailing dinghies. The simulator provides a means for training
and performance assessment of sailors; including the feature of providing rehabilitation and
training for disabled body sailors through the V-Sail Access Simulator.
Prior to this project, the sailing simulator had not been validated with experimental testing. It
was proposed that an experimental Data Acquisition System be used in a series of manoeuvring
trials, in order to obtain experimental validation data. Full scale experimental testing was
performed at Albert Park Lake, Melbourne. The aim of testing was to acquire validation data
including dinghy velocity over land; Apparent Wind Speed (AWS) and Apparent Wind Angle
(AWA), Rudder angle and GPS position.
Subsequent testing on the simulator using experimental course data from Albert Park Lake was
used to systematically repeat full scale course laps and manoeuvres in order to obtain simulated
data for comparison with experimental data. Comparison between experimental and simulated
data formed the validation component of the project.
The validation study found that the manoeuvring model employed in the simulator replicated the
results from experimental testing, especially with regard to manoeuvring response of the
simulator compared to experimental results. Average dinghy velocity through specific headings
relative to true wind angle showed variation to the simulator (within an order of magnitude),
which requires further investigation. Specifically, it is recommended that future work
investigates the validation of the main resistance and powering components of the simulation,
including but not limited to; hydrodynamic hull drag, righting moment provided/required by the
sailor, and aerodynamic sail forces.
Finally, the Data Acquisition System and supporting equipment was found to be robust, and
2
1. INTRODUCTION 1.1. BACKGROUND
Over the past 10 years, Virtual Sailing Pty. Ltd. has continuously developed a human in the loop (HITL) simulator, dubbed the „VSail Trainer‟. Initially developed to assess the
physiological performance of sailors (Walls, Gale, Saunders and Bertrand 1998), the
simulator has evolved into a high fidelity training tool capable of training sailors of all
levels from beginner through to Olympic, including disabled sailors (Mooney, Saunders,
Habgood and Binns 2009). The simulator is a ride-on active dinghy sailing simulator
consisting of a modified dinghy cockpit, mounted on a gimble which allows roll about the
longitudinal axis. The sailor sits in the cockpit, with tiller and mainsheet controls at hand to
control a virtual rudder and virtual sail position. The third user control input is positioning
the hull in roll by 'hiking' off the side. This provides virtual righting moment to the dinghy.
The three user control inputs of tiller, mainsheet and cockpit position also feature haptic
(tactile) feedback, in that they provide force feedback to simulate forces that the sailor
would experience in real sailing. Roll feedback is through a pneumatic ram, mainsheet
through a progressive spring and rudder via electric solenoid actuator.
Cockpit roll, mainsheet and tiller inputs combined with other pre-programmed inputs to the
simulated force balance consisting of virtual sail, rudder, centreboard and hull form
coefficients produces forward thrust and velocity. Resultant movement is primarily
visualised on a projector screen ahead of the sailor. A second visual display is available
through 3D goggles which provide an immersed reality experience, allowing the sailor to
look around the course in 360 degrees. On screen data gives feedback to the sailor in the
forms of velocity, heading, wind direction, wind and water sound, position on a virtual
course and various timing features including total race time and lap times.
The trainer is able to simulate a number of classes, including: Laser Standard; Laser Radial;
Laser 4.7; Optimist; Byte; Mega Byte; Liberty, and 29‟er (Binns, Bethwaite and Saunders
2002; Binns, Maher, Chin and Bose 2009). Applications of the VSail Trainer (Mooney,
Saunders, Habgood and Binns 2009)are wide and varied, including:
Training of beginners through to Olympic level sailors (Figure 1-1);
The assessment of tactical and physical performance of elite level sailors, in a
3
Rehabilitation of spinal injury patients, utilising the rolling motion of the simulator.
In line with continual development of the VSail Trainer, Virtual Sailing aims to validate the
[image:18.595.147.450.125.353.2]current simulation to quantify the fidelity of the simulation in relation to real life.
Figure 1-1:AVSail Trainer suite, including dynamic rolling hull and on screen virtual course position. Source: www.virtualsailing.com.au.
1.2. PROBLEM DEFINITION
The project concentrated on the need to validate the Virtual Sailing Pty Ltd sailing
simulator, with real world data. In order to validate the sailing simulation, a broad analysis
approach comparing course lap times was undertaken. Subsequently the investigation
shifted to more specific areas such as velocity polar plot comparisons and tacking analyses.
With key analysis areas known, validation data was required. The Data Acquisition System
(DAS) made available by project collaborators at the University of Melbourne (Bennett,
Manzie, Oetomo, Binns and Saunders 2010) allowed data acquisition to take place on an
instrumented Laser class sailing dinghy.
The instrumented Laser dinghy was based in Melbourne which meant there was a choice
between two local test sites: Port Phillip Bay or Albert Park Lake. Albert Park was chosen
over the bay due the controlled environment offered. Tide and current drift effects on GPS
position and velocity measurements were eliminated, and wave interference on
4
Figure 1-2 - Albert Park Lake, Melbourne is located alongside Port Philip Bay. The close proximity to the bay provides relatively steady wind speed and direction for testing. More ideal test sites such as a dessert lake or even Lake Wendouree in Ballarat may provide more stable wind conditions, however at the time of testing the Lake was dry and further travel abroad was not within the scope of the project budget.
Figure 1-3 - This close up satellite image of Albert Park Lake is of the test area located at the northern end of the lake. Wind direction is predominantly seen to come from the South West. The very North pocket of the lake.
The downside of testing on the lake was the influence of surrounding buildings and trees on
wind direction and velocity. As winds experienced during testing were consistently South
5
infrastructure and trees along the North Western side of the lake (East of the Lakeside
Stadium) shown in Figure 1-3. To remedy the interference problem, the set course was to
be to the south of the West of the Island where minimum interference was experienced..
To capture onboard rudder angle and wind velocity information during testing, a wireless
Data Acquisition System (DAS) was constructed using remote monitoring stations
communicating over a wireless network local to the dinghy. The system created by Bennett,
Manzie, Oetomo, Binns and Saunders (2010) had several robust features which were an
ideal match for the harsh marine environment.
The wireless communications of the system mean that no cable looming was required to set
the system up on board (the system was transportable and generic to any sailing platform).
Data was transferred over a wireless network from the I-mote senders to a mini-laptop
secured to the deck in a waterproof bladder. One of the key features of using I-mote senders
was that they were capable of storing a buffer of data, so that in the event of the signal
being temporarily lost on board (for whatever reason), on resumption of
transmission/reception all data is fully transmitted/received/recorded with no loss. The
battery packs, accelerometers and I-mote data sender packs were all protected in waterproof
boxes and anchored to the deck.
With full scale data acquisition available, the concept of experimental and simulated testing
analysis was to start with high level analysis of laps sailed around a marked course; then
concentrated on velocity polar analysis (dinghy velocity through 180 degrees of heading)
and rudder angles during tacking manoeuvres.
To summarise the problem definition, the aim of this research was to quantify the accuracy
of the current Virtual Sailing simulation when compared to real world manoeuvres.
The primary research questions were:
1. How accurate is the simulation?
2. How accurate does the simulation need to be?
3. How can the simulation be improved?
With key research questions identified, the aims of this study were to:
Quantify the accuracy of the current Virtual Sailing simulation when compared to
real world manoeuvres;
Identify which sailing simulation parameters/coefficients should be investigated in
6
Investigate how the simulation model can be validated using the available data
acquisition system;
Obtain real world validation data from on water testing; Simulate on water conditions using the sailing simulator; and, Identify how the simulation can be improved.
1.3. SCOPE OF WORK
The aims of this study were achieved by conducting a series of manoeuvring tests in both
the full scale and simulated domains, and a number of pre and post processing activities
(Figure 1-4).
Figure 1-4: Simplified Work Scope Flow Chart. Set up Instrumented
Sailing Dinghy
Full Scale Testing
Post Process Data
Program Simulator with Full Scale Conditions and Course
Simulator Testing
Post Process Data
Compare Full Scale and Simulated Data
7
Full scale Laser dinghy testing was carried out, in order to obtain; Time series GPS
location, rudder angle and wind speed and direction data; Set course lap times for
comparison in simulator; Dinghy pilot video and forward direction video.
GPS data combined with video vision of key rudder movements was used to time
synchronise all data, and chronicle all manoeuvres carried out during testing.
GPS, wind anemometer direction and magnitude data channels were post processed to
obtain Dinghy velocity over land (Vd), dinghy heading (relative to magnetic north),
Apparent Wind Speed (AWS), Apparent Wind Angle (AWA), True Wind Speed (TWS);
True Wind Angle (TWA) and, course orientation and lap times sailed during testing.
Sailing simulation course markers and wind speed were reprogrammed to match the
triangular course and conditions experienced during testing.
A virtual representation of the course sailed on Albert Park Lake (See Section 1.2)„Virtual Albert Park‟ was sailed on the simulator by the same pilot that carried out real testing, to
obtain simulated dinghy velocity and rudder information.
Dinghy velocity polar plots were generated and comparisons made between simulated and
full scale data. Rudder angles were analysed in comparing tacking manoeuvres between
8
1.4. LITERATURE REVIEW
Throughout the maritime world, training of personnel using simulators and simulation is
becoming more and more common. In order to ensure simulators realistically replicate
reality, research has been carried out to develop, validate and improve simulations covering
ship simulation (Duffy 2005; Duffy, Renilson and Thomas 2009), large sailing craft (Binns,
Hochkirch, Bord and Burns 2008; Mansbridge 2013); (Capdeville 2010; Lidtke 2013) and
smaller sailing craft; with the exception of validation of the smaller craft themselves.
While small sailing simulators have been and are being developed around velocity
prediction programs and regression data (Mulder 2013), there was no direct experimental
data available for validating the V-Sail trainer. This project focussed on that knowledge gap
and sought to obtain experimental data in order to validate the Vsail trainer simulation and
simulator.
The sailing simulator was originally developed to assess the physiological performance of
sailors (Walls, Gale, Saunders and Bertrand 1998), other examples of which included work
by Cunningham (2007). After a review of the simulator's strengths and weaknesses, work
carried out by Binns, Bethwaite and Saunders (2002) was the first major overhaul of the
simulator.
After the programming upgrade, the sailing simulation was now similar to FRIENDSHIP
Systems Velocity Prediction Program (VPP) (Richardt, Harries and Hochkirch 2005), with
sail lift and drag coefficients derived from Marchaj (1988) and modified to suit the
simulated sail parameters due to an absence of experimental data (Binns, Bethwaite and
Saunders 2002). This lead to the use of data which was not always ideal. In the case of
work by Walls, Gale, Saunders and Bertrand (1998), wind data was used which was
measured on land, which may not necessarily reflect conditions on the water. In
experimental testing, this can be addressed by an onboard anemometer. Ultimately, the
development approach taken has led to a sailing simulator with performance that „feels‟
very similar to reality and is indeed a physically demanding training tool, but the question
remained as to how closely did it match reality in terms of performance?
Simulation Verification, Validation and Calibration (VVC) is common practice (Rakha,
Hellinga, Aerde and Perez 1996; McFarlane 2002) during the development/upgrade
life-cycle phase of a simulation program. Specifically, the International Towing Tank
Conference (ITTC) outlines procedures and guidelines (ITTC 2002) that are to be followed
9
developed to suit marine vehicles with engine propulsion, not sails, leading to the need for a
more suitable series of manoeuvre tests. Binns, Hochkirch, Bord and Burns (2008) outline a
modified series of manoeuvres that are designed specifically to obtain manoeuvring
coefficients for sailing yachts.
Project collaborator Graham Bennett, and a team from the University of Melbourne
(Bennett, Manzie, Oetomo, Binns and Saunders 2010) developed a low cost wireless Data
Acquisition System (DAS) to carry out yacht system identification, or characteristic
dynamic movement identification (not limited to manoeuvring coefficients). To suite the
resources offered by the DAS, select manoeuvres outlined by Binns, Hochkirch, Bord and
Burns (2008) such as luffing into the wind, and monitoring rudder angle during tacking
angles, while logging position/velocity/heading with GPS were used. Additional resistance
validation data for a full scale Laser dinghy has been published by Carrico (2005), and it is
recommended that a comparison be made with the simulation drag curve in future.
Once raw test data had been obtained, post-processing of all data was required. In order to
obtain dinghy heading, True Wind Angle (TWA) and True Wind Speed (TWS) relative to
the course, Longitude and Latitude information needed to be converted to 360 degree
heading by using a modified version (Rick 2001) of „Great Circle Navigation Formulae‟
(Williams 2011).
With time series of velocity and heading obtained, assessment of yacht performance was
represented by a polar plot of velocity over land through 360° heading with assumed
10
1.5. LASER CLASS SAILING DINGHY
The class of yacht used for experimental and simulated analysis was the Laser Class Sailing
dinghy, with Olympic sized rig (the size of the sail). The Laser class sailing dinghy is a
concept first developed in 1969 by Bruce Kirby (Tillman 2005). It is considered to be the
most popular one design sailing class in the world, with competitive events held from club
racing to world championships. To ensure that no competitor gains unfair advantage, all
dimensions of the Laser class dinghy are clearly stipulated by Laser class rules (ILCA
2014). The particulars of the standard Laser class dinghy are shown in Table 1-1, and
dimensions of components used in testing are presented in Figure 1-5, Figure 1-6, Figure
1-7 and Figure 1-8.
[image:25.595.91.488.318.582.2]For simplicity of presentation in this report, the „Laser class sailing dinghy‟ will be referred to as „dinghy‟ from herein.
Table 1-1:Standard Laser class dinghy principal particulars
Parameter Value unit
LOA 4.23 m
LWL 3.81 m
ASAIL 7.06 m2
T 0.30 m
ΔHULL 59 kg
Figure 1-5: Upper mast section sizing common to all Laser classes, used for all full scale tests. All dimensions are in millimetres, drawing is not to scale. Source: Laser Class Rules (February, 2008).
11
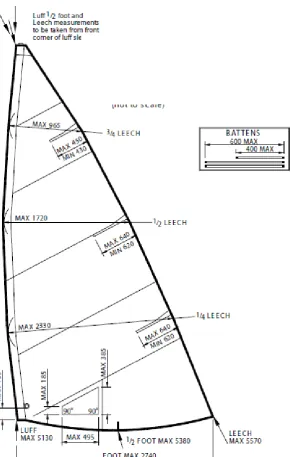
[image:26.595.159.450.85.543.2]Figure 1-7 Governing sail dimensions for the full size Olympic class sail. This sail size has been used for all full scale testing. All dimensions are in millimetres, drawing is not to scale. Source: Laser Class Rules (February, 2008).
12
2. FULL SCALE TESTING AND DATA ACQUISITION
The following chapter discusses experimental procedure, processing of data, results,
discussion, conclusions and recommendations for the third full scale testing session
conducted on Albert Park Lake, Melbourne, during early June 2011. Testing was conducted
in conjunction with project collaborator and wireless Data Acquisition System (DAS)
developer, Graham Bennett.
2.1. INTRODUCTION
The overall goal of full scale testing was to provide a set of time series dinghy performance
data, given measured wind speed and direction on a set course. The course and wind data
were subsequently input into the simulator and simulated testing carried out (See Section
3: Sailing Simulator Testing and Data Acquisition). Specifically, the aims of the test
session were to:
Create and define with GPS measurements, a marker buoy defined course for
measurement and replication in the sailing simulation; Obtain a series of lap times for the marked course;
Obtain time series measurements of Apparent Wind Speed (AWS) and direction for
the duration of testing, to subsequently be combined with dinghy velocity and
heading to produce True Wind Speed (TWS) and direction that would be replicated
in the simulator;
Obtain time series measurements of rudder angle; and, Carry out consecutive upwind tacks.
The wireless Data Acquisition System developed by Graham Bennett (Bennett, Manzie,
Oetomo, Binns and Saunders 2010) was used to acquire the required information during
full scale testing. 4 days of testing were carried out over an 8 day period, with the first 3
days used to shakedown and become familiar with the DAS and test apparatus. Bugs were
ironed out of the DAS and calibration procedures set based on lessons learnt from the first 3
days. The final test day of 4 was the most successful day from the points of view of
equipment calibration through to data acquired and weather conditions experienced. The
13
2.2. EXPERIMENTAL SETUP PROCEDURE
The following is an introduction to key experimental setup procedures. For a complete
guide to experimental setup, please see Appendix A – Experimental Procedures.
GoPro HD cameras were placed on the forward deck (Figure 2-1), facing forward and aft,
to give video footage of course direction, pilot position and rudder position. Video footage
of the dinghy leaving and arriving at the start/finish pontoon combined with video
timestamps, formed a part of time synchronising the GPS and onboard data channels.
Rudder calibration took place using markings placed on the aft deck with a protractor
(Figure 2-4), so that rudder angle could be obtained from the raw encoder information. At the start of each test session, the rudder was held centred then stepped through:
20 degree steps every ~5 seconds to starboard, centre, port and centre, and 10 degrees every 5 seconds to starboard, centre, port and centre.
The 20 degree step check was to provide a quick rough check to compare data for each test
session, and the 10 degree check was for finer calibration should any parameters change
from test to test.
2.2.1. BOOM ANGLE ATT ACHMENT AND CALIBRATION
The mast encoder designed to measure boom rotation angle was tied to the mast with a
piece of elastic cord. Recording boom angle through mast rotation was possible since boom
angle relative to the mast was fixed at boom/mast joint.
Using a similar calibration procedure to rudder angle calibration, the boom was held in line
with the centreline at 0° rotation, then stepped through 45°, 90° and 180° rotation angles
through both the port and starboard sides.
2.2.2. DATA ST ORAGE
The onboard DAS used a sealed notebook in a waterproof bag to collect recorded data. The
bag was anchored to the deck with D shackles (Figure 2-6).
A Velocitek SC-1 GPS unit (Figure 2-7) was located inside the cockpit of the dinghy. It
was housed in a waterproof case specifically designed for use in the marine environment.
2.2.3. RUDDER ANGLE ATT ACHMENT AND CALIB RATI ON
A rudder encoder was attached to the rudderstock using an elastic cord (Figure 2-2, Figure
14
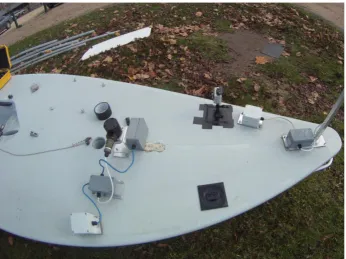
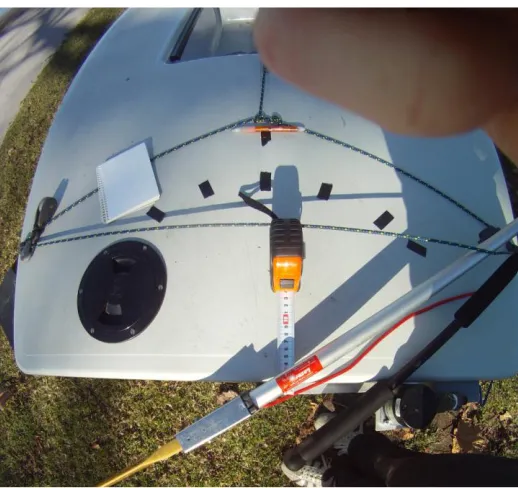
Figure 2-1: Dark (Micro-computer) and Light grey (Transmitter) boxes attached to the deck. The Port/Aft facing camera is attached, with a plate ready for starboard camera mounting. The mast encoder can be seen to the central left, whilst the base of the anemometer is to the extreme right at the bow. All this equipment was structurally robust and watertight, ideal for the harsh conditions.
15
[image:30.595.169.428.48.292.2]Figure 2-4: Rudder angle markings drawn on the aft deck. Deck markings were used before each test to obtain rudder angle calibration data. The rudder was rotated through incremental steps of 10 ° and 20° from side to side to a maximum of 60°, starting at the centre.
16
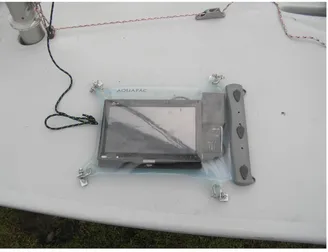
[image:31.595.136.464.56.308.2]Figure 2-6: DAQ Laptop, and GPS unit (bottom right of bag) in waterproof bag. The bag was shackled to the deck.
Figure 2-7: Velocitek SC1 GPS unit in waterproof buoyant casing.
17
2.3. ON-WATER TEST MANOEUVRES
The two following manoeuvres were conducted on Albert Park Lake, Melbourne, with the
aim of obtaining full scale validation data required to complete this study.
2.3.1. TEST 1 –LAPS OF A SET COURSE
Marker buoys with anchor weights were dropped in the lake to form a triangular course
(Figure 2-10). When dropping the buoys into position, station was held next to each one
whilst GPS was recording in order to accurately measure the course. The purpose of marker
measurement was to later reproduce the course in the sailing simulator.
Marker drift was minimal as there were no tidal effects present, and the mooring catenary
was relatively short (3 to 4 metres), due to the shallow nature of the lake.
Multiple laps were completed by rounding the course to the port side; starboard side and upwind/downwind „hotdog‟ laps. All position data was recorded by GPS.
2.3.2. TEST 2 – TACKING M ANOEUVRE
Tacking (changing direction when sailing upwind) performance of sailor, yacht and
simulator is an area that when improved can reduce course times. Multiple tacks were
carried out per lap in negotiating the course. In addition to tacks completed during course
runs, multiple consecutive upwind tacks were completed without following the course to
obtain a comprehensive data set. Tacks were executed whilst sailing in the best apparent
Velocity Made Good (VMG, upwind course velocity). Tacking analysis is a good real
18
2.4. DATA PROCESSING AND ANALYSIS
Raw anemometer data, rudder angle and boom angle encoder data was logged by the
onboard system and stored in .txt files. Raw data obtained was post processed and
converted into a MATLAB compatible format use the 'Data Condition' MATLAB tool
written by University of Melbourne collaborator Graham Bennett.
In order to be able to post process data obtained from testing, calibration and measurement
procedures were carried out prior to each test session (see section 2.2 and Appendix B).
Calibration information was used in conjunction with rudder angle encoder and wind
anemometer Original Equipment Manufacturer (OEM) conversion formulas to convert raw
data signals into meaningful values. For example, rudder angle encoder voltage to degrees
(Figure 2-8) and wind anemometer voltage pulses per second into wind velocity.
In addition to converting raw data into meaningful data, DAS GPS and Video time all
synchronized required synchronizing to provide one continuous time series of data.
2.4.1. SYNCHRONISI NG DAT A
Data Acquisition System (DAS), GPS and video data required synchronising, as all started
recording at different times, and with different time stamp information. Video footage of
rudder movement and boat location at the start of each run, combined with DAS rudder
measurement and GPS track/time analysis provided sufficient information to sync all data.
The procedure to sync all 3 data streams firstly involved synchronising rudder DAS data to
video time. Characteristic rudder movements and durations were noted from onboard video
footage, which took place at the start of each days test session; this gave a link between
data 'bit' time and video time. Secondly, GPS time was required to be linked to video time.
Video footage was reviewed and times were noted when the dinghy started sailing at the
start of each on water test. GPS Action Replay Pro was then used to find the corresponding
start of each run using visualization of the course sailed and the point at which velocity data
increased from zero. A link between GPS time and Video time was now obtained.
Table 2-1 shows DAS Bit data that has been related to video time, and GPS time related to
video time (all highlighted in blue). The delta of 2:10 between the two video times has been
deduced from GPS time, to give one synchronised point in time across all data sets. The
accuracy of synchronising between video time is within ±0.5 seconds, and between Video
to GPS time of ±1 seconds (due to the 0.5Hz GPS sample rate). This level of accuracy is
19
Table 2-1 - Synchronised GPS data with DAS data using Video timestamp references
Bit value Video Time GPS Time
(N/A) (hh:mm:ss) (hh:mm:ss)
50490 0:03:28 13:05:05
0:05:38 13:07:15
2.4.2. RUDDER ANGLE DAT A
Rudder calibration took place using markings placed on the aft deck with a degrees wheel
(Figure 2-4). At the start of each test session, the rudder was held centred then stepped through:
20 degree steps every ~5 seconds to starboard, centre, port and centre, and 10 degrees every 5 seconds to starboard, centre, port and centre.
The raw data that resulted from this process is shown in Figure 2-8.
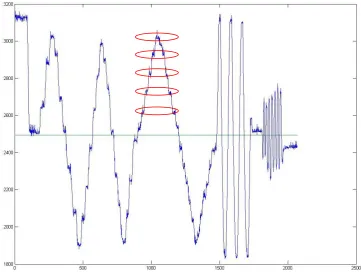
Figure 2-8: Raw time-series rudder encoder data obtained from a rudder angle calibration check. The x-axis is discrete data recorded at 20Hz (20 data points represents 1 second), and the y-axis is 12bit unsigned data (upper values are when rudder is to starboard). One example of incremental rudder angle steps recorded during calibration are highlighted in red. The central transverse mean line indicates zero rudder angle.
With changes in encoder recordings correlated to changes in rudder angle, a relationship
20
2.4.3. WIND ANEM OMETE R CALIB RATI ON
Calibration of the wind anemometer was divided into two measurement areas: direction and
speed. Directional calibration took place at the start of the test, where the wind vane was
held in line with the dinghy, and facing forward. Once zeroed, directly forward of the
dinghy represented 0/360 degrees (Figure 2-9) and angle magnitude increased to starboard
[image:35.595.131.465.183.423.2](direction rotating clockwise).
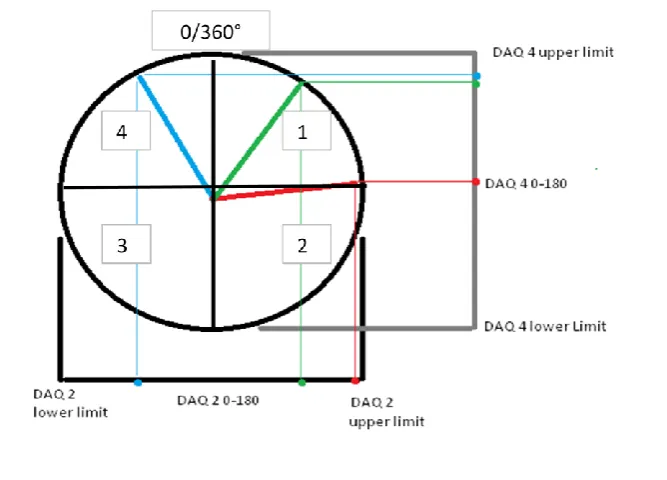
Figure 2-9: Anemometer measurement orientation
Wind speed calibration factors were provided by the manufacturer (Vaisala 2009). The
characteristic transfer function gave velocity as:
𝑈 = 0.24 + 0.699 ∗ 𝐹 (2.1)
Where U=wind speed (m/s) and F=output frequency (Hz).
Processing of the raw wind speed data showed that wind speed data had been altered when
processed into an electrical signal, and required the transfer function to be modified. A
modified transfer function was provided by Graham Bennett where:
𝑈 =0.699
130 ∗ 𝐷𝐴𝑄3 − 6 130
(2.2)
Where U=wind speed (m/s) and DAQ3 is the data channel containing transformed wind
speed information (Hz).
21
GPS data was logged on a VELOCITEK SC1 sailing GPS device, at a sample rate of
0.5Hz. GPS data included:
Date and time (used for synchronising with DAS recorded data, as data is
independent of one another);
Latitude and Longitude (used in heading calculations); and, Velocity and distance.
GPS data was recorded separately to the DAS system by the standalone GPS Velocitek
GPS unit. Files were recorded in the .VCC format, which were then post-processed using
GPS Action Replay Pro. Replay pro was used to visualize (Figure 2-10) and identify key
start/finish times of specific pieces of information such as lap start/finish positions, course
marker positions, characteristics of laps and manoeuvres carried out, and synchronizing of
DAS/Video/GPS data.
22
GPS data was also used to obtain time series dinghy heading, using the theory and
methodology of „Great Circle Navigation Formulae‟ (Williams 2011), which takes into
account the curvature of the earth. Time series based latitude and longitude information
were converted to 360 degree heading information (provided the dinghy was moving)
relative to true north. Dinghy heading and velocity was required to calculate true wind
angle (TWA) and velocity, given apparent wind angle and velocity recorded from the
onboard anemometer. Figure 2-11 demonstrates the influence that dinghy velocity has on
[image:37.595.243.393.237.426.2]True Wind Speed and Angle to give Apparent Speed and Angle.
Figure 2-11 - Visual representation of the influence Dinghy velocity has on True Wind Speed and Angle to result in Apparent Wind Speed and Angle at the dinghy and onboard anemometer.
Leeway angle, or slip, has not been included in the analysis as the magnetic heading
component of the recording system, required to determine leeway, was not functional at the
time of testing.
AWS TWS
VDINGHY TWA
23
2.4.5. ERRORS I N TEST ME ASUREMENTS
Binns, Hochkirch, Bord and Burns (2008) show that the positional data for the full scale
tests was obtained by differential GPS measurements for which error estimates are
generally around ±3 m but can be as low as ±1 m (Farrell and Barth 1998). The GPS data
was sampled at 0.5 Hz. An estimate of the steady state error of ±0.5 knots on boat speed
over land has been used although dynamic measurement errors may be greater. It should be
noted that while dynamic motions may be greater, they are not considered to be significant
due to the calm nature of the lake test area, and the relative stiffness of the test rig
compared to the magnitude of wind measurements that were recorded.
The rudder and tab angle measurements were performed with a rotary potentiometer as
such the errors on the actual measured angle were largely confined to the calibration
process and the play in the coupling between the rudder and potentiometer. The calibration
errors have been estimated at ±1.0° and the coupling errors at ±1.0° combining to make a
total error of ±2.0°.
Boat heading was recorded with differential GPS measurements and the wind speed and
direction measured using onboard wind instruments, with error margins given by the
manufacturer (Vaisala 2009) of ±0.3m/s for speed and less than ±3° for direction. The true
wind angle measurement therefore had errors due to boat speed, boat heading, wind speed
and wind direction measurements.
Error analysis was conducted based on the adaptation of the method demonstrated by
Binns, Hochkirch, Bord and Burns (2008), where error estimates can be obtained using the
first term in a Taylor series expansion of the uncertainty in the true wind angle. For
implementation of the adapted equations (see Appendix C), as per manufacturer
specifications apparent wind angle (AWA) can be measured to an accuracy of ±3°, apparent
wind speed (AWS) ±0.3m/s and it is assumed that this measurement can be related to the
heading of the yacht to ±1°. The propagation of these errors into true wind speed and true
wind angle errors are plotted in Figure 2-12 and Figure 2-13 for sailing to windward during
the duration of full scale experimental testing. From these figures it can be seen that the
error in the true wind speed ranges from ±0.58 to 0.62 m/s and the error in the true wind
24
Figure 2-12 - Error in true wind velocity with respect to apparent wind angle, for an upwind continuous leg.
Figure 2-13 - Error in true wind angle for average wind speed of 12.5 knots with respect to boat speed. Data was from the windward data set, from 10° to 35° AWA.
0.55 0.56 0.57 0.58 0.59 0.60 0.61 0.62 0.63
0.00 5.00 10.00 15.00 20.00 25.00 30.00 35.00 40.00
ƐTWS
(
m
/s)
AWA (°)
0.000 0.500 1.000 1.500 2.000 2.500 3.000 3.500
0.00 0.50 1.00 1.50 2.00 2.50 3.00 3.50
Ɛ
TW
A
(
°)
[image:39.595.131.478.327.529.2]25
2.5. RESULTS AND DISCUSSION
2.5.1. TEST 1 – LAPS OF A SET COURSE
The results of course analysis are shown below in Table 2-2. Each Lap distance was
measured, along with time duration to obtain average velocity over land. True Wind Speed
(TWS) was averaged for each lap, using Apparent Wind Speed (AWS) and dinghy velocity.
The results obtained from this data would be later used to set the conditions in the
simulator.
Table 2-2 - Albert Park Course Lap Results
Lap Distance Time Dinghy Velocity Average TWS No. (m) (min) (s) Knots (m/s) Knots (m/s)
1 457.96 0:04:23 263 3.40 1.75 13.65 7.02 2 445.60 0:04:18 258 3.36 1.73 13.17 6.78 3 464.00 0:04:11 251 3.64 1.87 13.86 7.13 4 459.80 0:04:21 261 3.43 1.76 13.34 6.86 5 473.30 0:05:37 337 2.78 1.43 10.97 5.64 6 483.68 0:05:08 308 3.11 1.60 12.18 6.26 7 513.02 0:05:51 351 2.89 1.49 10.68 5.50 8 514.20 0:05:04 304 3.33 1.71 13.06 6.72 9 711.76 0:07:10 430 3.23 1.66 12.58 6.47 10 518.59 0:05:54 354 2.89 1.49 10.79 5.55 11 545.10 0:05:31 331 3.25 1.67 13.52 6.95
Mean 313 3.21 1.65 12.53 6.44 1 Std Dev 54.67 0.27 0.14 1.20 0.62
Course marker positions were identified by holding station (position) at the markers for
10-15 seconds per each with GPS logging on. The results are shown in Table 2-3, and were
[image:40.595.99.500.227.481.2]programmed into the simulator as shown in chapter 3.
Table 2-3 - Course Marker Locations
Longitudinal (m) Transverse (m) Depth (m)
Marker 1 -77.5 0 0
Marker 2 0 97.4 0
26
2.5.2. DINGHY VEL OCITY POLAR PL OT
Velocity polar plots are a good visual indication of a sailboats maximum speed
performance through all heading angles for a given wind speed. For experimental testing,
True Wind Angle (TWA) relative to dinghy heading were used to plot polar performance,
as shown in Figure 2-14. The axis extending radially outwards represents the dinghy
velocity in Knots (Nautical Miles per Hour, Knts), and extending clockwise around the
[image:41.595.108.492.235.517.2]graph is dinghy heading relative to the True Wind Angle (TWA).
Figure 2-14 - Polar plot of dinghy velocity (knots) through 360degrees of heading relative to True Wind Angle (TWA) recorded during experimental testing. A 10 point moving average smoothed the data, and best fit curve was applied. Note that there are flat spots in the data, especially between 105 to 130 degrees and 150 to 165 degrees. This may be due to a lack of downwind reach runs conducted, as sailing down the course was primarily at 180 degrees to the wind.
The difference in trend in the upper 15 degrees of heading between fitted and measured in
Figure 2-14 data is due to the regression analysis tracing back to a velocity of zero m/s at
zero m/s heading. Headings above 15 degrees with power in the sails resulting in forward
velocity are highly unlikely, due to already passing the stall heading. Measured data above
15 degrees appears to contradict the previous statement, however this is due to the
measurement of velocity whilst tacking/changing course upwind.
27
The dinghy velocity polar plot was obtained using several calculation steps. Firstly, the
method previously discussed in section 2.4.4 and illustrated in Figure 2-11 was used to
obtain True Wind Angle (TWA) and dinghy velocity for any point in the time series data.
To obtain this information, Apparent Wind Speed (AWS) and Apparent Wind Angle
(AWA) combined with dinghy velocity obtained from GPS data were used.
The time series data of dinghy velocity and AWA were then mirrored from 360° to 180°
which combined Port and Starboard tacks into one heading, then placed in data 'bins' for
every 1° of heading. Maximum dinghy velocity for each 1° of heading was then obtained,
and the resultant maximums smoothed using a 10 point moving average. The 'roughness' of
the data in Figure 2-14 is due to the 1° increments of the data.
2.5.3. TEST 2 – TACKING M ANOEUVRE
The GPS tracks of the lapped course were analysed for tack manoeuvres, with
corresponding rudder angle data and duration obtained. The focus was on maximum angle
and overshoot correction at the end of each tack. Resultant data is shown below in Table
2-4.
The logic behind each column in Table 2-4 is as follows: column 1 shows tack number;
column 2 shows maximum rudder angle during the tack; column 3 shows time taken for the
rudder to go from centred at the start of tack, up to maximum and return to zero; column 4
shows overshoot correction time where rudder input is required to pull the dinghy back to
the correct heading after overshooting the intended path (Figure 2-17); column 5 shows the
total manoeuvre duration from tack initiation to achieving a steady desired heading.
Examining the tack durations, tacks 9 and 10 may be considered outlier data. Excluding
these tacks, the mean duration is 6 seconds. Uncertainty for manoeuvre time is increased
once course overshoot correction is taken into account. Overshoot correction is required
28
Table 2-4 - Maximum rudder angles from a series of laps and consecutive upwind tacks.
Full Scale, Albert Park
Tack Max Rudder Angle Centre to Centre Overshoot Correction Total Tack Direction
(No.) (Deg.) (seconds) (seconds) (seconds)
1 48.04 5 0 5 Port to Starboard
2 50.63 5 0 5 Starboard to Port
3 44.45 6 0 6 Starboard to Port
4 52.09 5 0 4 Port to Starboard
5 47.03 5 0 5 Port to Starboard
6 37.49 7 2 9 Starboard to Port
7 53.01 7 0 7 Port to Starboard
8 38.84 6 0 6 Port to Starboard
9 54.27 2 0 2 Port to Starboard
10 61.52 4 0 4 Starboard to Port
11 42.52 8 2 10 Port to Starboard
12 59.72 6 0 6 Starboard to Port
Mean 49.13 6.00* 2.00 5.75
29
Typical rudder angle profiles found during the duration of each tack are shown in Figure
2-15 and Figure 2-16. The durations of each tack are 5 and 6 seconds respectively, with no
overshoot correction required at the ends.
Figure 2-15 - Rudder angle during tack number 5 (see Table 2-4) is shown over time. Note that in this example there is virtually no overshoot correction at the end of the manoeuvre. Of the tacks analysed, overshoot correction or course correction was identified twice in tacks 6 and 11 (see Table 2-4).
30
Figure 2-17 - Rudder angle during tack number 6 (see Table 2-4) is shown over time. Note the course correction required due to overshoot at 13:52:14 to 13:52:16, after 7 seconds of rudder input to execute the tack.
Figure 2-17 was one of two examples found in full scale testing where heading exiting the
turn was overshot, requiring course correction. Any course correction is a waste of
propulsion energy and should be avoided.
2.5.4. MANOE UVRE TESTI NG DI SCUSSI ON
All tests listed in section 2.3 investigating full lap times and manoeuvring characteristics
were carried out. These included laps of a marked course and consecutive upwind tacks.
After a significant amount of post processing the raw data, meaningful data was obtained.
It has been previously stated in Binns, Bethwaite and Saunders (2002) that the added mass
and damping terms may be refined in future, but would require considerable research and
would result in only a relatively small improvement in simulator performance.
The results obtained from full scale testing were used in simulator testing, and the same
analysis involving velocity polars, tacking duration and rudder angle magnitudes were
carried out in section 3.
2.6. CONCLUSIONS AND RECOMMENDATIONS
Full scale experimental testing was carried out, with a range of time series data obtained
including dinghy velocity and heading, Apparent and true wind speed and direction, and
rudder angle. Specific manoeuvres were carried out and times recorded through GPS track
analysis. Manoeuvre times were used to isolate relevant data. Statistical data for course
wind speed and direction were obtained, along with course marker locations that were
31
It was found that typical maximum rudder angles required to tack to windward were 49
degrees, tacking durations took on average 5.9 seconds to complete. Maximum VMG to
windward was 2.6 knots and 3.75 knots to leeward.
It is recommended that if possible in future, a larger test site, possibly a lake, that
experiences less aerodynamic influence from surrounding trees and buildings be used. This
may enable the broadening of the scope of testing, and add certainty to wind direction data
over the whole course.
The Data Acquisition System and supporting equipment was found to be robust, and
potentially applicable to other marine vessels.
It is recommended that hydrodynamic and aerodynamic resistance be the focus of future
32
3. SAILING SIMULATOR TESTING AND DATA ACQUISITION
The following chapter discusses the procedure, analyses conducted, results and conclusions
obtained in carrying out simulator testing using course orientation, wind orientation and
wind velocity parameters obtained from experimental testing outlined in chapter 2.
3.1. INTRODUCTION
The aim of simulator testing was to set the conditions of the simulator to accurately reflect
conditions experienced in full scale experimental testing, and then conduct the simulation to
obtain a data set that can be directly compared with real life data. Testing on the sailing
simulator commenced once sufficient course condition data was obtained from
post-processing the experimental data.
3.2. EXPERIMENTAL SETUP
Experimental data that was input into the simulator were wind speed, course orientation,
and course size. A Laser standard size with Olympic rig (Section 1.5) was selected from the
pre-programmed option list, as the same type was used in experimental testing.
A standard programmed wind speed of 12 knots (with no gusts) was selected based on an
average of 12.53 knots (see Table 2-2 in section 2.5.1) which lies well within the 95%
confidence interval of ±2.4 knots. Markers were added to the simulation in the same
configuration used during experimental testing on the Albert Park Lake Course, as shown
in Table 2-3 section 2.5.1. Their location also took into account the True Wind Direction at
Albert Park, which ran directly down the course.
The simulator was set to its dynamic mode that required the pilot‟s bodyweight to provide a
righting moment. A new Haptic (force) feedback device at the rudder was activated for a
33
Figure 3-1: Sailing the virtual Albert Park lake course on the sailing simulator. Course position, wind speed and wind direction data obtained from experimental testing were all input into the simulation to replicate experimental conditions.
3.3. TESTING PROCEDURE
With sailing conditions and markers set, the course was sailed with a number of
consecutive laps completed, as well as upwind tacking runs to obtain sufficient rudder
angle data. The laps and upwind tacking runs were completed to replicate the runs carried
out during experimental testing at Albert Park lake.
3.4. DATA PROCESSING AND ANALYSIS
Post Processing the data obtained from simulator testing was a lot simpler when compared
to the significant effort required to obtain meaningful data from the experimental test.
During the course of a sailing run the Analysis V7.0 tool was switched on to record time
series: X and Y position on the course, Fwd Velocity, Side (slip) Velocity, wind velocity,
Hiking effort, Boom angle, Rudder Angle and actual wind speed.
3.4.1. COURSE ANALYSIS
Much like the analysis of the experimental data, time series position data was plotted to
allow inspection of the approximate start/finish positions per lap. From the inspections, data
was then isolated to show maximum X values (lowest position on the course) where the
start of each lap occurred. Lap runs were now isolated.
With individual laps identified, the sum of resolved X,Y position differentials was used to
34
3.4.2. RUDDER ANGLE ANALYSIS
Consecutive upwind tacks were carried out (each tack was initiated after velocity and
heading stabilised after the previous tack), in order to obtain velocity and rudder angle
information to validate against experimental data. Tacks from full course laps were also
analysed.
Visualization of sailing simulator data (time series heading and x,y course position) was
used to identify tacking manoeuvres, after which a detailed inspection isolated the tacking
manoeuvre: from steady rudder angle/velocity prior to entering the turn, to steady
velocity/rudder angle at the exit.
3.5. RESULTS AND DISCUSSION
3.5.1. TEST 1 –LAPS OF A SET COURSE
Several different test configurations were run including various combinations of wind
strength, simulator roll active feedback and rudder active feedback. Ultimately, the correct
setup that would match the conditions experienced in experimental testing yielded three
[image:49.595.104.492.416.719.2]complete laps to windward.
Table 3-1 - Sailing Simulator "Virtual Albert Park" Lap Results
Lap Distance Time Dinghy Velocity Average TWS No. (m) (min) (s) knots (m/s) knots (m/s)
1 461.54 00:03:08 188 4.76 2.45 12.00 6.17 2 534.30 00:03:44 224 4.64 2.39 12.00 6.17 3 562.51 00:03:44 224 4.88 2.51 12.00 6.17
mean 212 4.76 2.45 12.00 6.17
1 std dev 0.00 0.12 0.06 0.00 0.00