This is a repository copy of Analysis of the Dynamics of the FT4 Powder Rheometer (vol 285, pg 123, 2015).
White Rose Research Online URL for this paper: http://eprints.whiterose.ac.uk/119774/
Version: Accepted Version
Article:
Hare, C, Zafar, U, Ghadiri, M et al. (3 more authors) (2017) Analysis of the Dynamics of the FT4 Powder Rheometer (vol 285, pg 123, 2015). Powder Technology, 315. pp. 37-38. ISSN 0032-5910
https://doi.org/10.1016/j.powtec.2017.02.061
© 2017. Licensed under the Creative Commons AttributionNonCommercial-NoDerivatives 4.0 International http://creativecommons.org /licen ses/by-nc-nd/4.0/
[email protected] https://eprints.whiterose.ac.uk/ Reuse
Unless indicated otherwise, fulltext items are protected by copyright with all rights reserved. The copyright exception in section 29 of the Copyright, Designs and Patents Act 1988 allows the making of a single copy solely for the purpose of non-commercial research or private study within the limits of fair dealing. The publisher or other rights-holder may allow further reproduction and re-use of this version - refer to the White Rose Research Online record for this item. Where records identify the publisher as the copyright holder, users can verify any specific terms of use on the publisher’s website.
Takedown
If you consider content in White Rose Research Online to be in breach of UK law, please notify us by
Analysis of the Dynamics of the FT4 Powder Rheometer
C. Hare*1, U. Zafar1, M. Ghadiri1, T. Freeman2, J. Clayton2, M. Murtagh1
1 Institute of Particle Science and Engineering, , University of Leeds, Leeds, LS2 9JT, UK
2 Freeman Technology, Tewkesbury, GL20 8DN, UK
* Corresponding author
Dr Colin Hare
Tel: +44 (0) 113 343 2407
Fax: +44 (0)113 343 2384
Email address: [email protected]
1. Introduction
Reliable flow of cohesive powders is very difficult to achieve in many particle process
operations, such as discharge from hoppers and bins, feeding, dosing etc. Suitable designs of
hoppers have long been established by shear cell testing (Jenike, 1967), where the shear
resistance is characterised at a given consolidation stress or state of packing. This technique is
typically carried out at moderate to high stresses and very low shear deformation rates.
However there are two aspects of powder flow characterisation that are relevant to powder
feeding and dosing that are highly challenging (i) low stresses, and (ii) high strain rates.
Recently shear cells have been developed that can provide normal stresses lower than 1 kPa
(Schulze and Wittmaier, 2003), alongside this a number of alternative low stress test methods
have been developed, including the Sevilla Powder Tester (Castellanos et al., 2004), the
Ball Indentation Method (Hassanpour and Ghadiri, 2007). These techniques all operate in the
quasi-static regime, and the measurement of flowability under higher strain rates has received
less attention in the literature. There are many cases where understanding dynamic flow
behaviour is critical for process design and operation, e.g. in screw conveyors and mixers.
Tardos et al. (2003) developed a Couette flow cell consisting of two concentric cylinders with
differential rotational speeds, between which the powder was sheared. They characterised the
dependency of the shear stress on the strain rate for a number of materials in the quasi-static,
intermediate and dynamic regimes, where they showed that the shear stress increased with
strain rate in the intermediate and dynamic regimes. The device requires a large quantity of
powder and gripping of particles is problematic, which results in descent of powder near the
walls (Kumar et al., 2013), consequently refinement is needed to establish this as a suitable
dynamic flow characterisation instrument. Pasha et al. (2014a) simulated the ball indentation
technique in the dynamic regime and showed qualitatively similar trends to those of Tardos et
al. (2003). This technique is promising, with the added advantage of being applicable with
very small quantities of powder, though further investigation into its behaviour in the dynamic
regime is required.
In the last ten years the Freeman FT4 Powder Rheometer has emerged as a novel powder flow
testing device. The flow resistance is characterised by the flow energy; the summation of the
rotational and translational work required to drive a rotating impeller a certain distance into a
powder bed. It has been shown to be able to differentiate the flowability of powders that
otherwise exhibit similar behaviour under shear testing (Freeman, 2006). This may be
attributed in part to the dynamic nature of the test. In other cases the flow energy has correlated
well with other flowability measurement techniques (Leturia, 2014). However, the strain rate
not been determined, although it is claimed that the blade design ensures a constant stress across
the width of the impeller. Consequently the device can currently be used only for comparative
testing, rather than process design. Bharadwaj et al. (2010) used the Distinct Element Method
(DEM) to determine the effects of particle size, shape, size distribution and friction on the force
and torque on the impeller in the FT4 Powder Rheometer for a non-cohesive system. Hare et
al. (2011) characterised the stress and strain rate distribution within an agitated powder bed by
the Distinct Element Method (DEM). In this paper we follow a similar approach to analyse
the dynamic powder behaviour in the FT4 Powder Rheometer for cohesive particles.
2. Materials and Methods
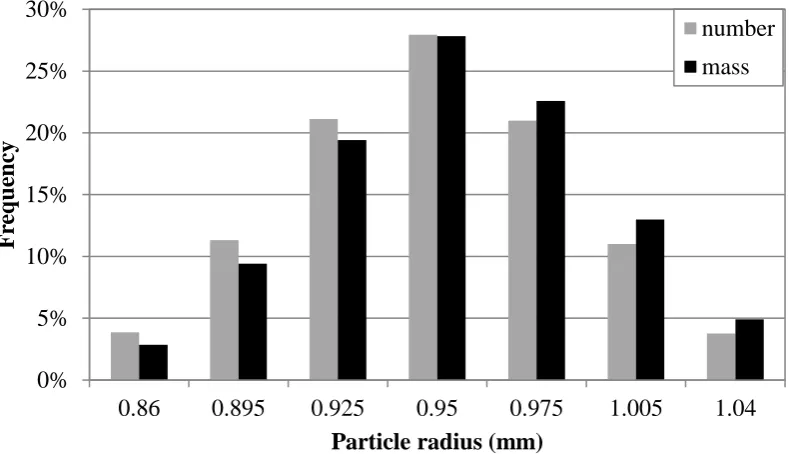
In order to allow for accurate simulations by DEM, 1.7 – 2.1 mm spherical glass beads are used
in this work, with the size distribution given in Figure 1. These beads are silanised with
sigmacote® (with hexane functional group) to provide a cohesive coating layer, whilst size and
shape are maintained. In the coating process 250 g of glass beads are mixed with 60 ml of
sigmacote® and put on a filter then left for 30 minutes, after which vacuum is applied. This
process is repeated three times to ensure even coating (approximately 30 ml of sigmacote® is
retained prior to washing) and then the beads are washed with de-ioninsed water, prior to drying
at 30oC for 16 hours. The surface energy of the beads is characterised by the drop test method
(Zafar et al., 2014), where the balance of cohesive force, given by JKR model (Johnson and
Kendall, 1971) and detachment force for a critical particle size, which is identified by
Figure 1. Size distribution of the simulated glass beads
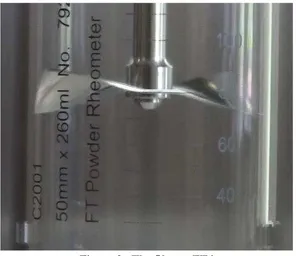
The 50 mm diameter FT4 vessel with the 48 mm impeller is used (Figure 2). The standard test
procedure is applied to the bed of glass beads, whereby the bed is initially conditioned by
rotating the impeller clockwise to gently slice the bed surface and produce a reproducible, low
stress packing state. The cell is then split to remove any material above a bed height of 80 mm.
Following this step the test is carried out with a tip speed of 100 mm/s and a helix angle of 5o
(full blade velocity details given in Table 1) by rotating the blade anti-clockwise, thus driving
into the powder bed. The vertical force acting on the base, Fbase, and the torque acting on the
impeller, T, are measured at approximately 200 m increments of vertical displacement. The
flow energy,
dH F tan R
T
Eflow H ba se
0 , (1)
where R is the impeller radius, is the helix angle and H is the penetration depth. The total
flow energy corresponds to a penetration depth of 70 mm (10 mm from the base). 0%
5% 10% 15% 20% 25% 30%
0.86 0.895 0.925 0.95 0.975 1.005 1.04
F
re
q
u
en
cy
Particle radius (mm)
number
Figure 2. The 50 mm FT4
The FT4 operation described above is simulated by DEM using the EDEM code of DEM
Solutions (Edinburgh, UK). Approximately 25,000 particles are generated in a column with a
height of 0.5 m and allowed to descend under gravity to produce a bed height of 80 – 85 mm,
after which particles above a height of 80 mm are removed. Since the initial packing fraction
at the point of generation is low, the bed preparation procedure is not expected to influence the
resulting flow energy, hence the conditioning step is ignored in the simulations. In order to
accurately account for the cohesive nature of the beads, whilst ensuring adequate simulation
times, the linear elastic plastic and adhesive model of Pasha et al. (2014b) is used (Figure 3).
The elastic and plastic stiffnesses, ke and kp, respectively, were measured by compressing 25
individual beads to a load of 1 N using an Instron Mechanical Testing machine (model 5566).
The particle-particle and particle-wall friction coefficients are estimated to be 0.1 in the first
instance; however the influence of particle-particle sliding friction on the resulting flow energy
2 and 3, respectively. The critical time-step, tcrit, is 1.15 × 10⁻⁵ s, consequently a time step of
2.29 × 10⁻⁶ s (0.2 t
[image:7.595.138.462.156.447.2]crit) is used.
Figure 3. Contact model of Pasha et al. (2014b)
3. Results and Discussion
3.1 Experimental
The cohesivity of the silanised glass beads as used in the experiments was insufficient to be
characterised by the drop test directly, instead smaller glass beads were also silanised following
the same procedure and used in the drop test method to measure the surface energy. In the
work of Zafar et al. (2014), the drop velocity was varied resulting in particles of different sizes
detaching from the substrate, yet giving similar surface energy values. It is therefore assumed
glass beads of 63 – 125 m sieve sizes were coated with Sigmacote® supplied by
Sigma-Aldrich®. The silanised beads were dispersed onto a silanised 7 mm diameter glass slide using
the dispersion unit of the Malvern Morphologi G3®. The size distributions before and after
the test were also measured with the Malvern G3. A drop height of 40 mm was used, which
provided an impact velocity of 4 m/s, from which the surface energy was estimated using the
approach of Zafar et al. (2014). The surface energy of these coated glass beads was estimated
to be 29 mJ/m2 and used in the elastic plastic and adhesive model of Pasha et al. (2014b) in the
EDEM code.
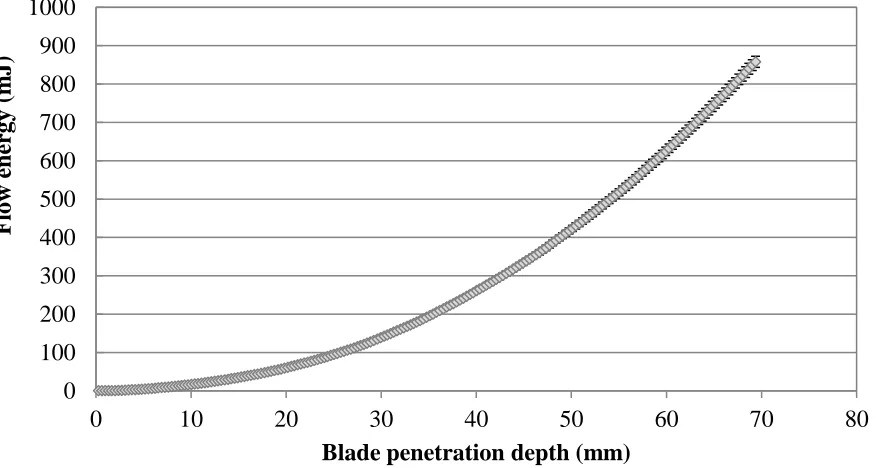
The glass beads were poured into the FT4 vessel and tested under the operational conditions
described in section 2. Four separate powder beds were tested. The average flow energy for
these tests is shown in Figure 4 along with the error bars indicating the standard deviation,
[image:8.595.83.522.468.702.2]where good reproducibility is obtained.
Figure 4. The flow energy of the coated glass beads
0 100 200 300 400 500 600 700 800 900 1000
0 10 20 30 40 50 60 70 80
F
low
e
n
er
gy
(m
J)
3.2 DEM Simulations
The flow energy in the DEM simulations was calculated from the torque on the blade and
downward force on the base of the vessel using equation 1. The resulting flow energy values
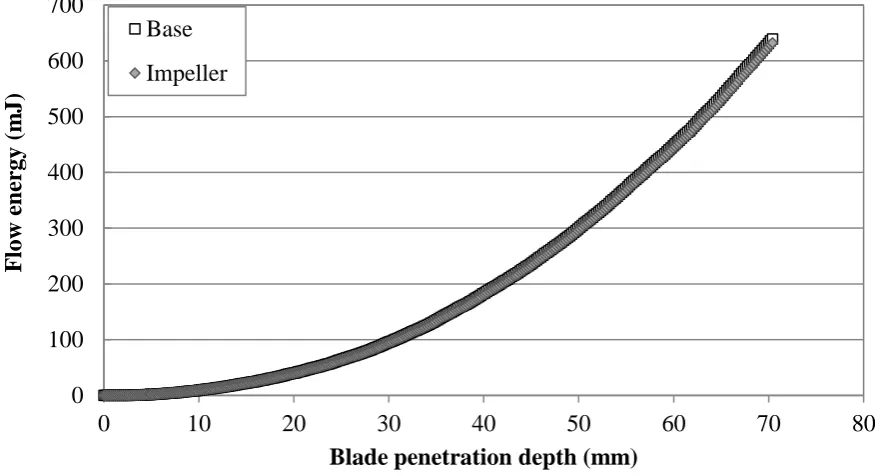
for the simulations and experiments of the silanised glass beads are shown in Figure 5. The
simulations underestimate the flow energy measured experimentally by about 28% at full
penetration, with the total flow energy found to be 639 and 891 mJ in the simulations and
experiments, respectively. This discrepancy may be due to the coefficient of sliding friction
used being too low (0.1). To address this, the simulations were repeated using sliding friction
coefficients of 0.2, 0.3, 0.4 and 0.5. Figure 6 shows the variation in total flow energy with
sliding friction. There is a notable increase in flow energy as s is increased, although this
change is more substantial at lower friction values. Such behaviour is expected, as shown by
Gröger and Katterfeld (2006) who found that increasing s beyond 0.5 had limited effect on
Figure 5. Comparison of the experimental and simulated glass beads coated with hexane functional group
Figure 6. Influence of sliding friction coefficient on total flow energy
The flow energy accounts for the resistance to movement of the blade, hence it would be
expected that the downward force contribution used in the calculation should be that acting on 0 100 200 300 400 500 600 700 800 900 1000
0 10 20 30 40 50 60 70 80
F low e n er gy (m J)
Blade penetration depth (mm)
Simulation Experiment 0 200 400 600 800 1000 1200
0 0.1 0.2 0.3 0.4 0.5 0.6
T otal f low e n er gy (m J)
Coefficient of sliding friction
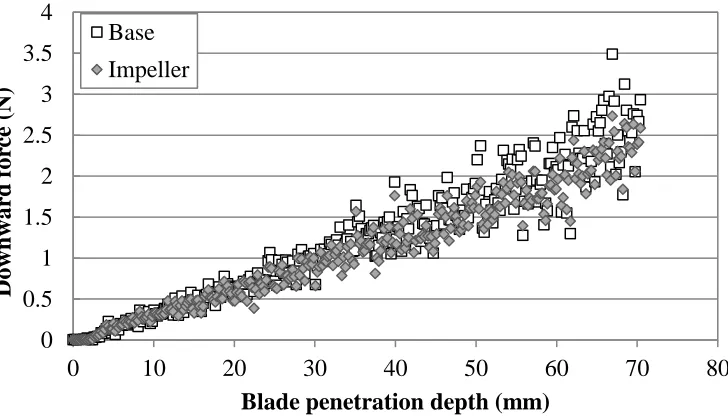
[image:10.595.89.511.405.650.2]the blade. However, the experimental device uses the downward force acting on the base to
determine the vertical work. The DEM allows the forces acting on all particles and walls to be
estimated, which means the vertical force acting on the base and the blade can be compared.
This is shown in Figure 7, where the force acting on the base is very similar to that acting on
the impeller, but is marginally greater throughout the entirety of the test. The flow energy was
also calculated using equation 1 with the force acting on the impeller, this is compared to the
flow energy using the force acting on the base in Figure 8. The flow energies using the force
acting on the impeller and on the base are 632 and 639 mJ, respectively. Therefore the slight
discrepancy between the force on the base and the impeller has a negligible contribution to the
flow energy, thus suggesting the resistance to flow is predominantly rotational, i.e. T/Rtan >>
Fbase. Further investigations into operation under different helix angles or blade geometries
[image:11.595.118.482.436.646.2]may shed light as to why this is the case.
Figure 7. The vertical forces acting on the base and the blade
0 0.5 1 1.5 2 2.5 3 3.5 4
0 10 20 30 40 50 60 70 80
Dow
n
w
ar
d
f
or
ce
(N
)
Blade penetration depth (mm)
Base
Figure 8. The flow energy calculated using the vertical forces acting on the base and the impeller
Figure 9. Stress measurement cells used in the DEM.
The DEM simulations allow the internal bed stresses and velocities to be assessed. Here we
consider the stresses immediately in front of the blade, within three measurement regions that
span the width of the blade, as shown in Figure 9. The measurement cells are 10 mm high
(equal to the blade), 6.3 mm wide and 6 mm deep, and are in direct contact and aligned with 0
100 200 300 400 500 600 700
0 10 20 30 40 50 60 70 80
F
low
e
n
er
gy
(m
J)
Blade penetration depth (mm)
Base
[image:12.595.167.430.398.582.2]the leading face of the impeller. The normal and shear stresses within the measurement cells
are estimated by considering the forces acting on all particles in the cell using equation 2,
N ij
ij F r
V 1 1
, (2)
where V is the cell volume, N is the number of particles in the cell, and F is the force acting in
direction i on face j of the particle (Bagi, 1996), using Cartesian coordinates. From these
stresses the major, intermediate and minor principal stresses are then calculated from the nine
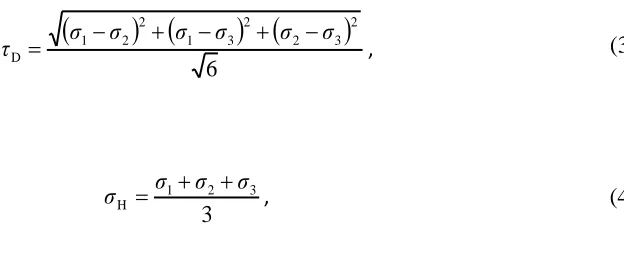
stress tensors by determination of eigenvalues. The deviatoric stress, D, and average
compressive stress, H, are given by equations 3 and 4, respectively (Luding, 2008).
6 2 3 2 2 3 1 2 2 1 D , (3)
3 3 2 1 H
, (4)
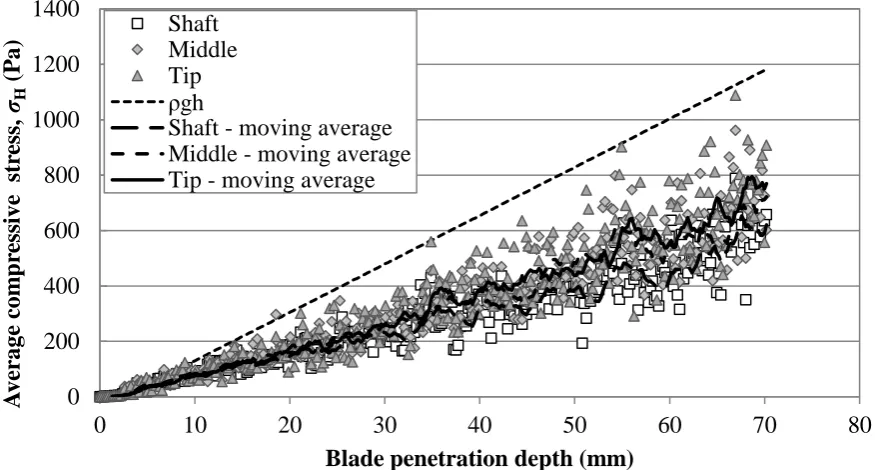
[image:13.595.186.498.389.522.2]The evolution of the average compressive stress in the three measurement cells is shown in
Figure 10, along with the hydrostatic head of the particles ( gh), where is the bulk density of
the bed. The moving averages of 10 data points are shown by the dashed lines for the average
compressive stress in each measurement cell. It can be seen that the average compressive stress
continually increases as the blade descends further into the bed. The increase is approximately
linear, as indicated by the moving averages. The increase is less than that of the hydrostatic
stress, as would be expected since a portion of the stress is transferred laterally to the walls by
number of particles in each measurement cell (approximately 35 – 55 particles). Despite this
scatter, it is clear that the average compressive stress values are strikingly similar in the three
measurement cells, with a very slight increase in stress from the shaft towards the tip of the
[image:14.595.81.519.219.454.2]blade. This increase suggests the bed is more mobilised by the impeller near the wall region.
Figure 10. Average compressive stresses during the simulated FT4 test
The deviatoric stresses in the three measurement cells throughout the FT4 test are shown in
Figure 11, along with the corresponding moving averages of 10 data points. The scatter in the
deviatoric stresses is more significant than the compressive stresses, however the moving
averages clearly show an approximately linear increase in stress with blade penetration depth.
The similarity in the deviatoric stresses across the length of the blade (radial direction) is
remarkable, and suggests the designed twist in the blade does indeed provide a roughly constant
shear stress profile along the radial direction across the blade length. 0
200 400 600 800 1000 1200 1400
0 10 20 30 40 50 60 70 80
A
ve
rage
c
om
p
re
ssi
ve
str
ess,
jH
(P
a)
Blade penetration depth (mm)
Shaft Middle Tip
gh
Figure 11. Deviatoric stresses during the simulated FT4 test
4. Conclusions
The standard downward test procedure of the FT4 Powder Rheometer was carried out
experimentally and also computationally simulated by the DEM. The simulations using a
linear elasto-plastic and adhesive contact model underestimated the flow energy measured in
FT4 experiments by about 28% at the maximum penetration depth. This is expected to be due
to the value of sliding friction coefficient used in the simulations being too low. An increase
in sliding friction coefficient from 0.1 – 0.5 caused an increase in the flow energy. The
simulations show that the vertical force acting on the base is slightly greater than that acting
on the impeller, however the flow energy is almost identical regardless of which force is used
as the torque dominates the value of flow energy. The deviatoric and hydrostatic stresses in
front of the blade were estimated from the DEM. The results suggest that the design of the
FT4 blade provides a roughly constant shear stress along the blade length, i.e. in the radial
direction. Further work will address the shear strain rate sensitivity, the influence of particles 0
20 40 60 80 100 120 140
0 10 20 30 40 50 60 70 80
De
viator
ic
str
ess,
kD
(P
a)
Blade penetration depth (mm)
Shaft Middle Tip
properties (such as shape and cohesion) on the shear flow behaviour and the relationship
between the flow energy and powder yield stresses, as measured by the shear cell method.
References
Bagi, K., 1996, Stress and strain in granular assemblies, Mechanics of Materials, 22, 165-177.
Bharadwaj, R., Ketterhagen, W., Hancock, B., 2010, Discrete element simulation study of a
Freeman powder rheometer, Chemical Engineering Science, 65, 5747-5756.
Castellanos, A., Valverde, J.M., Quintanilla, M.A.S., 2004, The Sevilla powder tester: a tool
for characterizing the physical properties of fine cohesive powders at very small
consolidations, KONA, 22, 66-81.
Gröger, T., Katterfeld, A., 2006, On the numerical calibration of discrete element models for
the simulation of bulk solids, 16th European Symposium on Computer Aided Process
Engineering, 533 – 538.
Formisani, B., Bernado, P., Girionte, R., Minnicelli, A., 2002, The bed support experiment in
the analysis of the fluidization properties of fine solids. In: Proceedings of the conference
4th World Congress on Particle Technology. Sydney (Australia), 373.
Freeman, R., 2006, Measuring the flow properties of consolidated, conditioned and aerated
powders – a comparative study using a powder rheometer and a rotational shear cell, Powder
Technology, 174, 25-33.
Hare, C., Ghadiri, M., Dennehy, R., 2011, Prediction of attrition in agitated particle beds,
Chemical Engineering Science, 20, 4757-4770.
Hassanpour, A., Ghadiri, M., 2007, Characterisation of flowability of loosely compacted
cohesive powders by indentation, Particle & Particle Systems Characterisation, 24(2),
117-123.
Johanson, K., 2014. Personal Communication. Material Flow Equipment, LLC, 7010 NW 23rd
Way, Suite A, Gainesville, FL 32653 USA, http://www.matflowsol.com.
Johnson, K., Kendall, A., 1971, Surface energy and the contact of elastic solids, Proc. R. Soc.
Lond. Series A, Math. Phys. Sci., 324, 301-313
Kumar, V.S., Murthy, T., Nott, P.R., 2013, Rheometry of dense granular materials: the crucial
effects of gravity and confining walls, Powder & Grains 2013 Proceedings, 49-51.
Leturia, M., Benali, M., Lagarde, S., Ronga, I., Saleh, K., 2014, Characterization of flow
properties of cohesive powders: a comparative study of traditional and new testing methods,
Powder Technology, 253, 406-423.
Luding, S., 2008, Constitutive relations for the shear band evolution in granular matter under
large strain, Particuology, 6, 501-505.
Pasha, M., Hare, C., Hassanpour, A., Ghadiri, M., 2014a, Numerical analyses of strain rate in
powder flow measurements by ball indentation, Granular Matter, submitted.
Pasha, M., Dogbe, S., Hare, C., Hassanpour, A., Ghadiri, M., 2014b, A new linear contact
model for elasto-plastic and adhesive contacts in distinct element method, Granular Matter,
16, 151-162.
Schulze, D., Wittmaier, A., 2003, Flow properties of highly dispersed powders at very small
consolidation stresses, Chemical Engineering & Technology, 26(2), 133-137.
Tardos, G.I., McNamara, S., Talu, I., 2003, Slow and intermediate flow of a frictional bulk
powder in the Couette geometry, Powder Technology, 131, 23-39.
Zafar, U., Hare, C., Hassanpour, A., Ghadiri, M., 2014, Drop test: a new method to measure