^¿L
eurostat
Theme 2
Economy and finance Series Β
Shortterm trends
ISSN 10110844
ECUEMS information
5-6 D 1992
Monthly
CYPRIOT POUND LINKED TO ECU FROM 19 JUNE 1992
The Cypriot authorities have decided to tie the Cypriot pound to the ecu with effect from 19 June 1992. The Cypriot pound was previously tied to a basket of 15 currencies which included the US dollar and the yen. The government in Nicosia believes that the move will support Cyprus's application to join the European Community, which it submitted in July 1990. The Cypriot authorities have fixed a central rate of ECU 1.7086 to the pound (approximately CYP 0.5853 to the ecu), with a fluctuation band of 2.25%.
In a referendum held on 2 June 1992, the Danish people voted by a very slender majority to reject the proposed Treaty on European Union (the Maastricht Treaty). Since then, however, a referendum held in Ireland and a parliamentary vote in Luxembourg have given the Treaty resounding endorsements. A referendum is due to be held in France on 20 September. The Danish "No" has depressed the use of the ecu on financial markets. Although the result of the Danish referendum has not had any marked short-term effects on exchange rates within the Exchange Rate Mechanism, there has been some nervousness on foreign exchange markets.
The value of the Portuguese escudo appreciated considerably in April, May and June, following its entry into the EMS Exchange Rate Mechanism on 6 April. The average exchange rate of the escudo in June was 170.432 to the ecu, which is 4.6% above its central rate.
At its annual meeting, held in Paris on 12 June, the ECU Banking Association (EBA) elected Mr 0 . Mas of Crédit Lyonnais as its new President. The EBA also proposed a change to its rules, allowing central banks which wish to take part in the ecu clearing system to do so. This is in line with the call from a group of central bank experts for the system to be strengthened.
eurostat
OFICINA ESTADÍSTICA DE LAS COMUNIDADES EUROPEAS DE EUROPÆISKE FÆLLESSKABERS STATISTISKE KONTOR STATISTISCHES AMT DER EUROPÄISCHEN GEMEINSCHAFTEN ΣΤΑΤΙΣΤΙΚΗ ΥΠΗΡΕΣΙΑ ΤΩΝ ΕΥΡΩΠΑΪΚΩΝ ΚΟΙΝΟΤΗΤΩΝ STATISTICAL OFFICE OF THE EUROPEAN COMMUNITIES OFFICE STATISTIQUE DES COMMUNAUTÉS EUROPÉENNES ISTITUTO STATISTICO DELLE COMUNITÀ EUROPEE
BUREAU VOOR DE STATISTIEK DER EUROPESE GEMEENSCHAPPEN SERVIÇO DE ESTATÍSTICA DAS COMUNIDADES EUROPEIAS
L-2920 Luxembourg - Tél. 43011 - Télex: Comeur Lu 3423
B-1049 Bruxelles, bâtiment Berlaymont, rue de la Loi 200 (bureau de liaison) - Tél. 2351111
Note
For any
tel.
Fax
information on
4301-4785
4301-3288
4301-4150
the statistics in this bulletin
T.
G.
Mathisse
Thouvenin
contact Luxembourg:
Contents
I.
II.
III.
IV.
v.
VI.
VII.
A graph of the bilateral fluctuations of the ERM
Yearly and monthly issues of ecu bonds.
EMCF rate, interest rates on ecu deposits and
Last month's ecu bond issues.
Consumer price indices in national currencies.
Consumer price indices in ecus.
Yearly, monthly and daily ecu exchange rates.
currencies.
yields on ecu bonds.
© ECSC-EEC-EAEC, Brussels · Luxembourg, 1992
Reproduction is authorized, except for commercial purposes, provided the source is acknowledged.
TABLE I
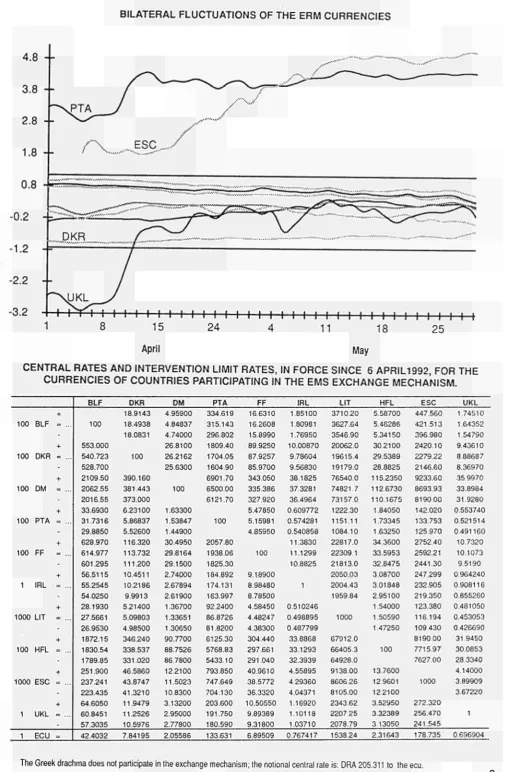
BILATERAL FLUCTUATIONS OF THE ERM CURRENCIES
April
May
CENTRAL RATES AND INTERVENTION LIMIT RATES, IN FORCE SINCE 6 APRILI 992, FOR THE
CURRENCIES OF COUNTRIES PARTICIPATING IN THE EMS EXCHANGE MECHANISM.
100
100
100
100
100
1 BLF
DKR
DM
PTA
FF
IRL
1000 LIT
100
1000
1 1
HFL
ESC
UKL ECU
+
= ...
-+
= ...
-+
-+
= ...
-+
= ...
-+
= ...
-+
= ...
-+
= ...
-+
= ...
-+
= ...
-=
BLF 100
553.000 540.723 528.700 2109.50 2062.55 2016.55 33.6930 31.7316 29.8850 628.970 614.977 601.295 56.5115 55.2545 54.0250 28.1930 27.5661 26.9530 1872.15 1830.54 1789.85 251.900 237.241 223.435 64.6050 60.8451 57.3035 42.4032
DKR
18.9143 18.4938 18.0831
100
390.160 381.443 373.000 6.23100 5.86837 5.52600 116.320 113.732 111.200 10.4511 10.2186 9.9913 5.21400 5.09803 4.98500 346.240 338.537 331.020 46.5860 43.8747 41.3210 11.9479 11.2526 10.5976 7.84195
DM
4.95900 4.84837 4.74000 26.8100 26.2162 25.6300
100
1.63300 1.53847 1.44900 30.4950 29.8164 29.1500 2.74000 2.67894 2.61900 1.36700 1.33651 1.30650 90.7700 88.7526 86.7800 12.2100 11.5023 10.8300 3.13200 2.95000 2.77800 2.05586
PTA
334.619 315.143 296.802 1809.40 1704.05 1604.90 6901.70 6500.00 6121.70
100
2057.80 1938.06 1825.30 184.892 174.131 163.997 92.2400 86.8726 81.8200 6125.30 5768.83 5433.10 793.850 747.649 704.130 203.600 191.750 180.590 133.631
FF
16.6310 16.2608 15.8990 89.9250 87.9257 85.9700 343.050 335.386 327.920 5.47850 5.15981 4.85950
100
9.18900 8.98480 8.78500 4.58450 4.48247 4.38300 304.440 297.661 291.040 40.9610 38.5772 36.3320 10.50550
9.89389 9.31800 6.89509
IRL
1.85100 1.80981 1.76950 10.00870 9.78604 9.56830 38.1825 37.3281 36.4964 0.609772 0.574281 0.540858 11.3830 11.1299 10.8825
1
0.510246 0.498895 0.487799 33.8868 33.1293 32.3939 4.55895 4.29360 4.04371 1.16920 1.10118 1.03710 0.767417
LIT
3710.20 3627.64 3546.90 20062.0 19615.4 19179.0 76540.0 74821.7 73157.0 1222.30 1151.11 1084.10 22817.0 22309.1 21813.0 2050.03 2004.43 1959.84 1000 67912.0 66405.3 64928.0 9138.00 8606.26 8105.00 2343.62 2207.25 2078.79 1538.24
HFL
5.58700 5.46286 5.34150 30.2100 29.5389 28.8825 115.2350 112.6730 110.1675 1.84050 1.73345 1.63250 34.3600 33.5953 32.8475 3.08700 3.01848 2.95100 1.54000 1.50590 1.47250
100
13.7600 12.9601 12.2100 3.52950 3.32389 3.13050 2.31643
ESC
447.560 421.513 396.980 2420.10 2279.22 2146.60 9233.60 8693.93 8190.00 142.020 133.753 125.970 2752.40 2592.21 2441.30 247.299 232.905 219.350 123.380 116.194 109.430 8190.00 7715.97 7627.00 1000 272.320 256.470 241.545 178.735
UKL
1.74510 1.64352 1.54790 9.43610 8.88687 8.36970 35.9970 33.8984 31.9280 0.553740 0.521514 0.491160 10.7320 10.1073 9.5190 0.964240 0.908116 0.855260 0.481050 0.453053 0.426690 31.9450 30.0853 28.3340 4.14000 3.89909 3.67220
1
0.696904
TABLE II
ECU BOND ISSUES (Mio ECU) *
1986 1987 1988 1989 1990 1991
1990
1991
1992
March April May
IV
I II III IV
I
TOTAL
6 840 7 236 9 248 11 127 15 040 26 379
4 850
11 795 5 556 3 940 5 088
11665 3610 3 240 1 465
European Community
Total
4 226 4 303 5 335 6 461 10 525 18 301
3 625
9 760 4 656 1 950 1 935
6 740 2 700 2 675 690
Business sector
2 358 2 058 3 390 4 400 3 990 7 056
1 125
1 100 2 906 1 115 1 935
3 400 1 800 775 440
Govern-ments
558 900 100 500 5 000 7 650
2 500
6 250 '1 400 0 0
1625 125 1 500 250
Insti-tutions
1 310 1 345 1845 1 561 1 535 3 595
0
2410 350 835 0
1 715 775 400 0
Non-European Community
Total
2614 2 933 3913 4 666 4 515 8 078
1 225
2 035 900 1990 3 153
4 925 910 565 775
Business sector
2 204 2 180 3 138 4 141 3 565 4 478
975
1 535 800 990 1 153
2 075 575 215 375
Govern-ments
350 453 575 425 550 2 500
250
500 0 1 000 1 000
1 650 0 0 150
Insti-tutions
60 300 200 100 400 1 100
0
0 100 0 1 000
1 200 335 350 250
Recording based on the payment date
TABLE III
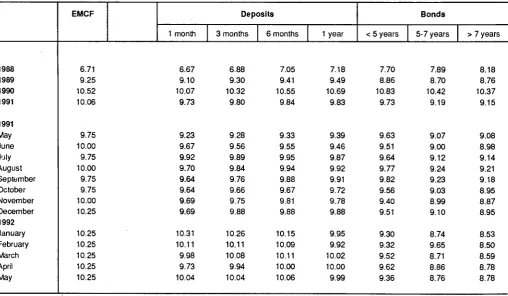
OPERATIONS RATES OF THE EMCF (CALCULATION MONTH) AND INTEREST RATES AND YIELDS OF ECU INVESTMENTS (%)
1988 1989 1990 1991
1991 May June July August September October November December 1992 January February March April May
EMCF Deposits
1 month
6.71 6.67 9.25 9.10 10.52 10.07 10.06 9.73
9.75 9.23 10.00 9.67 9.75 9.92 10.00 9.70 9.75 9.64 9.75 9.64 10.00 9.69 10.25 9.69
10.25 10.31 10.25 10.11 10.25 9.98 10.25 9.73 10.25 10.04
3 months
6.88 9.30 10.32 9.80
9.28 9.56 9.89 9.84 9.76 9.66 9.75 9.88
10.26 10.11 10.08 9.94 10.04
6 months
7.05 9.41 10.55 9.84
9.33 9.55 9.95 9.94 9.88 9.67 9.81 9.88
10.15 10.09 10.11 10.00 10.06
1 year
7.18 9.49 10.69 9.83
9.39 9.46 9.87 9.92 9.91 9.72 9.78 9.88
9.95 9.92 10.02 10.00 9.99
Bonds
< 5 years
7.70 8.86 10.83 9.73
9.63 9.51 9.64 9.77 9.82 9.56 9.40 9.51
9.30 9.32 9.52 9.62 9.36
5-7 years
7.89 8.70 10.42 9.19
9.07 9.00 9.12 9.24 9.23 9.03 8.99 9.10
8.74 9.65 8.71 8.86 8.76
> 7 years
8.18 8.76 10.37 9.15
9.08 8.98 9.14 9.21 9.18 8.95 8.87 8.95
TABLE IV
LAST MONTH'S ECU BOND ISSUES
Issue Payment
Date
11/04/1992 28/04/1992
18/04/1992 11/05/1992
25/04/1992 19/05/1992
25/04/1992 22/05/1992
02/05/1992 19/05/1992
02/05/1992 21/05/1992
09/05/1992 20/05/1992
09/05/1992 26/05/1992
09/05/1992 04/06/1992
09/05/1992 27/05/1992
09/05/1992 05/06/1992
16/05/1992 04/06/1992
16/05/1992 04/06/1992
16/05/1992 29/05/1992
16/05/1992 22/06/1992
16/05/1992 09/06/1992
23/05/1992 27/05/1992
Borrower (country)
Eurofima (SWITZERLAND)
Credit Local de FRANCE
Asea Brown Bovery (SWEDEN)
World Bank Banque Mondiale
Spintab (SWEDEN)
B.C.P. (PORTUGAL)
Johnson & Johnson (U.S.A.)
Republic of TURKEY
Phillip Morris (U.S.A.)
Credit Local de FRANCE
Nederlandsche Gasunie (NEDERLAND)
N T T . (JAPAN)
Eurofima (SWITZERLAND)
K.F.W. (DEUTSCHLAND)
Kommuninvest I Orebro U n AB (SWEDEN)
Kommuninvest I Orebro Lan AB (SWEDEN)
ESPAÑA
Listing :
Issued (Mio Ecu)
40
75
125
250
100
140
150
150
150
100
110
200
500
125
65
50
Issue Price
99.500
99.000
100.000
100.000
100.000
100.000
100.000
99.879
99.800
98.400
99.800
99.500
98.200
100.575
99.937
100.000
250 100.000
LX = Luxembourg
(1) Issued at fixed Re-offer price (2) 9 % < 30 July 1992, 3 M. Libor +.0625%
Coupon
8.625
8.5
9
(2)
9
8.75
9
11.5
9.25
8.5
8.75
8.75
8.5
9
9.625
9
9.2
PA = Paris
Term (years)
7.4
5
5
10
7
10
5
3
5
5
5
5
15
4
3
7
2
Maturity
01/09/1999
30/01/1997
10/05/1997
.704/2002
19/05/1999
21/05/2002
20/05/1997
26/05/1995
04/06/1997
27/05/1997
05/06/1997
04/06/1997
04/06/2007
29/05/1996
22/06/1995
09/06/1999
26/05/1994
LN = London Yields
%
8.71
8.75
9.00
9.43
9.00
8.75
9.00
11.81
9.30
8.91
8.82
8.88
8.72
8.32
9.65
9.00
9.20
Lead Manager
S.B.C.
Banker Trust
C.S.F.B.
U.B.S. P. & D.
I.B.J.
U.B.S. P. & D.
J.P. Morgan
Paribas CM.
Paribas CM.
U.B.S. P. & D.
Paribas CM.
S.B.C.
J.P. Morgan
Dresdner Bank
N.W.C.M.
Daiwa Europe
Lehman
Listing
LX
LX
LX
LX
LN
LX
LX
LX
LX
UPA
LX
LN
LX
LX
LX
LX
LX
Notice
(D
Swap(1)
Swap(1)
FRN(1)
Swap
Conv. ELD
Swap(1)
(1)
Swap(1)
Swap(1)
Swap(1)
Swap(1)
(1)
Swap(1)
(1)
(1)
TABLE V
CONSUMER PRICE INDICES IN NATIONAL CURRENCY
1985=100 B DK D ELL E F IRL I L NL Ρ UK EUR 12 ERM 1970 34.9 26.8 50.4 10.3 13.5 25.3 15.6 14.2 37.0 40.0 6.4 19.6 25.4 29.8
1980 1986
71.2 101.3 68.3 103.6 82.6 99.9 39.1 123.0 56.2 108.8 63.3 102.7 56.1 103.8 52.5 105.8 70.3 100.3 81.8 100.2 35.2 111.7 70.7 103.4 65.3 103.5 66.7 102.3 1987 102.9 107.8 100.1 143.2 114.5 105.9 107.1 110.9 100.2 99.8 122.2 107.7 106.9 104.7 1988 104.1 112.7 101.4 162.5 120.0 108.7 109.4 116.5 101.7 100.6 133.9 113.0 110.7 107.6 1989 107.3 118.1 104.2 184.9 128.2 112.7 113.9 123.7 105.1 101.7 150.8 121.8 116.4 111.9 1990 111.0 121.2 107.0 222.6 136.8 116.3 117.6 131.8 109.0 104.3 ί 70.9 133.3 123.0 116.9
1991 1991
10 114.6 115.6 124.1 125.1 110.7 112.0 264.7 279.8 145.0 148.1 120.0 121.1 121.3 122.2 140.2 142.3 112.4 113.4 108.4 110.5 189.5 193.3 141.1 142.8 129.1 130.9 122.4 124.8 11 115.9 125.7 112.5 284.6 148.3 121.5 122.9 143.3 114.0 110.7 194.3 143.3 131.4 125.2 12 115.7 125.3 112.6 289.1 148.4 121.6 122.9 143.7 114.1 110.6 195.5 143.5 131.6 125.3 1992 01 116.0 125.1 113.1 290.4 150.6 121.9 122.9 144.8 114.5 110.3 197.3 143.3 132.2 125.6 02 116.4 125.7 113.8 291.2 151.6 122.2 124.0 145.2 114.5 110.7 199.9 144.1 132.8 126.1 03 116.4 126.2 114.2 297.1 152.2 122.5 124.0 145.8 115.0 111.4 201.7 144.5 132.2 126.4 04 116.5 126.4 114.5 301.6 152.1 122.8 124.0 146.0 115.1 111.9 205.0 146.7 133.9 126.4
Annual rate of Increase (%)
Β DK D ELL E F IRL I L NL Ρ UK EUR 12 ERM EUR 12 ERM EUR 12 ERM 61-70 3.0 6.0 2.7 2.1 6.1 4.1 4.8 4.0 2.6 4.2 4.5 4.1 3.7 3.3 0.8 0.7 1.7 1.2
71-80 1986
7.4 1.3 9.8 3.6 5.1 -0.2 14.5 23.1 15.4 8.8 9.7 2.7 13.7 3.8 14.1 5.8 6.7 0.3 7.4 0.3 18.7 11.7 13.8 3.4 9.9 3.2 8.4 2.2 3.5 2.8 3.0 1.8 4.8 3.9 3.3 2.5 1987 1.6 4.0 0.2 16.1 5.3 3.1 3.1 4.8 -0.1 -0.2 9.4 4.1 3.4 2.4 1.9 1.8 3.8 2.8 1988 1.2 4.6 1.2 13.5 4.8 2.7 2.1 5.1 1.4 0.9 9.6 4.9 3.6 2.7 1.8 1.4 Disr. 2.8 1.9 1989 3.1 4.8 2.8 13.8 6.8 3.7 4.1 6.2 3.3 1.1 12.6 7.8 5.1 4.0 Avéra 2.2 1.4 larity be 4.1 2.9 1990 3.4 2.6 2.7 20.4 6.7 3.2 3.2 6.5 3.7 2.5 13.3 9.4 5.7 4.5 gè devi; 2.7 1.8 ween th 3.5 2.3
1991 1991
10
3.2 2.2
2.4 1.8
3.5 3.5
18.9 17.6
6.0 5.5
3.2 2.5
3.1 3.6
6.4 6.0
0.1 2.4
3.9 4.5
10.9 9.2
5.9 3.7
5.0 4.3
4.7 4.0
ìtion around the mea
1.8 1.5
1.4 1.1
e average and the η
2.7 2.5
2.3 2.2
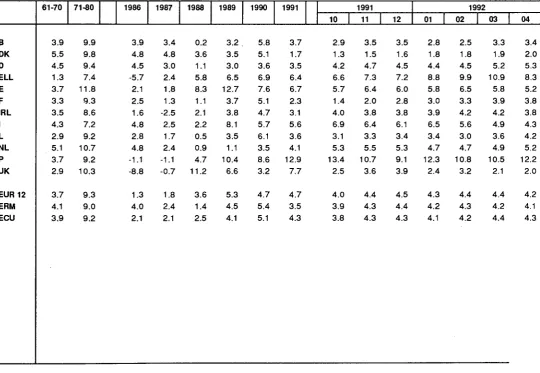
TABLE VI
CONSUMER PRICE INDICES IN ECU
1985=100 Β DK D ELL E F IRL I L NL Ρ UK EUR 12 ERM ECU 1970 30.9 28.0 30.0 34.9 24.5 30.3 25.9 32.2 32.5 27.1 28.3 27.1 29.5 30.3 29.9
1980 1986
78.7 103.9 70.0 104.7 72.9 104.5 68.6 93.1 72.7 102.0 73.1 102.4 58.5 101.1 63.8 104.7 77.7 102.8 74.4 104.8 65.8 98.8 69.7 91.0 70.9 101.3 71.3 104.0 71.7 102.1 1987 107.3 109.7 107.6 95.3 103.9 103.8 98.5 107.2 104.6 107.3 97.7 90.0 103.1 106.5 104.3 1988 107.6 113.7 108.8 100.9 112.5 105.0 100.6 109.6 105.2 108.2 102.3 100.2 106.8 108.0 106.9 1989 111.1 117.7 112.1 107.5 126.8 108.8 104.4 118.5 108.8 109.4 112.9 106.6 112.5 112.9 111.3 1990 117.5 123.7 116.1 114.9 136.4 114.3 109.3 125.2 115.4 113.2 122.6 110.0 117.8 119.0 117.0
1991 1991
10 121.9 123.2 125.8 126.9 120.2 121.7 122.2 127.5 145.5 147.8 116.9 117.9 112.7 114.3 132.2 134.4 119.6 120.8 117.8 120.3 138.4 143.4 118.5 119.6 123.3 124.9 123.2 124.7 122.0 123.6 11 123.8 127.1 122.7 128.1 148.1 118.3 114.7 134.7 121.8 120.8 142.9 119.2 125.3 125.1 124.0 12 123.9 126.8 123.1 128.8 147.2 118.7 114.9 134.8 122.1 121.0 141.6 118.4 125.3 125.1 124.1 1992 01 124.0 126.7 123.4 128.4 150.3 119.1 114.7 136.2 122.4 120.6 145.1 118.2 125.9 125.7 124.5 02 124.2 127.2 123.9 128.3 152.2 119.3 115.4 136.5 122.2 120.8 147.6 119.4 126.5 126.3 125.1 03 124.3 127.6 124.4 130.8 152.2 120.0 115.8 137.0 122.8 121.6 148.9 119.2 126.9 126.7 125.5 04 124.2 127.7 124.5 131.1 152.1 120.5 115.4 136.9 122.7 121.9 152.2 122.1 127.6 127.4 126.5
Annual rate of increase (%)
Β DK D ELL E F IRL I L NL Ρ UK EUR 12 ERM ECU 61-70 3.9 5.5 4.5 1.3 3.7 3.3 3.5 4.3 2.9 5.1 3.7 2.9 3.7 4.1 3.9
71-80 1986
9.9 3.9 9.8 4.8 9.4 4.5 7.4 -5.7 11.8 2.1 9.3 2.5 8.6 1.6 7.2 4.8 9.2 2.8 10.7 4.8 9.2 -1.1 10.3 -8.8 9.3 1.3 9.0 4.0 9.2 2.1 1987 3.4 4.8 3.0 2.4 1.8 1.3 -2.5 2.5 1.7 2.4 -1.1 -0.7 1.8 2.4 2.1 1988 0.2 3.6 1.1 5.8 8.3 1.1 2.1 2.2 0.5 0.9 4.7 11.2 3.6 1.4 2.5 1989 3.2 3.5 3.0 6.5 12.7 3.7 3.8 8.1 3.5 1.1 10.4 6.6 5.3 4.5 4.1 1990 5.8 5.1 3.6 6.9 7.6 5.1 4.7 5.7 6.1 3.5 8.6 3.2 4.7 5.4 5.1
1991 1991
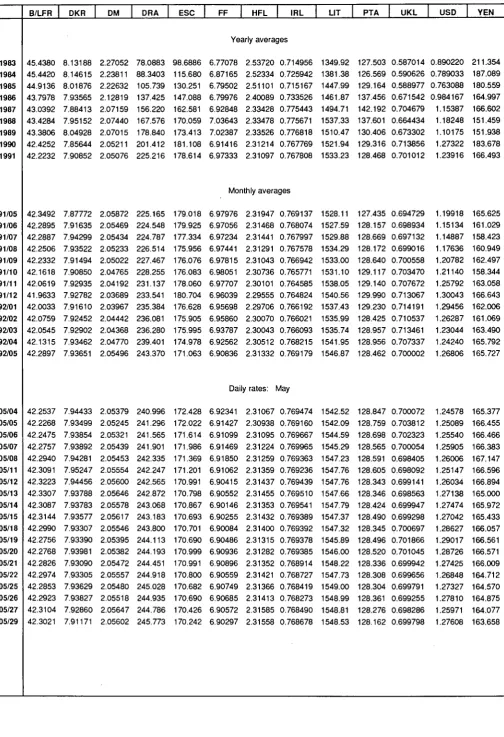
TABLE VII
ECU EXCHANGE RATES
1983 1984 1985 1986 1987 1988 1989 1990 1991 91/05 91/06 91/07 91/08 91/09 91/10 91/11 91/12 92/01 92/02 92/03 92/04 92/05 05/04 05/05 05/06 05/07 05/08 05/11 05/12 05/13 05/14 05/15 05/18 05/19 05/20 05/21 05/22 05/25 05/26 05/27 05/29 B/LFR 45.4380 45.4420 44.9136 43.7978 43.0392 43.4284 43.3806 42.4252 42.2232 42.3492 42.2895 42.2887 42.2506 42.2332 42.1618 42.0619 41.9633 42.0033 42.0759 42.0545 42.1315 42.2897 42.2537 42.2268 42.2475 42.2757 42.2940 42.3091 42.3223 42.3307 42.3087 42.3144 42.2990 42.2756 42.2768 42.2826 42.2974 42.2853 42.2923 42.3104 42.3021 DKR 8.13188 8.14615 8.01876 7.93565 7.88413 7.95152 8.04928 7.85644 7.90852 7.87772 7.91635 7.94299 7.93522 7.91494 7.90850 7.92935 7.92782 7.91610 7.92452 7.92902 7.93462 7.93651 7.94433 7.93499 7.93854 7.93892 7.94281 7.95247 7.94456 7.93788 7.93783 7.93577 7.93307 7.93390 7.93981 7.93090 7.93305 7.93629 7.93827 7.92860 7.91171 DM 2.27052 2.23811 2.22632 2.12819 2.07159 2.07440 2.07015 2.05211 2.05076 2.05872 2.05469 2.05434 2.05233 2.05022 2.04765 2.04192 2.03689 2.03967 2.04442 2.04368 2.04770 2.05496 2.05379 2.05245 2.05321 2.05439 2.05453 2.05554 2.05600 2.05646 2.05578 2.05617 2.05546 2.05395 2.05382 2.05472 2.05557 2.05480 2.05518 2.05647 2.05602 DRA 78.0883 88.3403 105.739 137.425 156.220 167.576 178.840 201.412 225.216 225.165 224.548 224.787 226.514 227.467 228.255 231.137 233.541 235.384 236.081 236.280 239.401 243.370 240.996 241.296 241.565 241.901 242.335 242.247 242.565 242.872 243.068 243.183 243.800 244.113 244.193 244.451 244.918 245.028 244.935 244.786 245.773 ESC 98.6886 115.680 130.251 147.088 162.581 170.059 173.413 181.108 178.614 179.018 179.925 177.334 175.956 176.076 176.083 178.060 180.704 176.628 175.905 175.995 174.978 171.063 172.428 172.022 171.614 171.986 171.369 171.201 170.991 170.798 170.867 170.693 170.701 170.690 170.999 170.991 170.800 170.682 170.690 170.426 170.242
FF HFL IRL
Yearly averages 6.77078 6.87165 6.79502 6.79976 6.92848 7.03643 7.02387 6.91416 6.97333 2.53720 2.52334 2.51101 2.40089 2.33428 2.33478 2.33526 2.31214 2.31097 0.714956 0.725942 0.715167 0.733526 0.775443 0.775671 0.776818 0.767769 0.767808 Monthly averages 6.97976 6.97056 6.97234 6.97441 6.97815 6.98051 6.97707 6.96039 6.95698 6.95860 6.93787 6.92562 6.90836 2.31947 2.31468 2.31441 2.31291 2.31043 2.30736 2.30101 2.29555 2.29706 2.30070 2.30043 2.30512 2.31332 0.769137 0.768074 0.767997 0.767578 0.766942 0.765771 0.764585 0.764824 0.766192 0.766021 0.766093 0.768215 0.769179
Daily rates: May
EXPLANATORY NOTES
Bilateral currency deviation (graph on page 3).
The various curves should be compared in pairs. To find the differential between two currencies, subtract the (positive or negative) values along the y-axis corresponding to each currency.
The graph is drawn with the curve of the strongest currency above that of the weakest. It shows therefore the relative position of each currency vis-à-vis the other currencies.
When two curves intersect or merge over a period of time there is no differential between the two currencies and their market exchange rate equals their bilateral central rate.
The graph is drawn within a horizontal band corresponding to the maximum 2,25% margin of fluctuation applying at any given moment to market exchange rates and the bilateral central rates of the ERM currencies, with the exception of the peseta, Sterling and escudo, currencies which have a maximum authorized fluctuation of 6%. This band is divided symmetrically by a horizontal axis along which the points would be plotted if all currencies were at their bilateral central rate and there were therefore no fluctuations.
The daily market exchange rates of all currencies are compared with the relevant bilateral central rates and the differentials between the two calculated.
The maximum fluctuation between two currencies (with the exception of the peseta, Sterling and escudo) is shown within the band, symmetrical with the horizontal axis. The fluctuations of the other currencies in relation to either of the two currencies in question are shown within the maximum permissible fluctuation. The curves are drawn by linking the daily points showing the relative positions of each currency.
Exchange rate grid (Table I).
The intervention limit rates fixed in the official grid do not always correspond exactly to + or - 2.25% (+ or - 6% for the peseta, Sterling and escudo) of the central rates, since for each currency pair (whose exchange rates are inversely proportional to one another) the lower limit of the one corresponds to the upper limit of the other.
Ecu bond issues (Table II & IV).
In table II, issues are recorded as at the payment date. This bulletin only covers international and foreign issues in ecus, including ecu issues offering the option of conversion into other currencies. Main source: International Financing Review
Table II shows, under the headings:
-Business sector and Governments: national issuers, both private and public.
-Institutions: the European Investment Bank and the Commission of the European Communities (EEC, ECSC, Euratom).
-Organizations: the specialist institutions of the United Nations, the World Bank, the Council of Europe, etc
Table IV shows detailled information of the latest known issues, whatever the payment date.
Interest rates and yields on ecu investments (Table III).
The interest rates for 1, 3 and 6 month and 1 year deposits are calculated on the basis of the Friday London market rates (source: Financial Times, London Money Rates, ECU Linked Deposit Bid).
The bonds are classified according to three types of maturities: under 5 years, from 5 to 7 years and more than 7 years. The redemption yields of ecu bonds are calculated each Wednesday from a sample of fixed interest bonds, denominated in ecus and listed on the Luxembourg Stock Exchange. These yields are weighted by the amounts in circulation, (source: Luxembourg Stock Exchange).
The monthly and yearly averages are the arithmetic means of these weekly interest rates and bond yields.
Operations rates of the EMCF (Table III).
The interest rate for transactions in EMCF (European Monetary Cooperation Fund) ecus, is the weighted average of the most representative rates on the domestic money market of the countries whose currencies make up the ecu basket. It is based on the weighting of the currencies in the ecu basket as derived from the ecu central rates in force. The rate thus calculated for a given month applies to EMCF transactions for the following month. In table 3, this rate relates to the month upon which the calculations are based and not to the (following) month during which it is used by the EMCF.
Consumer price indices in national currency (Table V).
The consumer price indices in the national currency of each country measure changes in the purchasing power of one unit of national currency spent in the country concerned.
Two composite indices are calculated, covering all the Member States of the Community (EUR 12) and the eleven Member States with currencies participating in the European Monetary System exchange rate mechanism (ERM). (Although the peseta has been participating in the exchange rate mechanism since 19/06/89 and has been included in the calculation of the ecu since 21/09/89, it is only taken into account in the indices relating to the ERM which are included in this bulletin for data after 30/09/89.)
These indices are calculated as weighted arithmetic means (chain indices) of the national indices, the weighting for each Member State being its relative share in the final consumption of households of the group of countries in question (EUR 12, ERM), expressed in purchasing power standards, at current prices and purchasing power parities.
Consumer price indices in ecus (Table VI).
For each country the index of consumer prices in ecus is calculated by dividing the national consumer price index by the average movement of the national currency in relation to the ecu during the month. It measures the change in the purchasing power of one ecu in the country concerned.
Three composite indices are calculated, covering all the Member States of the Community (EUR 12 and ECU), the 11 Member States participating in the European Monetary System exchange rate mechanism (ERM). (Although the peseta has been participating in the exchange rate mechanism since 19/06/89 and has been included in the calculation of the ecu since 21/09/89, it is only taken into account in the indices relating to the ERM which are included in this bulletin for data after 30/09/89.)
These three indices are calculated as weighted arithmetic means (chain-indices). The weightings are defined as follows: for the EUR 12 and ERM indices, the relative share of each Member State in the final consumption of households for the group of countries in question (EUR 12 or ERM), expressed in ecus at current prices and exchange rates (annual weighting). For the ecu index, the relative share of each Member State's currency in the calculation of the ecu (monthly weighting).
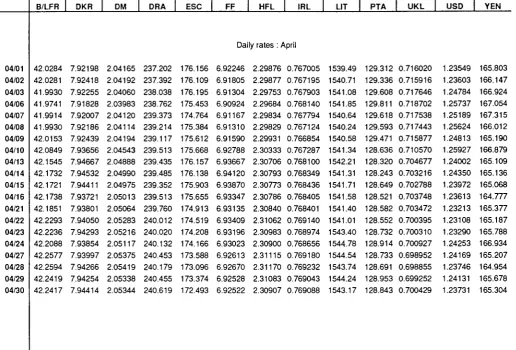
The exchange rates for the ecu against the national currencies of the Member States of the Community, the USD and yen are shown as annual averages, monthly averages (for the current year), and daily rates (for the latest available month).
Ecu exchange rates (Table VII).
1 ecu = Σ
100= Σ
BFR DKR DM DRA* ESC FF HFL IRL LFR LIT PTA
From 21/09/89 the ecu basket has been made up made as follows :
3.301 0.1976 0.6242 1.44 1.393 1.332 0.2198 0.008552 0.13 151.8 6.885
Ecu central rates from 08/10/90
42.4032 7.84195 2.05586 205.311 178.735 6.89509 2.31643 0.767417 42.4032 1538.24 133.631
Weights of currencies on 08/10/90, calculated on the basis of current central rates, expressed in %:
7.78 2.52 30.36 0.70 0.78 19.32 9.49 1.11 0.31 9.87 5.15
UKL
0.08784
0.696904
12.60
' does not participate in the exchange rate mechanism
Venta y suscripciones · Salg og abonnement · Verkauf und Abonnement · Πωλήσεις και συνδρομές
Sales and subscriptions · Vente et abonnements · Vendita e abbonamenti
Verkoop en abonnementen · Venda e assinaturas
BELGIQUE / BELGIË FRANCE UNITED K I N G D O M YUGOSLAVIA
Moniteur belge / Belgisch Staatsblad
Rue de Louvain 42 / Leuvenseweg 42 1000 Bruxelles / 1000 Brussel Tél. ( 0 2 ) 5 1 2 00 26
Fax 511 01 84
C C P / Postrekening 0 0 0 - 2 0 0 5 5 0 2 - 2 7 Autres distributeurs /
Overige v e r k o o p p u n t e n
Librairie e u r o p é e n n e / Europese Boekhandel
A v e n u e Albert Jonnart 50 / Albert Jonnartlaan 50 1200 Bruxelles / 1200 Brussel Tél. (02) 734 02 81
Fax 735 08 60
J e a n D e Lannoy
Avenue d u Roi 202 / K o n i n g s l a a n 202 1060 B r u x e l l e s / 1060 Brussel Tél. (02) 538 51 69
Télex 63220 U N B O O K Β Fax (02) 538 08 41
C R E D O C
Rue de la M o n t a g n e 34 / Bergstraat 34 Bte 11 / Bus 11
1000 Bruxelles / 1000 Brussel D A N M A R K
J . H. Schultz Information A / S EFPublikationer
Ottiliavej 18 2 5 0 0 Valby Tlf. 36 44 22 66 Fax 36 44 01 41 Girokonto 6 00 08 86 BR DEUTSCHLAND
Bundesanzeiger Verlag
Breite Straße Postfach 10 80 06 5000 Köln 1 Tel. (02 2 1 ) 2 0 29-0
Telex ANZEIGER B O N N 8 882 595 Fax 20 29 278
GREECE
G.C. Eleftheroudakis SA
International Bookstore Nikis Street 4 10563 Athens Tel. (01) 322 63 23 Telex 219410 ELEF Fax 323 98 21 ESPANA
Boletin Oficial del Estado
Trafalgar. 27 28010 M a d r i d Tel. (91) 44 82 135
M u n d i P r e n s a Libros, S A
Castellò. 37 28001 Madrid
Tel. (91) 431 33 99 (Libros) 431 32 22 (Suscripciones) 435 36 37 (Dirección) Télex 4 9 3 7 0 - M P L I - E Fax (91) 575 39 98 Sucursal:
Librería Internacional A E D O S
Consejo d e Ciento, 391 08009 Barcelona Tel. (93) 301 86 15 Fax (93) 317 01 41
Llibreria d i la Generalität d e Catalunya
Rambla dels Estudis, 118 (Palau Moja) 08002 Barcelona
Tel. (93) 302 68 35 302 64 62 Fax (93) 302 12 99
Journal officiel Service des publications d e s C o m m u n a u t é s européennes
26, rue Desaíx 75727 Paris Cedex 15 Tél. (1) 40 58 75 00 Fax (1) 40 58 75 74 IRELAND
EEC Section
6th floor Bishop Street Dublin 8 Tel. (1) 78 16 66 Fax (1) 78 06 45 ITALIA L i c o s a Spa
Via Benedetto Fortini, 120/10 Casella postale 552 50125 Firenze
Tel. (055) 64 54 15
Fax 64 12 57 Telex 570466 LICOSA I C C P 343 509 Subagenti:
Libreria scientifica Lucio d e Biasio A E I O U
Via Meravigli. 16 20123 Milano Tel. (02) 80 76 79
Herder Editrice e Libreria
Piazza Montecitorio, 117-120 00186 R o m a
Tel. (06) 679 46 2 8 / 6 7 9 53 04
Libreria giuridica
Via XII Ottobre, 172/R 16121 Genova Tel. (010) 59 56 93
G R A N D - D U C H É DE L U X E M B O U R G
M e s s a g e r i e s Paul Kraus
1 1 , rue Christophe Plantin 2339 L u x e m b o u r g
Tél. 499 88 88
Télex 2515 Fax 499 88 84 44 C C P 4 9 2 4 2 - 6 3
NEDERLAND
S D U Overheidsinformatie
Externe Fondsen Postbus 20014 2500 EA 's-Gravenhage Tel. (070) 37 89 911 Fax (070) 34 75 778 PORTUGAL
Imprensa Nacional
Casa da M o e d a , EP
Rua D. Francisco Manuel de Melo, 5 1092 Lisboa C o d e x
Tel. (01) 69 34 14
Distribuidora d e Livros Bertrand, Ld." Grupo Bertrand, SA
Rua das Terras d o s Vales, 4-A A p a r t a d o 37
2700 A m a d o r a C o d e x Tel. (01) 49 59 050 Telex 15798 BERDIS Fax 49 60 255
H M S O Books (PC 16)
H M S O Publications Centre 51 Nine Elms Lane L o n d o n SW8 5DR Tel. (071) 873 2 0 0 0 Fax GP3 873 8463 Telex 29 71 138
G o v e r n m e n t Publications Sales Office
Sun Alliance House M o l e s w o r t h Street Dublin 2 Tel. (1) 71 03 09 or by post
G o v e r n m e n t Stationery Office
ÖSTERREICH
M a n z ' s c h e V e r l a g s
und Universitätsbuchhandlung
Kohlmarkt 16 1014 Wien Tel. (0222) 531 61-0 Telex 11 25 00 BOX A Fax (0222) 531 61-81 S U O M I
A k a t e e m i n e n Kirjakauppa
Keskuskatu 1 PO Box 128 00101 Helsinki Tel. (0) 121 41 Fax (0) 121 44 41
Narvesen information center
Bertrand Narvesens vei 2 PO Box 6125 Etterstad 0602 Oslo 6
Tel. (2) 57 33 00 Telex 79668 NIC N Fax (2) 68 19 01 SVERIGE B T J Box 200 22100 Lund Tel. (046) 18 00 00 Fax (046) 18 01 25
SCHWEIZ / SUISSE / SVIZZERA
O S E C
S t a m p f e n b a c h s t r a ß e 85 8035 Zürich
Tel. (01) 365 54 49 Fax (01) 365 54 11 C E S K O S L O V E N S K O
NIS
Havelkova 22 13000 Praha 3 Tel. (02) 235 84 46 Fax 4 2 - 2 - 2 6 4 7 7 5 M A G Y A R O R S Z A G
Agroinform
Budapest I. Kir. Attila ut 93 1012 Budapest Tel. (1) 56 82 11
Telex (22) 4 7 1 7 AGINF H-61 POLAND
Business Foundation
ul. Krucza 38/42 00-512 W a r s z a w a
Tel. (22) 21 99 93, 6 2 8 - 2 8 - 8 2 International Fax&Phone
(0-39) 12-00-77
Privredni Vjesnik
Bulevar Lenjina 171/XIV 11070 Beograd Tel. (11) 123 23 40 CYPRUS
Cyprus C h a m b e r of C o m m e r c e and Industry
C h a m b e r Building 38 Grivas Dhigenis Ave 3 Deligiorgis Street PO Box 1455 Nicosia
Tel. (2) 449500/462312 Fax (2) 458630 TURKIYE
Pres G a z e t e Kitap Dorgi
Pazarlama Dagitim Ticaret ve sanayi AS
Narlibahçe Sokak N. 15 Istanbul-Cagaloglu
Tel. (1) 520 92 96 - 528 55 66
Fax 520 64 57 Telex 23822 DSVO-TR AUTRES PAYS OTHER COUNTRIES ANDERE LÄNDER
Office des publications officielles des C o m m u n a u t é s européennes
2. rue Mercier 2985 L u x e m b o u r g Tél. 49 92 81
Télex P U B O F LU 1324 b Fax 48 85 73
CC bancaire BIL 8 - 1 0 9 / 6 0 0 3 / 7 0 0 CANADA
Ronouf Publishing Co. Ltd
Mail orders — Head Office: 1294 A l g o m a Road Ottawa, Ontario K1B 3W8 Tel. (613) 741 43 33 Fax (613) 741 54 39 Telex 0534783 O t t a w a Store: 61 Sparks Street Tel. (613) 238 89 85 Toronto Store: 211 Yonge Street Tel. (416) 363 31 71
UNITED STATES OF AMERICA
U N I P U B
4611 -F Assembly Drive L a n h a m . M D 20706-4391 Tel. Toll Free (800) 274 4888 Fax (301) 459 0 0 5 6 AUSTRALIA
Hunter Publications
58A Gipps Street C o l l i n g w o o d Victoria 3066 J A P A N
Kinokuniya C o m p a n y Ltd
17-7 Shinjuku 3 - C h o m e Shinjuku-ku
Tokyo 160-91
Tel. (03) 3439-0121
Journal D e p a r t m e n t
PO Box 55 Chitóse
TABLE VII
ECU EXCHANGE RATES
04/01 04/02 04/03 04/06 04/07 04/08 04/09 04/10 04/13 04/14 04/15 04/16 04/21 04/22 04/23 04/24 04/27 04/28 04/29 04/30
B/LFR
42.0284 42.0281 41.9930 41.9741 41.9914 41.9930 42.0153 42.0849 42.1545 42.1732 42.1721 42.1738 42.1851 42.2293 42.2236 42.2088 42.2577 42.2594 42.2419 42.2417
DKR
7.92198 7.92418 7.92255 7.91828 7.92007 7.92186 7.92439 7.93656 7.94667 7.94532 7.94411 7.93721 7.93801 7.94050 7.94293 7.93854 7.93997 7.94266 7.94254 7.94414
DM
2.04165 2.04192 2.04060 2.03983 2.04120 2.04114 2.04194 2.04543 2.04888 2.04990 2.04975 2.05013 2.05064 2.05283 2.05216 2.05117 2.05375 2.05419 2.05338 2.05344
DRA
237.202 237.392 238.038 238.762 239.373 239.214 239.117 239.513 239.435 239.485 239.352 239.513 239.760 240.012 240.020 240.132 240.453 240.179 240.455 240.619
ESC
176.156 176.109 176.195 175.453 174.764 175.384 175.612 175.668 176.157 176.138 175.903 175.655 174.913 174.519 174.208 174.166 173.588 173.096 173.374 172.493
FF HFL IRL
Daily rates : April
6.92246 6.91805 6.91304 6.90924 6.91167 6.91310 6.91590 6.92788 6.93667 6.94120 6.93870 6.93347 6.93135 6.93409 6.93196 6.93023 6.92613 6.92670 6.92528 6.92522
2.29876 2.29877 2.29753 2.29684 2.29834 2.29829 2.29931 2.30333 2.30706 2.30793 2.30773 2.30786 2.30840 2.31062 2.30983 2.30900 2.31115 2.31170 2.31083 2.30907
0.767005 0.767195 0.767903 0.768140 0.767794 0.767124 0.766854 0.767287 0.768100 0.768349 0.768436 0.768405 0.768401 0.769140 0.768974 0.768656 0.769180 0.769232 0.769043 0.769088
LIT
1539.49 1540.71 1541.08 1541.85 1540.64 1540.24 1540.58 1541.34 1542.21 1541.31 1541.71 1541.58 1541.40 1541.01 1543.40 1544.78 1544.54 1543.74 1544.24 1543.17
PTA
129.312 129.336 129.608 129.811 129.618 129.593 129.471 128.636 128.320 128.243 128.649 128.521 128.582 128.552 128.732 128.914 128.733 128.691 128.953 128.843
UKL
0.716020 0.715916 0.717646 0.718702 0.717538 0.717443 0.715877 0.710570 0.704677 0.703216 0.702788 0.703748 0.703472 0.700395 0.700310 0.700927 0.698952 0.698855 0.699252 0.700429
USD
1.23549 1.23603 1.24784 1.25737 1.25189 1.25624 1.24813 1.25927 1.24002 1.24350 1.23972 1.23613 1.23213 1.23108 1.23290 1.24253 1.24169 1.23746 1.24131 1.23731
YEN
165.803 166.147 166.924 167.054 167.315 166.012 165.190 166.879 165.109 165.136 165.068 164.777 165.377 165.187 165.788 166.934 165.207 164.954 165.678 165.304
Price (excl. VAT) in Luxembourg: Single copy ECU 9 · Subscription ECU 67
.<*>.
OFICINA DE PUBLICACIONES OFICIALES DE LAS COMUNIDADES EUROPEAS KONTORET FOR DE EUROPÆISKE FÆLLESSKABERS OFFICIELLE PUBLIKATIONER AMT FÜR AMTLICHE VERÖFFENTLICHUNGEN DER EUROPAISCHEN GEMEINSCHAFTEN ΥΠΗΡΕΣΙΑ ΕΠΙΣΗΜΩΝ ΕΚΔΟΣΕΩΝ ΤΩΝ ΕΥΡΩΠΑΪΚΩΝ ΚΟΙΝΟΤΗΤΩΝ
OFFICE FOR OFFICIAL PUBLICATIONS OF THE EUROPEAN COMMUNITIES OFFICE DES PUBLICATIONS OFFICIELLES DES COMMUNAUTÉS EUROPÉENNES UFFICIO DELLE PUBBLICAZIONI UFFICIALI DELLE COMUNITÀ EUROPEE BUREAU VOOR OFFICIËLE PUBLIKATIES DER EUROPESE GEMEENSCHAPPEN SERVIÇO DAS PUBLICAÇÕES OFICIAIS DAS COMUNIDADES EUROPEIAS
L 2 9 8 5 Luxembourg