http://eprints.whiterose.ac.uk/121325/ Version: Accepted Version
Article:
Fulchini, F, Zafar, U, Hare, C et al. (4 more authors) (2017) Relationship between Surface Area Coverage of Flow-Aids and Flowability of Cohesive Particles. Powder Technology, 322. pp. 417-427. ISSN 0032-5910
https://doi.org/10.1016/j.powtec.2017.09.013
© 2017 Published by Elsevier B.V. This manuscript version is made available under the CC-BY-NC-ND 4.0 license http://creativecommons.org/licenses/by-nc-nd/4.0/
[email protected] https://eprints.whiterose.ac.uk/
Reuse
Items deposited in White Rose Research Online are protected by copyright, with all rights reserved unless indicated otherwise. They may be downloaded and/or printed for private study, or other acts as permitted by national copyright laws. The publisher or other rights holders may allow further reproduction and re-use of the full text version. This is indicated by the licence information on the White Rose Research Online record for the item.
Takedown
If you consider content in White Rose Research Online to be in breach of UK law, please notify us by
Fabio Fulchini, Umair Zafar, Colin Hare, Mojtaba Ghadiri, Hossam Tantawy, Hossein Ahmadian, Massimo Poletto
PII: S0032-5910(17)30738-6
DOI: doi:10.1016/j.powtec.2017.09.013
Reference: PTEC 12818 To appear in: Powder Technology
Received date: 23 February 2017 Revised date: 8 August 2017 Accepted date: 6 September 2017
Please cite this article as: Fabio Fulchini, Umair Zafar, Colin Hare, Mojtaba Ghadiri, Hossam Tantawy, Hossein Ahmadian, Massimo Poletto, Relationship between surface area coverage of flow-aids and flowability of cohesive particles,Powder Technology(2017), doi:10.1016/j.powtec.2017.09.013
ACCEPTED MANUSCRIPT
Relationship between Surface Area Coverage of Flow-Aids
and Flowability of Cohesive Particles
Fabio Fulchini1,3, Umair Zafar1, Colin Hare1§, Mojtaba Ghadiri1*,Hossam Tantawy2, Hossein
Ahmadian2, and Massimo Poletto3
1Institute of Particle Science and Engineering, School of Chemical and Process Engineering, University of Leeds,
Leeds LS2 9JT, UK
2Procter and Gamble, Newcastle Innovation Centre, Longbenton, Newcastle upon Tyne, NE12 9TS, UK 3Department of Industrial Engineering, University of Salerno
*Corresponding Author Tel: +44 (0) 113 343 2406 , Email: [email protected]
Abstract
Poor and inconsistent flow of cohesive powders is a major issue in powder
processing. A common solution is to coat the surfaces of the cohesive particles with
finer particles, referred to as flow-aids. Such particles adhere to sticky surfaces and
act as spacers preventing them from contacting each other and thus reducing the
inter-particle forces and bulk powder cohesion. A question which naturally arises is
how much flow-aid is needed to enhance the flowability to an optimum level. This
work aims to establish a relationship between the degree of Surface Area Coverage
(SAC) of flow-aids and the flowability, the latter as determined by a quasi-static
shear cell method, as well as the angle of repose test and the FT4 powder rheometer.
Glass beads of 90- m sieve cut are made cohesive by silanising their surfaces
with a commercial chemical reagent, Sigmacote® and are used as host particles. Two
types of zeolite particles are used as flow aids. The mass fraction of the flow aids
required to achieve a theoretical SAC of 1, 5, 10, 20, 50 and 100% is first estimated
and then the host particles are coated in a pan mixer. The SAC is measured by
Scanning Electron Microscopy, coupled with image analysis, and found to correlate
well with the estimated value. The optimum surface coverage is found to be when
SAC is 10-20%, as this provides the greatest flowability. An increase in SAC beyond
this range leads to a gradual reduction in flowability.
ACCEPTED MANUSCRIPT
(Keywords: cohesive, flowability, flow aids, processing, Surface are coverage,
ACCEPTED MANUSCRIPT
2
Nomenclature
GB glass Beads
SGB silanised Glass Beads
ZA Zeolite A
ZA-Ae Zeolite A coated with 0.25% of nano-particles of aerosil
D50 50th percentile of the cumulative particle size number distribution µm
SAC theoretical Surface Area Coverage -
actual
SAC
actual Surface Area Coverage -
mass fraction of flow aids -N number of guest particles on the surface of one host particle -
G
A
sphere-equivalent projected area of one guest particle m2H
S
sphere-equivalent surface area of one host particle m2H
host particle density kg/m3G
guest particle envelope density kg/m3H
V
sphere-equivalent volume of one host particle m3G
V
sphere-equivalent volume of one guest particle m3ffc flow function coefficient -
angle between the equatorial plane and the top of a sphere rad
Gi
A area covered by guest particles in the i-th annular region m2
ARi
A
area of a i-th annular region m2i
X
fraction of the i-th annular region covered by guest particles -Gi
ACCEPTED MANUSCRIPT
3
1.
Introduction
Flowability and inter-particle forces are closely related. If particles have a weight
much larger than the attractive inter-particle forces they may easily roll over one
another, and as a consequence, they pack tightly and also flow easily [1]. When this
is not the case, particles can attract each other, resulting in bulk cohesion, which is
generally undesirable as it causes poor flow and arching [2]. Controlled cohesion is
however desirable in instances such as mixing, as it mitigates the segregation [3],
and drug release in dry powder inhalers [4]. The smaller the size of the particles, the
stronger the inter particle interactions become, such as van der Waals, capillary and
electrostatic forces with respect to particle weight. Inter-particle forces depend on
the local radius of curvature at contact [5]. The strength of such forces can be
decreased by decreasing the local asperity radius, as irregularly-shaped fine particles
flow better than round particles [1]. For this reason particles are often coated with
hard very fine particles, called flow control additives, or flow aids, in order to
separate energetic surfaces and to decrease the local radius of curvature at contact,
thus reducing van der Waals interactions down to several orders of magnitude [5].
Inter-particle force reduction therefore results in improvement of bulk properties,
such as flowability, bulk density [6], and fluidisation behaviour [7]. In industry it has
become a common practice to coat the host particles with small and hard
nano-particles, referred to as guests as shown schematically in Figure 1.
Figure 1. Schematic illustration of the coating mechanism
Guest particles act as spacers among host particles, increasing the separation
distance and therefore reducing the intensity of van der Waals attraction between
host particles [8]. Van der Waals forces obviously also prevail in contacts between
host and guest particles, ensuring that guests remain on the surfaces of the host
ACCEPTED MANUSCRIPT
4 physical surface modifications, such as coating by fine particles, can lead to
improvements in flow properties and poured bulk density of powders. Of course,
understanding the effect of the surface area coverage of host particles by flow
additives on the flowability of the bulk is helpful to optimise the coating process. For
example, Conesa et al. [9] show that coating the surfaces of polyester-based particles
with a layer of silica nano-particles, at 0.3 wt%, leads to an optimum flowability.
They propose that for higher amounts of the guest particles, the host-guest contacts
are replaced with guest-guest contacts, and this change is responsible for the
decrease of the powder flowability. Castellanos [1] calculates this critical value of the
surface area coverage (SAC), assuming that both host and guest particles are
spherical and the latter is uniformly distributed on the surfaces of the former, where
the mass fraction of flow aids is defined as the ratio of mass of guest particles over
the mass of host particles. He shows that this transitional SAC value is independent
of size and density and is equal to ×100, which is roughly 20%. In an earlier
work, Chen et al. [10] showed that in order to have guest-guest particle contacts
whenever two coated particles come in contact, SAC should be between 20% and
100%. Yang et al. [11], using cornstarch powder of 15 µm mean diameter as host
particles and five types of nano-sized guest particles, demonstrate that the flow
improvement is not directly related to the mass of flow aids used, but rather to the
obtained SAC; different coating techniques give rise to different levels of SAC. They
use four different techniques including hand mixing, a Hybridizer (equipment
generating high impaction forces), a V-Blender and a Magnetic Assisted Impaction
Coating (MAIC) device. Using the MAIC technique, they obtained the best match of
theoretical and actual SAC, as well as the best flowability improvement. Jallo et al.
[12] coat different combinations of API powders, using nano-silica particles as flow
aids at 1 wt% by MAIC, resulting in different SAC values ranging between 46.2%
and 1068%, the latter implying either multilayer coating or loose flow-aids particles
in the interstices of the host particles. They obtain the best flow function coefficient
ACCEPTED MANUSCRIPT
5 monohydrate, of 20 µm median particle size, with nano-particles of magnesium
stearate (MgSt) powder by mechanofusion at 0.1, 0.5, 1, 2, 5 wt% loading. They find
major improvements in flowability as measured by the shear cell at 0.5 wt% of flow
aids or higher. They evaluate the surface coverage as the normalised Mg counts over
the total counts for all species by X-Ray photoelectron spectroscopy (XPS) and
Time-of-flight of the secondary ion mass spectrometry (Tof-SIMS). For the 0.5 wt% sample
the coverage was estimated to be 64.5%.
The addition of a known mass of flow aids does not necessarily gets fully dispersed
on the surfaces of the sticky particles. Therefore the aim of the present work is to
establish a direct relationship between SAC and flowability. For this purpose, glass
beads are made cohesive by a silanisation process and are used as host particles,
while two types of zeolite particles are used as guest particles. Coating is carried out
in a rotary pan coater. The theoretical SAC is defined as the percentage of surface
area of the host particles that is covered by the projected area of the guest particles.
SAC is varied from 1 to 100%. The coating uniformity is checked by Scanning
Electron Microscope (SEM) and the micro-graphs are used to calculate the actual
SAC by the image analysis method. The flowability of the samples is then evaluated
using three different techniques: Schulze annular shear cell, angle of repose and the
Freeman FT4 powder rheometer.
2.
Materials and Method
2.1.
Materials
The host particles are 90- m glass beads made cohesive by silanisation with
Sigmacote®. Two different flow aid particles are used, namely Zeolite A (ZA), as
shown in Figure 2, and Zeolite A coated with 0.25 wt% of nanoparticles of Aerosil
ACCEPTED MANUSCRIPT
6 equivalent circle diameter is measured for both guest and host particles by Malvern
Morphologi G3. The number distribution of particle size for all the materials is then
obtained. The 50th percentile of the cumulative distribution (D50) is reported in Table
1, as well as the particle shape and envelope density.
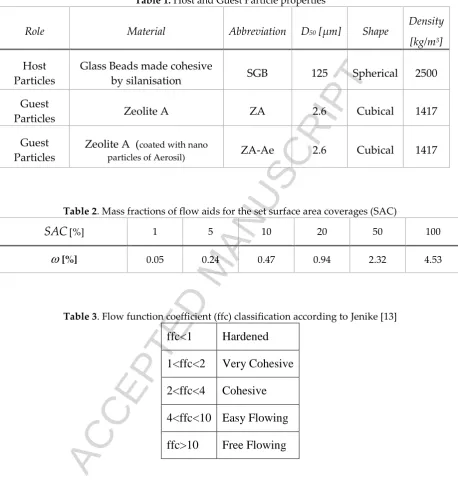
Table 1. Host and Guest Particle properties
Figure 2. Zeolite A particles
Bulk cohesion and density of the glass beads before and after silanisation and of the
flow aids themselves have been evaluated by a Schulze RST-XS shear cell, and are
reported in Figure 3.
Figure 3. Bulk density and cohesion as affected by silanisation of glass beads and coating of zeolite particles by Aerosil
The silanisation process has increased the bulk cohesion of the glass beads and, as a
direct consequence, bulk density is reduced. Both ZA and ZA-Ae present a very high
cohesiveness. It is also notable how the use of Aerosil nano-particles could reduce
the cohesion of ZA as well as increase its bulk density.
2.2.
Method
2.2.1. Calculation of the theoretical SAC
In order to obtain a surface area coverage of 1, 5, 10, 20, 50, 100%, the required
amount of flow aids is calculated according to eq. 1-3, making the assumptions: (i)
both host and guest particles are spherical and are sized equal to their D50; (ii) the
covered surface area of the host is equal to the total projected area of the guest
ACCEPTED MANUSCRIPT
7 particles; (iv) the host and guest particles are fully mixed and the host particles are
uniformly coated.
We define the mass fraction of guest particles,
, as the ratio of the mass of guestparticles on one host particle over the total mass of the host and guest particles:
100
G G
G G H H
N V
N V V
(1)
whereas N is the number of guest particles on the surface of one host particle,
H,H
V
,
G,V
Gare the particle density and volume of host and guest particles,respectively. This definition differs from that used by Castellanos [1], who used only
the mass of the host particle in the denominator. Nevertheless, the difference is
negligible as the mass of the guest particles constitutes a very small fraction of the
whole mass.
The SAC is defined as the degree of coverage of the host particle surface area by the
guest particles: G H NA SAC S
(2)
where
A
Gis the projected area of one guest particle andS
His the surface area of onehost particle. We use eq. 2 to get N and use the result in eq. 1, to get as a function
of SAC, eq. 3:
H G G 100
H G G G H H
S V SAC
S V SAC A V
(3)
The values of
calculated from eq. 3 for the host and guest particles consideredhere for 1, 5, 10, 20, 50 and 100% SAC are reported in Table 2. The mass percentages
for both ZA and ZA-Ae are the same as the presence of aerosil is not taken into
ACCEPTED MANUSCRIPT
8
Table 2. Mass fractions of flow aids for the set surface area coverages (SAC)
2.2.2. Coating Process
The coating process was performed using a pan mixer of 0.4 m diameter, inclined at
an angle of 45° with respect to the horizontal axes. Each sample of 150 g of host
particles is first added to the pan, then guest particles are manually added gradually
along 35 minutes at a constant rotational speed of 100 rpm.
2.3.
Image analysis and actual SAC
Coated particles are viewed by Scanning Electron Microscopy (SEM). The
micrographs are used to assess the quality of coating in terms of guest particle
dispersion on the surfaces of the host particles and also to calculate the actual SAC
achieved by image analysis using ImageJ. The SEM micrographs are converted to
binary images so that guest particles can be distinguished from the rest, as shown in
Figure 4.
Figure 4. Micrographs and image manipulation for SAC evaluation
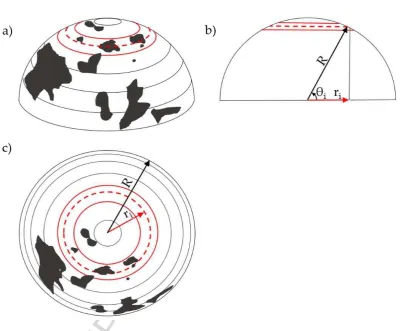
Due to the spherical shape of the host particles, the measured projected area should
be converted to the real area. The required correction increases as the diametral
plane is approached, as it is schematically represented in Figures 5a and 5c. The
projection correction is proportional to sin i where i is the angle between the
equatorial plane and the position on the surface as shown in Figure 5b. The top view
of the particle is divided into n annular concentric regions as shown in Figure
For each annular region its median radial distance from the centre, ri, is determined,
where i is the index of the annular region as indicated in Figure For every
annular region, the ratio between the number of black pixels over the total number
of pixels, Xi, as obtained from image analysis, is equal to the ratio of the two areas in
ACCEPTED MANUSCRIPT
9 = Gi i ARi A X A (4) GiA is then corrected accordingly due to its position on the hemisphere to give the
actual black area,
A
Gi:sin Gi Gi i A A (5)
It is noteworthy that at the very periphery of the surface the calculation of the
coverage could be overestimated due to the contribution given by the lateral area of
the guest particles (proportional to the thickness of the layer) to AGi, as shown in
Figure 7. To avoid this effect, although small, the analysis is limited to a smaller
portion of the particle so the SAC is defined according to eq. 7. In general, the very
peripheral area of the host particle is not considered, i.e. the last annular ring.
1
1 cos( ) 2 n Gi i actual H n A SAC S
(7)Figure 5. Schematic representation of a coated particle: a) 3D view of half coated particle; b) hemisphere section; c) top view of the hemisphere
Figure 6. Annular divisions of the particle top view
ACCEPTED MANUSCRIPT
10
2.4.
Flowability assessment
2.4.1. Shear Cell
Shear cell measurements are taken using a Schulze RST-XS ring shear tester
(Wolfenbüttel, Germany) at pre-consolidation loads of 3, 5 and 10 kPa to determine
the flow function coefficient (ffc). According to the classification of Jenike [14], the ffc
is defined as the ratio of the pre-consolidation major principal stress,
1, and theunconfined yield stress,
C. ffc describes the ease with which material flow isinitiated as shown in Table 3.
Table 3. Flow function coefficient (ffc) classification according to Jenike [13]
2.4.2. FT4
In the FT4 Powder Rheometer (Freeman Technology, Tewkesbury, UK), the flow
behaviour of bulk solids is evaluated by considering the total energy (work)
dissipated by a rotating impeller blade driven through a column of powder [15]. The
powder is first brought to a reproducible packing state by the impeller blade rotating
clockwise, descending and ascending through the bed, thereby cutting and lifting it
to establish a consistent and reproducible packing density. Following this stage, the
blade then moves downward, whilst rotating anticlockwise, thereby pressing down
and shearing the powder bed. The expended work is measured and termed the total
flow energy. The test procedure is such that the bed volume is kept constant, and
therefore if the packing density changes between tests, as is the case here due to the
addition of flow-aids, it is more appropriate to express the expended work per unit
bed mass. It is also possible to measure the expended work associated with the
blade whilst driven upwards through the bed and rotating anticlockwise, but this
mode was not addressed in this work. The experiments here were carried out using
ACCEPTED MANUSCRIPT
11
2.4.3. Angle of Repose (AoR)
The angle of repose is evaluated following the procedure and the equipment of
Geldart [16].
Table 4. Classification of the Angle of Repose (AoR) according to Carr [17] and Raymus [18]
3.
Results and Discussion
3.1.
SEM analysis and Actual Surface Area Coverage
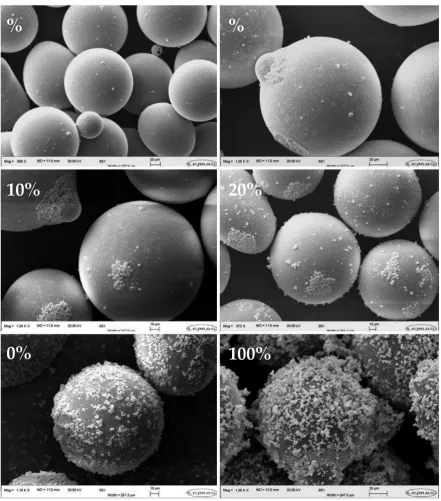
Figures 8 and 9 show SEM micrographs of silanised glass particles coated at
different degrees of SAC with ZA and ZA-Ae, respectively. Inspection of the figures
indicates that the guest particles are in general well dispersed on the surfaces of the
host particles. Given the higher cohesiveness of ZA than ZA-Ae, the formation of
little clusters of guest particles at high degrees of coverage is observed, especially at
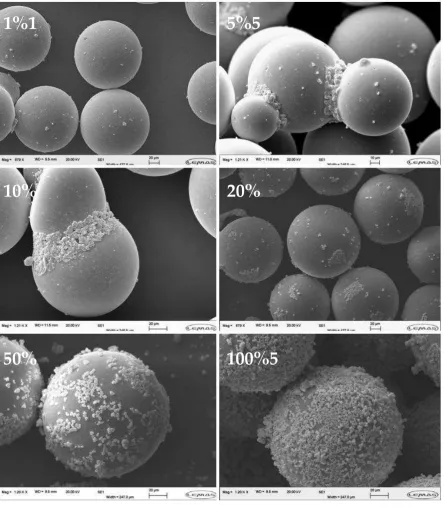
100% of SAC as shown in Figure 8. In contrast, in the case of ZA-Ae, the guest
particles seem to be much better dispersed on the host particle surface and to
individually contact the surface. This difference in dispersion would affect the
effectiveness of the flow aid to improve the powder flowability. Nevertheless, the
actual SAC measured according to eq. 7 corresponds well to the theoretical values,
as reported in Table 5. It is also interesting to note that for doublets, the guest
particles accumulate in the valleys, presumably due to less prevailing shear stresses
therein. It implies that for non-spherical host particles ridges are likely to be covered
with the guest particles first.
ACCEPTED MANUSCRIPT
[image:15.595.86.490.129.297.2]12
Figure 9. SEM micrographs of particles coated with ZA-Ae, from top left to bottom right: 1, 5, 10, 20, 50, 100% of SAC
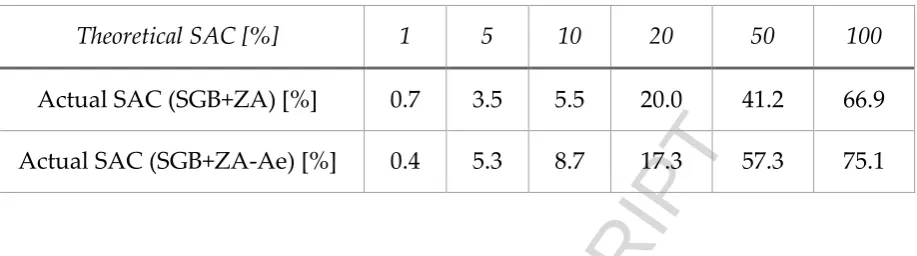
Table 5. Theoretical and actual SAC
3.2.
Flowability Measurements
3.2.1. Shear Cell
The flow function of silanised glass particle coated at different degrees of SAC with
ZA and ZA-Ae is obtained at three applied normal stress as shown in Figures 10 and
11, respectively. For silanised glass particles coated with ZA, Figure 10 indicates that
the flowability improves as the degree of coverage reaches around 20%, after which
it reduces to a value as low as SAC 0% (i.e. uncoated silanised glass beads) for SAC
50% and 100%. It is noteworthy that in the case of SAC of 50% or 100% the
application of 10 kPa pre-consolidation load results in less flowable material then the
uncoated silanised glass beads. The same behaviour is found for the silanised glass
beads coated with ZA-Ae, as shown in Figure 11.
Figure 10. ffc of SGB coated with ZA
Figure 11. ffc of SGB coated with ZA-Ae
It is clear from the shear cell results that the best flowability is obtained for an SAC
of 10-20%. A full coverage leads to poor flowability. A comparison of the extent of
improvement for the 20% of SAC and reduction for the 100% of SAC between the
ACCEPTED MANUSCRIPT
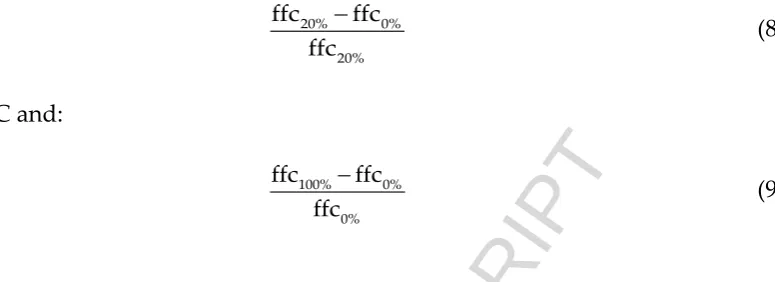
13 20% 0%
20%
ffc ffc
ffc
(8)
at 20% SAC and:
100% 0% 0%
ffc ffc
ffc
(9)
at 100% SAC. Of course, positive value correspond to an improvement of flowability,
while negative values to a worsening. ZA shows larger improvements in flowability
than ZA-Ae at 20% of SAC, and also less worsening in the case of full coverage. A
possible explanation of this difference can be related to the quality of dispersion
achieved in the coating processes, being less uniform for ZA. These particles are in
fact present in little clusters rather than individuals, in contrast to ZA-Ae as shown
in Figures 8 and 9. Consequently, the actual SAC of ZA is in fact further from the
theoretical value, Table 5, but the flowability is improved to a greater extent because
the little clusters act as bigger spacers compared to individual particles. A more
systematic study of the effect of the guest particle size is therefore of interest.
Table 6. Changes of ffc at 20% and 100% of SAC for the two flow aids (positive values correspond to an improvement of flowability, while negative values to a worsening)
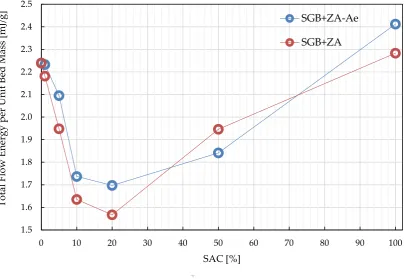
3.2.2. Flowability Indicator by Flow Energy Measurement by FT4
The outcomes of the FT4 measurements are reported in Figure 12 in terms of the
total flow energy per unit bed mass, a larger value indicating a greater resistance to
shearing the bed due to bulk cohesion. The best flowability, associated with the
lowest expended work, is found again for an SAC of 20%. Moreover, ZA improves
the flowability of cohesive beads more than does ZA-Ae.
[image:16.595.129.517.74.215.2]ACCEPTED MANUSCRIPT
14
3.2.3. Angle of Repose
Photographs of the repose angles are shown in Figure 13 for different degrees of
coverage, where the change in the repose angle is clearly visible. The pile of powder
becomes flatter (index of good mobility of particles) as the SAC is increased to 20%.
Apart from the height of the pile, another good indication of particle mobility, and
therefore flowability, is given by the base of the piles, being faint or well defined for
more and less cohesive particles, respectively, reflecting the spreading of the former.
The results of the measured repose angle measurements are shown in Figure 14.
Remarkably, the results confirm the outcomes of the shear cell and the FT4
measurements. The best flowability is again found at 20% of SAC, it almost reaches
the angle of repose of the glass beads with no silanisation. In line with the other two
measurements methods, as the SAC is increased to 50 and 100% cohesiveness is
slightly increased, indicated by AoR increasing again to around 32° at SAC 100%.
Figure 13. AoR of SGB, SGB+ZA-Ae at increasing SAC and GB, respectively
Figure 14. Angle of Repose of Silanised Glass Beads (SGB) coated with ZA-Ae at different SAC
3.3.
Discussion
All the flowability test methods are remarkably consistent in revealing that
flowability improves as the SAC is increased up to 20% and then it deteriorates
beyond this, for both cases of flow aids, i.e. ZA and ZA-Ae. This critical value is
therefore the SAC for which the host-host particle contact is minimized. The higher
effectiveness of the ZA flow aid as compared to that of the ZA-Ae, indicates
agglomerated guest particles can be more effective than a perfect monolayer of the
guest particles, suggesting that the size of the guest particles plays a role by
ACCEPTED MANUSCRIPT
15 effect of the guest particle size acting as a spacer will therefore be of great interest.
Furthermore, the zeolite particles used here are cuboidal shape, as shown in Figure
2, and the presence of edges and corners may in fact be beneficial to reducing
adhesion, in contrast to spherical guest particles. This feature is also worthy of
investigation, although the choice of flow aids is very limited. Magnesium stearate is
commonly used as lubricant, as it readily delaminates on shearing exposing
low-energy low-frictional cleavage planes [19]. However, its presence in fine particulate
form provides a similar spacer effect to reduce host inter-particle stickiness. Above
the optimum critical value of the guest particle loading, the number of effective
contacts between guest-guest particles coming from different host particles per unit
volume increases. This leads to a deterioration in flowability. This finding is more
pronounced in the case of good dispersion of the flow aid with ZA-Ae at high
degrees of coverages like 50% and 100%. From the above it appears, therefore, that
an important parameter is the cohesiveness of the flow aid itself, which affects the
quality of coating and the flowability as a direct consequence. Particle shape has a
strong influence on flowability. Addition of flow aids will initially lead to
accumulation of flow aids in the concave regions of the surface as shown in Figure 9.
Therefore larger quantities of flow aids will be needed to achieve similar flowability.
The uniformity of the guest particles on the host particles surfaces could be
influential, but is difficult to control, and more so for irregular host particle shapes.
4.
Conclusions
The effect of the surface area coverage (SAC) on flowability of 90-150 µm glass
beads, made cohesive by silanisation, has been assessed using two types of
micrometre sized particles: Zeolite A (ZA) and Zeolite A coated with nano-particles
of Aerosil (ZA-Ae). The particles are practically the same material, the only main
difference lies in their cohesiveness; ZA-Ae being less cohesive than ZA. These flow
ACCEPTED MANUSCRIPT
16 cohesive themselves. Silanised glass beads (SGB) are coated in a pan mixer at
different theoretical SAC values of 1, 5, 10, 20, 50 and 100% of flow aids. The quality
of coating is assessed by viewing the SEM micrographs of such samples. Moreover,
the actual SAC is evaluated by image analysis and found to agree with the
theoretical values. Flowability is assessed using the annular shear cell, FT4 powder
rheometer and angle of repose measurements. The results from the three test
methods are in remarkable agreement, and indicate an optimum flowability for a
theoretical coverage of around 20%. Beyond this point the flowability decreases,
though less dramatically for the SGB+ZA. The greater cohesiveness of ZA leads to
their particles forming small clusters on the surfaces of the host particles, enhancing
their spacer effect. This is not the case for ZA-Ae, as the particles are almost fully
spread on the surfaces. The transition from host-guest particle contact to guest-guest
particle contact is critical in terms of flowability, as the guest particles are cohesive
themselves.
5.
Acknowledgements
This article is dedicated to the memory of the late Professor Antonio Castellanos
Mata, Universidad de Sevilla, Spain, whose pioneering work on the use of flow aids
inspired this work.
The first author visited the University of Leeds on an Erasmus Exchange Programme
with the University of Salerno in 2015 during which this work was carried out with
partial support from Procter and Gamble Newcastle Innovation Centre, Newcastle
upon Tyne, UK. The second author, U. Zafar, was supported by a Knowledge
Transfer Secondment from the Impact Accelerated Award to the University of Leeds
by the Engineering and Physical Sciences Research Council, UK (grant no.
EP/K503836/1), working at Procter & Gamble Newcastle Innovation Centre,
ACCEPTED MANUSCRIPT
17
6.
References
[1] A. Castellanos, The relationship between attractive interparticle forces and
bulk behaviour in dry and uncharged fine powders, Adv. Phys. 54 (2005) 263
376.
[2] J.K. Prescott, R.A. Barnum, On Powder Flowability, Pharm. Technol. (2000) 60
84.
[3] C.F. Harwood, Powder Segregation Due to Vibration, Powder Technol. (1977)
51 57.
[4] M. Lohrmann, M. Kappl, H.-J. Butt, N.A. Urbanetz, B.C. Lippold, Adhesion
forces in interactive mixtures for dry powder inhalers Evaluation of a new
measuring method, Eur. J. Pharm. Biopharm. (2007) 579 586.
[5] L. Massimllla, G. Donsi, Cohesive Forces Between Particles of Fluid-Bed
Catalysts, Powder Technol. 15 (1956) 253 260.
[6] A.A. Kyrre Thalberg, David Lindholm, Comparison of different flowability
tests for powders for inhalation, Powder Technol. 146 (2004) 206 213.
[7] J.M. Valverde, A. Castellanos, Types of gas fluidization of cohesive granular
materials, Phys. Rev. E - Stat. Nonlinear, Soft Matter Phys. 75 (2007) 1 6.
[8] M.P. Mullarney, L.E. Beach, R.N. Dave, B.A. Langdon, M. Polizzi, D.O.
Blackwood, Applying dry powder coatings to pharmaceutical powders using
a comil for improving powder flow and bulk density, Powder Technol. 212
(2011) 397 402.
[9] C. Conesa, K. Saleh, A. Thomas, P. Guigon, N. Guillot, Characterization of
Flow Properties of Powder Coatings Used in the “utomotive Industr y
Methods. 22 (2004) 94 106.
ACCEPTED MANUSCRIPT
18 Powders, AIChE J. 54 (2008) 104 121.
[11] J. Yang, A. Sliva, A. Banerjee, R.N. Dave, R. Pfeffer, Dry particle coating for
improving the flowability of cohesive powders, Powder Technol. 158 (2005)
21 33.
[12] L.J. Jallo, C. Ghoroi, L. Gurumurthy, U. Patel, R.N. Davé, Improvement of flow
and bulk density of pharmaceutical powders using surface modification, Int. J.
Pharm. 423 (2012) 213 225.
[13] Q. Zhou, L. Qu, T. Gengenbach, J.A. Denman, I. Larson, P.J. Stewart, D.A. V
Morton, Investigation of the extent of surface coating via mechanofusion with
varying additive levels and the influences on bulk powder flow properties, Int.
J. Pharm. 413 (2011) 36 43.
[14] A.W. Jenike, Gravity Flow of bulk solids, Bull. Univ. Utah. 52 (1961) 24 27.
[15] R. Freeman, The classifications of powder in relation to flowability, Powder
Handl. Process. 12 (2000) 194 197.
[16] D. Geldart, E.C. Abdullah, A. Hassanpour, L.C. Nwoke, I. Wouters,
Characterization of powder flowability using measurement of angle of repose,
China Particuology. 4 (2006) 104 107.
[17] R.L. Carr, Classifying flow properties of solids, Chem. Eng. 72 (1965) 69 72.
[18] G.J. Raymus, Handling of Bulk Solids, in: D. Green R. H. Perry (Ed.), Chem.
Eng. Handb., 6th ed., McGraw Hill, New York, 1985.
[19] A. Mehrotra, M. Llusa, A. Faqih, M. Levin, F.J. Muzzio, Influence of shear
intensity and total shear on properties of blends and tablets of lactose and
cellulose lubricated with magnesium stearate, Int. J. Pharm. 336 (2007) 284
ACCEPTED MANUSCRIPT
[image:22.595.67.526.79.563.2]19
Table 1. Host and Guest Particle properties
Role Material Abbreviation D50 [µm] Shape
Density
[kg/m3]
Host Particles
Glass Beads made cohesive
by silanisation SGB 125 Spherical 2500
Guest
Particles Zeolite A ZA 2.6 Cubical 1417
Guest Particles
Zeolite A (coated with nano
particles of Aerosil) ZA-Ae 2.6 Cubical 1417
Table 2. Mass fractions of flow aids for the set surface area coverages (SAC)
SAC[%] 1 5 10 20 50 100
[%] 0.05 0.24 0.47 0.94 2.32 4.53
Table 3. Flow function coefficient (ffc) classification according to Jenike [13]
ffc<1 Hardened
1<ffc<2 Very Cohesive
2<ffc<4 Cohesive
4<ffc<10 Easy Flowing
[image:22.595.68.519.81.276.2]ffc>10 Free Flowing
Table 4. Classification of the Angle of Repose (AoR) according to Carr [17] and Raymus [18]
AoR>55° Very High Cohesiveness
45°<AoR<55° High Cohesiveness
30°<AoR<45° Some Cohesiveness
ACCEPTED MANUSCRIPT
[image:23.595.71.530.83.211.2]20
Table 5. Theoretical and actual SAC
Theoretical SAC [%] 1 5 10 20 50 100
Actual SAC (SGB+ZA) [%] 0.7 3.5 5.5 20.0 41.2 66.9
Actual SAC (SGB+ZA-Ae) [%] 0.4 5.3 8.7 17.3 57.3 75.1
Table 6. Changes of ffc at 20% and 100% of SAC for the two flow aids (positive values correspond to an improvement of flowability, while negative values to a worsening)
ffc change
Flow aid 20% SAC 100% SAC
ZA 33.3% -3.2%
ACCEPTED MANUSCRIPT
21
ACCEPTED MANUSCRIPT
22
ACCEPTED MANUSCRIPT
[image:26.595.125.467.95.323.2]23
Figure 3. Bulk density and cohesion as affected by silanisation of glass beads and coating of zeolite particles by Aerosil
0 100 200 300 400 500 600 700 800 900
0 200 400 600 800 1000 1200 1400
Co
h
es
io
n
[
Pa
]
bulk density [kg/m3]
GB SGB ZA ZA-Ae
effect of silanisation effect of coating with
ACCEPTED MANUSCRIPT
24
Figure 4. Micrographs and image manipulation for SAC evaluation
ACCEPTED MANUSCRIPT
[image:28.595.104.505.122.453.2]25
ACCEPTED MANUSCRIPT
26
ACCEPTED MANUSCRIPT
[image:30.595.120.476.143.353.2]27
ACCEPTED MANUSCRIPT
[image:31.595.76.518.69.571.2]28
Figure 8. SEM micrographs of particles coated with ZA, from top left to bottom right: 1, 5, 10, 20, 50, 100% of SAC
%
%
10%
20%
ACCEPTED MANUSCRIPT
[image:32.595.76.521.85.594.2]29
Figure 9. SEM micrographs of particles coated with ZA-Ae, from top left to bottom right: 1, 5, 10, 20, 50, 100% of SAC
1%1
5%5
10%
20%
ACCEPTED MANUSCRIPT
30
Figure 10. ffc of SGB coated with ZA
0 1 2 3 4 5 6 7 8 9 10 11 12 13 14 15
0 10 20 30 40 50 60 70 80 90 100
ff
c
[-]
SAC [%]
3 kPa
5 kPa
10 kPa
ACCEPTED MANUSCRIPT
31
Figure 11. ffc of SGB coated with ZA-Ae
0 1 2 3 4 5 6 7 8 9 10 11 12 13 14 15
0 10 20 30 40 50 60 70 80 90 100
ff
c
[-]
SAC [%]
3 kPa
5 kPa
10 kPa
ACCEPTED MANUSCRIPT
[image:35.595.93.499.89.368.2]32
Figure 12. Total flow energy per unit bed mass of SGB coated with ZA and ZA-Ae at different SAC
1.5 1.6 1.7 1.8 1.9 2.0 2.1 2.2 2.3 2.4 2.5
0 10 20 30 40 50 60 70 80 90 100
ACCEPTED MANUSCRIPT
[image:36.595.90.512.69.729.2]33
ACCEPTED MANUSCRIPT
[image:37.595.76.507.86.403.2]34
Figure 14. Angle of Repose of Silanised Glass Beads (SGB) coated with ZA-Ae at different SAC
0 5 10 15 20 25 30 35 40 45 50 55 60
0 10 20 30 40 50 60 70 80 90 100
A
o
R
[
°]
SAC [%]
SGB+ZA-Ae
GB
Good Flowability Some Cohesiveness True
ACCEPTED MANUSCRIPT
35 Graphical abstract 1.5 1.6 1.7 1.8 1.9 2.0 2.1 2.2 2.3 2.4 2.50 10 20 30 40 50 60 70 80 90 100
T o ta l F lo w E n er g y p er U n it B ed M as s [m J/ g ] SAC [%]
Relationship between Surface Area Coverage of
Flow-Aids and Flowability of Cohesive Particles
SGB+ZA-Ae
Impr
oving
flowa
ACCEPTED MANUSCRIPT
36
Highlights
Sticky particles are made free flowing by the use of flow aids
Surface area coverage is measured by image analysis
Flowability is measured by three methods