L
eurostat
Theme 2
Economy and finance
Series Β
Short-term trends
ISSN 1011-0844
ECU-EMS information
9-10-11 D 1994
Monthly
CONSUMER PRICE INDICES IN ECU
ECU BOND ISSUANCE
After remaining at 1.6% in July and August, the growth rate of
the CPI in ECU over 12 months for the EUR12 increased in
1.9% in September. At the same time the corresponding rate for
the EMS countries fell to 1.9% from the 3.7% rate recorded in
the previous month. Between August and September the
monthly index for EUR12 and EMS countries rose by 0.46 %
and 0.38 % respectively. A slight decrease were recorded in the
indices of Belgium (-0.21 %) and of Germany (-0.07 %) owing
mainly to the moderate strength of the ECU against BLF and
DM. The Greek index recorded a sharp increase of 2.58 %.
There also were significant increases in the indices of Spain
(0.87%) and Holland (0.86 %) between August and September.
BILATERAL FLUCTUATIONS OF THE ERM CURRENCIES
The graph (Table I) shows that during September and October
the daily bilateral exchange rates of the ERM currencies
fluctuated within a band of ±3% although the maximum
permissible fluctuation margin is ±15%. The graph also shows
that the market bilateral rates of HFL, DM, BLF, IRL, FF and
DKR fluctuate above their central rates and that the rest ERM
currencies (ESC and PTA) fluctuate below their central bilateral
rates. It is importance to note that the FF has moved very near
to its central bilateral rates during the whole period considered.
The graph demonstrates that the daily changes of the bilateral
exchange rates of the ERM currencies within the band of ±3%
have been very small. The highest volatility has been observed
in the IRL
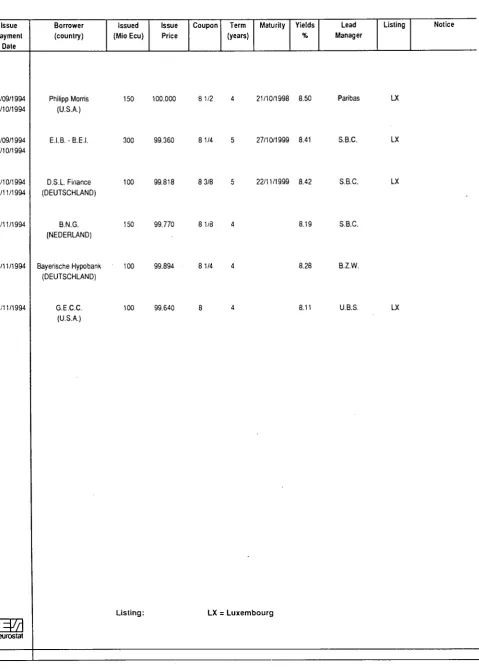
Bond issuance has been supported by substantial ecu
repayment flows in the last few months with amounts repaid of
887, 1527 and 1757 ecu millions repaid in September, October
and November respectively. If one excludes governments
programmes, most activity has been observed in the private
sector, with a roughly balanced distribution between banks and
industrial companies. It is interesting to note that all the
industrial borrowers are US-based firms, such as Philipp Morris,
General electric and ATT. It was the latter's first ever non-dollar
issue. These issues from private borrowers can be briefly
described as follows: high-rated signatures (more often than not
triple A), small-sized (100 or 150 millions of ecu) with maturities
of 4 or 5 years as a consequence of a good swap spread in this
region of the yield curve. Swiss Bank Corporation and Barclays
de Zoet Wedd have been particularly active as lead-managers
over the period. France, Italy and the UK supplied the market
with larger domestic issues.
ECU YIELD EVOLUTION
Ξ 3
eurosta
OFICINA ESTADÍSTICA DE LAS COMUNIDADES EUROPEAS
DE EUROPÆISKE FÆLLESSKABERS STATISTISKE KONTOR
STATISTISCHES AMT DER EUROPÄISCHEN GEMEINSCHAFTEN
ΣΤΑΤΙΣΤΙΚΗ ΥΠΗΡΕΣΙΑ ΤΩΝ
ΕΥΡΩΠΑΪΚΩΝ ΚΟΙΝΟΤΗΤΩΝ
STATISTICAL OFFICE OF THE EUROPEAN COMMUNITIES
OFFICE STATISTIQUE DES
COMMUNAUTÉS EUROPÉENNES
ISTITUTO STATISTICO DELLE COMUNITÀ EUROPEE
BUREAU VOOR DE STATISTIEK DER EUROPESE GEMEENSCHAPPEN
SERVIÇO DE ESTATÍSTICA DAS COMUNIDADES EUROPEIAS
L-2920 Luxembourg - Tél. 43 01-1 - Télex COMEUR LU 3423
B-1049 Bruxelles, rue de la Loi 200 - Tél. 299 11 11
Note
For any
TEL:
FAX:
information
+ 352
on the statistics in this
4301-34674
33288
32929
bulletin contact Luxembourg:
F.GARCIA-VALERO
G.THOUVENIN
Eurostat
Monetary and Financial Statistics,
Jean Monnet Building
APC C4/04
L-2920 Luxembourg
Contents
I.
II.
III.
IV.
V.
VI.
VII.
A graph of the bilateral fluctuations of the ERM currencies.
Yearly and monthly issues of ecu bonds.
EMCF rate, interest rates on ecu deposits and yields on ecu bonds.
Last month's ecu bond issues.
Consumer price indices in national currencies.
Consumer price indices In ecus.
Yearly, monthly and daily ecu exchange rates.
ECSC-EC-EAEC, Brussels · Luxembourg, 1994
Reproduction is authorized, except for commercial purposes, provided the source is acknowledged.
TABLE I
BILATERAL FLUCTUATIONS OF THE ERM CURRENCIES
I I I I i I I I I I I I I I I I I i I I I I I I I I I
01/09
15/09
29/09
13/10
27/10
CENTRAL RATES AND INTERVENTION LIMIT RATES, IN FORCE SINCE 2 AUGUST 1993, FOR
THE CURRENCIES OF COUNTRIES PARTICIPATING IN 1
=
Jf
eurostatBLF
DKR
DM
PTA
FF
IRL
HFL
ESC
1 ECU =
40.2123
7.43679
1.94964
154.250
100 B L F =
+
= i
- !
+ ! 21.4747 18.4938 - ! 15.9266 +
=
-+=
-5.63000 4.84837 4.17500 445.4)8 383.589 330.342 + 18.8800 6.53883 = 16.2608
0.808628
2.19672
- \ 14.0050 + I 2.33503 = j 2.01090 - Í 1.73176 + ¡ 6.34340
=
¡
192.854 +
5.46286 4.70454 556.890 = ! 479.590
413.020
100 DKR =
627.880 540.723 465.665
-30.4450 26.2162 22.5750 2408.50 2074.15 1786.20 102.100087.9257 75.7200 12.6261 10.8734 9.3640 34.3002 29.5389 25.4385 3011.20 2593.24 2233.30
100 DM =
2395.20 2062.55 1776.20 442.968 381.443 328.461
-9191.20 7911.72 6812.00 389.480 335.386 288 810 48.1696 41.4757 35.7143 (130.834)(1)112.6730 (97.0325)(1)
11481.10 9891.77 8517.90
100 PTA =
30.2715 26.0696 22.4510 5.59850 4.82126 4.15190 1.46800 1.26395 1.08800
-4.92260 4.23911 3.65050 0.608731 0.524232 • 0.4514621.65368 1 42413 1 22644 145.180 125.027 107.670
"HEEMSt
100 FF =
714.030 614.977 529.660 132.066 113.732 97.943 34.6250 29.8164 25.6750 2739.30 2358.98 2031.50
-14.3599 12.3666 10.6500 39.0091 33.5953 28.9381 3424.80 2949.37 2540.00EXCHANG
1 IRL =
57.7445 49.7289 42.8260 10.67920
9.19676 7.92014 2.80000 2.41105 2.07600 221.503 190.755 164.276 9.38950 8.08631 6.96400
-3.15450 2.71662 2.33952 276.938 238.495 205.389E MECHA
100 HFL =
2125.60 1830.54 1576.45 393.105 338.537 291.544 (103.058)(1)
88.7526 (76.4326)(1)
8153.70 7021.83 6047.10 345.650 297.661 256.350 42.7439 36.8105 31.7007
-10194.30 8779.18 7560.50
^ISM.
100 ESC =
24.2120 20.8512 17.9570 4.47770 3.85618 3.32090 1.17400 1.01094 0.87100 92.8760 79.9828 68.8800 3.93700 3.39056 2.91990 0.486881 0.419295 0.361092 1.32266 1.13906 0.98094
-(1) These buying and selling rates will not be operational. Reflecting a bilateral agreement between the German and the Dutch monetary authorities, the following rates will continue to apply: selling rate Fl. 100 in Frankfurt: DM 90.7700; buying rate Fl. 100 in Frankfurt: DM 86.7800; selling rate DM 100 in Amsterdam: Fl. 115.235; buying rate DM 100 in Amsterdam: Fl. 110.1675.
TABLE II
ECU BOND ISSUES (Mio ECU) *
M
eurostat
1988 1989 1990 1991 1992 1993
1992 IV 1993
I II III IV 1994
I II
A
s
0TOTAL
9 248 11 127 15 040 27 163 19 242 6 870
80
1 980 1 130 1 070 2 690
2 4 1 0 1 815
445 350 600
European Community
Total
5 335 6 461 10 525 19 266 11 675
5 020
80
1 480 630 770 2 140
2 285 1 215
295 150 300
Business sector
3 390 4 400 3 990 6 581 4 870 1 565
80
300 130 720 415
910 415
0 0 0
Govern-ments
100 500 5 000 7 900 2 475 250
0
0 250 0 0
1 150 0
0 150 0
Institutions
1 845 1 561 1 535 4 785 4 330 3 205
0
1 180 250 50 1 725
225 800
295 0 300
Total
3 9 1 3 4 666 4 515 7 897 7 567 1 850
0
500 500 300 550
125 600
150 200 300
^on-European Community Business
sector
3 138 4 141 3 565 3 932 3 902 250
0
0 0 200 50
125 200
150 200 300
Govern-ments
575 425 550 3 790 2 850 1 600
0
500 500 100 500
0 400
0 0 0
I Organi-sations
200 100 400 175 815 0
0
0 0 0 0
0 0
0 0 0
C) Recording based on the payment date
TABLE III
OPERATIONS RATES OF THE EMI (CALCULATION MONTH, APPLICABLE THE FOLLOWING MONTH) AND INTEREST RATES AND YIELDS OF ECU INVESTMENTS (%)
=
Jr
eurostal1990 1991 1992 1993
1993
s
O N D 1994J F M A M J J A
s
OEMI
10.52 10.06 10.29 7.88·
7.25 7.00 6 . 7 5 ' 6.25
6.25 6.25 6.00 6.00 5.75 5.75 5.75 5.75 5.75 5.75
Deposits
1 month
10.07 9.73 10.43 8 . 2 7 ·
7.73 7.36 7.01 · 6.71
6.52 6.43 6.30 6.12 5.96 5.83 5.78 5.72 5.59 5.56
3 months
10.32 9.80 10.41 7.99·
7.50 7.30 6 . 8 6 ' 6.37
6.29 6.27 6.18 6.05 5.75 5.84 5.88 5.86 5.81 5 8 9
6 months
10.55 9.84 10.27 7.65·
6.98 6.94 6 . 5 9 ·
6.09
6.03 6.10 6.06 5.97 5.70 5.87 6.02 6.09 6.16 6.12
1 year
10.69 9.83 10.01 7.11 ·
6.38 6.40 6 0 6 "
5.68
5.57 5.76 5.93 5.91 5.70 6.08 6.26 6.46 6.77 6.74
3 years
6.740
6.295 6 148 5.822 5 4 9 3
5.351 5.659 6.170 6.401 6.589 7.167 7.283 7.562 8.001 7.975
Ecu
5 years
6.909
6.421 6.307 6.002 5.668
5.513 5.771 6.296 6.584 6.857 7.492 7.463 7.779 8.273 8.288
yield
7 years
7.137
6.650 6.461 6.262 5.974
5.800 6.103 6.646 6.937 7.179 7.825 7.786 8.055 8.548 8.565
10 years
7.187
6.632 6.527 6.445 6.131
5.950 6.228 6.754 7.039 7.300 7.811 7.767 8.046 8.502 8.480
TABLE IV
LAST MONTH'S ECU BOND ISSUES
Issue Payment
Date
Borrower (country)
Issued (Mio Ecu)
Issue Price
Coupon Term (years)
Maturity Yields
%
Lead Manager
Listing Notice
21/09/1994 21/10/1994
22/09/1994 27/10/1994
25/10/1994 22/11/1994
03/11/1994
03/11/1994
04/11/1994
Philipp Morris (U.S.A.)
E.I.B.-E.E.I.
D.S.L. Finance (DEUTSCHLAND)
B.N.G. (NEDERLAND)
Bayerische Hypobank (DEUTSCHLAND)
G.E.C.C. (U.S.A.)
eurostat
300 99.360 81/4 5 27/10/1999 8.41 S.B.C.
100 99.818 8 3/8 5 22/11/1999 8.42 S.B.C.
150 99.770 81/8 4
100 99.894 81/4 4
100 99.640 8
Listing: LX = Luxembourg
¡.19 S.B.C.
I.28 B.Z.W.
¡.11 U.B.S.
150 100.000 81/2 4 21/10/1998 8.50 Paribas LX
LX
LX
TABLE V
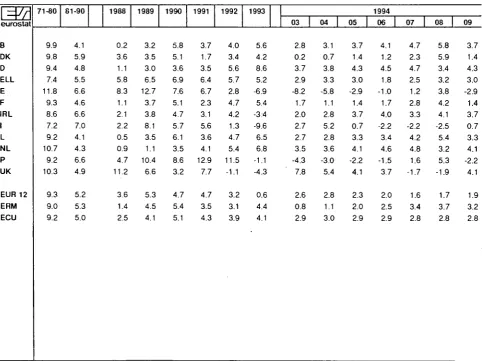
CONSUMER PRICE INDICES IN NATIONAL CURRENCY
1985=100
-
Jf
eurostat B DK D ELL E F IRL I L NL Ρ UK EUR 12 ERM 1980 71.2 68.3 82.6 39.1 56.2 63.3 56.1 52.5 70.3 81.8 35.2 70.7 65.3 66.71990 1988
111.0 104.1 121.2 112.7 107.0 101.4 222.6 162.5 136.8 120.0 116.3 108.7 117.6 109.4 131.8 116.5 109.0 101.7
104.3 100.6 170.9 133.9 133.3 113.0
123.0 110.7 116.9 107.6
1989 107.3 118.1 104.2 184.9 128.2 112.7 113.9 123.7 105.1 101.7 150.8 121.8 116.4 111.9 1990 111.0 121.2 107.0 222.6 136.8 116.3 117.6 131.8 109.0 104.3 170.9 133.3 123.0 116.9 1991 114.6 124.1 110.7 264.7 145.0 120.0 121.3 140.2 112.4 108.4 189.5 141.1 129.1 122.4 1992 117.3 126.7 115.1 308.1 153.5 123.0 125.1 147.4 115.9 112.5 206.7 146.4 134.6 127.2
1993 1994
03
120.6 122.6 128.3 129.8 119.8 122.8 352.6 381.0 160.6 166.2 125.6 127.2 126.9 128.5 153.9 158.3 120.1 121.9 114.9 117.3 220.0 229.3 148.7 150.7
139.1 142.2 131.6 134.4
04 122.8 130.3 123.1 386.8 166.9 127.5 129.5 158.7 122.0 117.5 230.6 152.5 142.9 134.6 05 123.2 131.1 123.4 389.8 167.3 127.8 129.5 159.3 122.3 117.5 231.1 153.0 143.3 134.8 06 123.4 131.0 123.6 393.7 167.4 127.8 129.5 159.6 122.4 117.3 231.5 153.0 143.5 134.9 07 124.2 130.8 123.7 387.3 168.0 127.7 130.5 160.1 122.8 117.7 231.9 152.2 143.5 134.8 08 124.4 131.3 123.8 388.5 169.2 127.8 130.5 160.4 123.0 118.2 232.2 153.0 143.9 135.6 09 124.2 131.7 123.9 401.1 169.7 128.1 130.5 160.9 123.4 119.2 232.7 153.3 144.2 135.0
Annual rate of increase (%)
-
Jf
eurostat Β DK D ELL E F IRL I L NL Ρ UKEUR 12 ERM
EUR 12 ERM
EUR 12 ERM 71-80 7.4 9.8 5.1 14.5 15.4 9.7 13.7 14.1 6.7 7.4 18.7 13.8 9.9 8.4 3.5 3.0 4.8 3.3
81-90 1988
4.6 1.2
5.9 4.6
2.6 1.2
19.0 13.5
9.3 4.8
6.3 2.7
7.8 2.1 9.7 5.1 4.5 1.4
2.5 0.9
17.3 9.6
6.6 4.9
6.6 3.6 5.4 2.7
2.4 1.8
2.5 1.4
4.1 2.8
2.9 1.9 1989 3.1 4.8 2.8 13.8 6.8 3.7 4.1 6.2 3.3 1.1 12.6 7.8 5.1 4 0 2.2 1.4 4.1 2.9 1990 3.4 2.6 2.7 20.4 6.7 3.2 3.2 6.5 3.7 2.5 13.3 9.4 5.7 4.5 2.7 1.8 Disp 3.5 2.3 1991 3.2 2.4 3.5 18.9 6.0 3.2 3.1 6.4 3.1 3.9 10.9 5.9 5.0 4.7 Avéra 1.8 1.4 arity bel 2.7 2.3 1992 2.4 2.1 4.0 16.4 5.9 2.5 3.1 5.1 3.1 3.8 9.1 3.8 4.3 4.1
ge devi;
1.2 0.9
ween th
2.3 2.0
1993 1994
03
2.8 2.3 1.3 1.7 4.1 3.2 14.5 10.2 4.6 5.0 2.1 1.5 1.4 1.7 4.5 4.2 3.6 2.3 2.1 2.9 6.5 6.0 1.6 2.3
3.4 3.2 3.3 2.9
juon around the mea
1.4 1.1 1.0 0.9
e average and the π
2.2 1.7 2.1 1.2
TABLE VI
CONSUMER PRICE INDICES IN ECU
1985=100
-
Jr
eurostat Β DK D ELL E F IRL I L NL Ρ UK EUR 12 ERM ECU 1980 78.7 70.0 72.9 68.6 72.7 73.1 58.5 63.8 77.7 74.4 65.8 69.7 70.9 71.3 71.71990 1988
117.5 107.6 123.7 113.7 116.1 108.8 114.9 100.9 136.4 112.5 114.3 105.0 109.3 100.6 125.2 109.6 115.4 105.2 113.2 108.2 122.6 102.3 110.0 100.2 117.8 106.8 119.0 108.0 117.0 106.9 1989 111.1 117.7 112.1 107.5 126.8 1089 104.4 118.5 108.8 109.4 112.9 106.6 112.5 112.9 1113 1990 117.5 123.7 116.1 114.9 136.4 114.3 109.3 125.2 115.4 113.2 122.6 110.0 117.8 119.0 117.0 1991 121.9 125.3 120.2 122.2 145.5 116.9 112.7 132.2 119.6 117.8 138.4 118.5 123.3 123.2 122.0 1992 126.7 130.1 126.9 129.8 149.6 122.3 117.4 133.9 125.2 124.2 153.8 117.3 127.2 127.0 126.8
1993 1994
03 133.8 138.3 135.5 137.5 137.8 141.6 136.6 140.7 139.3 135.2 128.7 131.3 113.4 115.5 120.9 120.1 133.3 137.6 132.6 135.7 152.1 149.9 112.2 115.8 127.9 130.0 134.0 127.2 131.0 133.8 04 138.5 137.8 141.7 141.9 136.8 130.7 116.2 123.9 137.6 135.8 151.6 116.8 131.0 128.3 134.3 05 139.2 139.1 142.3 141.9 135.6 131.3 116.7 124.1 138.2 136.2 150.5 116.3 131.1 130.3 134.6 06 139.7 139.1 142.7 141.2 135.7 131.8 116.9 122.4 138.4 136.3 150.5 116.0 130.9 130.6 134.7 07 141.1 139.2 143.6 139.1 136.9 132.1 115.8 121.1 139.6 137.3 152.9 113.3 130.6 130.3 134.9 08 141.7 139.1 144.0 139.5 137.4 132.4 115.9 119.8 140.1 138.2 154.3 113.6 130.6 130.1 135.2 09 141.4 139.5 143.9 143.1 137.6 132.8 116.7 120.2 140.5 139.3 154.8 114.2 131.1 130.8 135.5
Annual rate of increase (%)
=
Jf
eurostat Β DK D ELL E F IRL I L NL Ρ UK EUR 12 ERM ECU 71-80 9.9 9.8 9.4 7.4 11.8 9.3 8.6 7.2 9.2 10.7 9.2 10.3 9.3 9.0 9.281-90 1988
4.1 0.2 5.9 3.6 4.8 1.1 5.5 5.8 6.6 8.3 4.6 1.1 6.6 2.1 7.0 2.2 4.1 0.5 4.3 0.9 6.6 4.7 4.9 11.2 5.2 3.6 5.3 1.4 5.0 2.5
1989 3.2 3.5 3.0 6.5 12.7 3.7 3.8 8.1 3.5 1.1 10.4 6.6 5.3 4.5 4.1 1990 5.8 5.1 3.6 6.9 7.6 5.1 4.7 5.7 6.1 3.5 8.6 3.2 4.7 5.4 5.1 1991 3.7 1.7 3.5 6.4 6.7 2.3 3.1 5.6 3.6 4.1 12.9 7.7 4.7 3.5 4.3 1992 4.0 3.4 5.6 5.7 2.8 4.7 4.2 1.3 4.7 5.4 11.5 -1.1 3.2 3.1 3.9
1993 1994
03 5.6 2.8 4.2 0.2 8.6 3.7 5.2 2.9 -6.9 -8.2 5.4 1.7 -3:4 2.0 -9.6 2.7 6.5 2.7 6.8 3.5 -1.1 -4.3 -4.3 7.8 0.6 2.6 4.4 0.8 4.1 2.9
TABLE VII
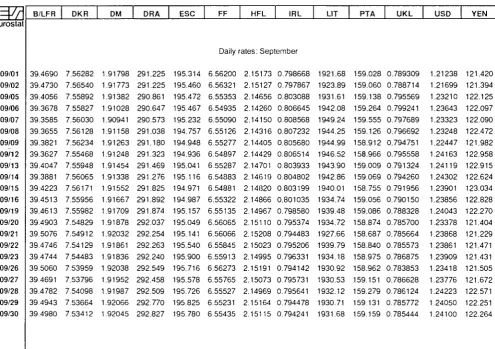
ECU EXCHANGE RATES
—
Tf
B/LFR | DKR I DM | DRA | ESC | FF [ HFL | IRL | LIT | PTA | UKL | USD | YEN
EXPLANATORY NOTES
Bilateral currency deviation (graph on page 3).
The various curves should be compared in pairs. To
find the differential between two currencies, subtract the
(positive
or
negative)
values
along the
y-axis
corresponding to each currency.
The graph is drawn with the curve of the strongest
currency above that of the weakest. It shows therefore
the relative position of each currency vis-à-vis the other
currencies.
When two curves intersect or merge over a period of
time there is no differential between the two currencies
and their market exchange rate equals their bilateral
central rate.
The graph is drawn within a horizontal
band
corresponding to the maximum 15% margin of
fluctuation applying at any given moment to market
exchange rates and the bilateral central rates of the
ERM currencies. This band is divided symmetrically by
a horizontal axis along which the points would be
plotted if all currencies were at their bilateral central rate
and there were therefore no fluctuations.
The daily market exchange rates of all currencies are
compared with the relevant bilateral central rates and
the differentials between the two calculated.
The maximum fluctuation between two currencies is
shown within the band, symmetrical with the horizontal
axis. The fluctuations of the other currencies in relation
to either of the two currencies in question are shown
within the maximum permissible fluctuation.
The curves are drawn by linking
the daily points
showing the relative positions of each currency.
Exchange rate grid (Table I).
The intervention limit rates fixed in the official grid do
not always correspond exactly to + or - 15 % of the
central rates, since for each currency pair (whose
exchange rates are inversely proportional to one
another) the lower limit of the one corresponds to the
upper limit of the other.
Ecu bond issues (Table II
&
IV).
In table II, issues are recorded as at the payment date.
This bulletin only covers international and foreign issues
in ecus, including ecu issues offering the option of
conversion
into
other
currencies.
Main
source:
International Financing Review
Table II shows, under the headings:
-Business sector and Governments: national issuers,
both private and public.
-Institutions: the European Investment Bank and the
Commission of the European Communities (EEC,
ECSC, Euratom).
-Organizations: the specialist institutions of the United
Nations, the World Bank, the Council of Europe, etc
Table IV shows detailled information of the latest known
issues, whatever the payment date.
Interest rates and yields on ecu investments (Table
III).
The interest rates for 1, 3, 6, months and 1 year
deposits are calculated on the basis of the London
market rates LIBID as follows:
- until October 1993 : (source: Financial Times, Friday
rate).
- from November 1993 : (source : Bank of England,
British Banker's Association, daily rates).
The yields of ecu bonds at 3, 5, 7 and 10 years are
those provided by Eurostat's yield curve. These are
redemption yields. Eurostat's yield curve, which portrays
the interest rate structure of maturities ranging from 1 to
10 years, is based on highest quality issues with a
triple-Α rating of at least ecu 500 million outstanding,
with a very high liquidity (bid-offer spread less than 50
basis points). The curve is calculated daily by fitting by
regression a third order polynomial function to the
price/yield values
of bonds provided
by
ISMA
(International Securities Market Association, London).
These values reflect the mean of bid and offered prices
communicated by a comprehensive range of financial
institutions. The monthly figures included in the table
are the non-weighted arithmetic average of daily figures
whereas the yearly figures are the non-weighted
arithmetic average of monthly figures.
Operations rates of the EMI (Table III).
Consumer price indices in national currency (Table
V).
The consumer price indices in the national currency of
each country measure changes in the purchasing power
of one unit of national currency spent in the country
concerned.
Two composite indices are calculated, covering all the
Member States of the Community (EUR 12) and the
nine Member States with currencies participating in the
European Monetary System exchange rate mechanism
(ERM). (Although the peseta has been participating in
the exchange rate mechanism since 19/06/89 and has
been included in the calculation of the ecu since
21/09/89, it is only taken into account in the indices
relating to the ERM which are included in this bulletin for
data after 30/09/89.)
These indices are calculated as weighted arithmetic
means (chain indices) of the national indices, the
weighting for each Member State being its relative
share in the final consumption of households of the
group of countries in question (EUR 12, ERM),
expressed in purchasing power standards, at current
prices and purchasing power parities.
At the foot of the table, the average weighted
fluctuations around the mean and the minimum are
given for the same groups of countries, with the same
weightings. (These are calculated as weighted averages
of the absolute fluctuations in relation to the mean and
the minimum respectively). They show the degree to
which price movements in the Member States in the
Community converge.
Consumer price indices in ecus (Table VI).
For each country the index of consumer prices in ecus
is calculated by dividing the national consumer price
index by the average movement of the national
currency in relation to the ecu during the month. It
measures the change in the purchasing power of one
ecu in the country concerned.
Three composite indices are calculated, covering all the
Member States of the Community (EUR 12 and ECU),
the 9 Member States participating in the European
Monetary System exchange rate mechanism (ERM).
(Although the peseta has been participating in the
exchange rate mechanism since 19/06/89 and has been
included in the calculation of the ecu since 21/09/89, it
is only taken into account in the indices relating to the
ERM which are included in this bulletin for data after
30/09/89.)
These three indices are calculated as weighted
arithmetic means (chain-indices). The weightings are
defined as follows: for the EUR 12 and ERM indices,
the relative share of each Member State in the final
consumption of households for the group of countries in
question (EUR 12 or ERM), expressed in ecus at
current prices and exchange rates (annual weighting).
For the ECU index, the relative share of each Member
State's currency in the calculation of the ecu (monthly
weighting).
Ecu exchange rates (Table VII).
The exchange rates for the ecu against the national
currencies of the Member States of the Community, the
USD and yen are shown as annual averages, monthly
averages (for the current year), and daily rates (for the
latest available month).
\m
1ecu =
100 =
BFR
DKR
DM
D R A *
ESC
FF
HFL
IRL
LFR
LIT*
PTA
From 21/09/89 the ecu basket has been made up as follows
:
3.301 0.1976 0.6242 1.44 1.393 1.332 0.2198 0.008552 0.13 151.8 6.885
Ecu central rates from 14/05/93
40.2123 7.43679 1.94964 264.513 192.854 6.53883 2.19672 0.808628 40.2123 1793.19 154.250
Weights of currencies on 14/05/93, calculated on the basis of current central rates, expressed in
8.21 2.66 32.02 0.54 0.72 20.37 10.01 1.06 0.32 8.47 4.46
U K L *
0.08784
0.786749
% :
11.16
does not participate in the exchange rate mechanism.
Venta y suscripciones · Salg og abonnement · Verkauf und Abonnement · Πωλήσεις και συνδρομές
Sales and subscriptions · Vente et abonnements · Vendita e abbonamenti
Verkoop en abonnementen · Venda e assinaturas
BELGIQUE /BELGIË ITALIA SCHWEIZ / SUISSE / SVIZZERA ISRAEL
Moniteur belge/ Belgisch staatsblad
Rue de Louvain 42 / Leuvenseweg 42 1000 Bruxelles /1000 Brussel Tél. (02)512 00 26 Fax (02)511 01 84
Jean De Lannoy
Avenue du Roi 202 / Koningslaan 202 1060 Bruxelles / 1060 Brussel Tél. (02) 538 51 69 Télex 63220 UNBOOK Β Fax (02) 538 08 41 Autres distributeurs/ Overige verkooppunten:
Librairie européenne/ Europese boekhandel
Rue de la Loi 244/Wetstraat 244 1040 Bruxelles / 1040 Brussel Tel. (02) 231 04 35 Fax (02) 735 08 60
DANMARK
J. H. Schultz Information A/S
Herstedvang 10-12 2620 Albertslund TH. 43 63 23 00 Fax (Sales) 43 63 19 69 Fax (Management) 43 63 19 49
DEUTSCHLAND
Bundesanzeiger Verlag
Breite Straße 78-80 Postfach 10 05 34 50445 Köln Tel. (02 21) 20 29-0 Fax (02 21)202 92 78
GREECE/ΕΛΛΑΔΑ
G.C. Eleftheroudakis SA
International Bookstore Nikis Street 4 10563 Athens Tel (01 ) 322 63 23 Telex 219410 ELEF Fax 323 98 21
ESPANA
Boletin Oficial del Estado
Trafalgar. 27-29 28071 Madrid Tel. (91)538 22 95 Fax (91 )538 23 49
MundiPrensa Libros. SA
Castello. 37 28001 Madrid
Tel (91)431 33 99 (Libros) 431 32 22 (Suscripciones) 435 36 37 (Dirección) Télex 49370-MPLI-E Fax (91) 575 39 98 Sucursal:
Libreria Internacional AEDOS
Conse|0 de Ciento. 391 08009 Barcelona Tel. (93) 488 34 92 F a x ( 9 3 ) 4 8 7 76 59
Llibreria de la Generalität de Catalunya
Rambla dels Estudis. 118 (Palau Moia) 08002 Barcelona
Tel. (93) 302 68 35 Tel. (93) 302 64 62 Fax (93) 302 12 99
FRANCE
Journal officiel Service des publications des Communautés européennes
26. rue Desaix 75727 Paris Cedex 15 Tél. (1)40 58 77 01/31 Fax (1)40 58 77 00
IRELAND
Government Supplies Agency
4-5 Harcourt Road Dublin 2 Tel. (1)66 13 111 Fax (1)47 80 645
Licosa SpA
Via Duca di Calabria 1/1 Casella postale 552 50125 Firenze Tel. (055) 64 54 15 Fax 64 12 57 Telex 570466 LICOSA I
Messageries du livre
5. rue Raiffeisen 2411 Luxembourg Tel 40 10 20 Fax 49 06 61
NEDERLAND
SDU Overheidsinformatie
Exteme Fondsen Postbus 20014 2500 EA s-Gravenhage Tel. (070) 37 89 880 Fax(070)37 89 783
PORTUGAL
OSEC
Stampfenbachstraße 85 8035 Zürich
Tel. (01)365 54 49 Fax (01) 365 54 11
GRAND-DUCHE DE LUXEMBOURG
Imprensa Nacional
Casa da Moeda. EP
Rua D. Francisco Manuel de Melo. 5 1092 Lisboa Codex
Tel. (01 ) 387 30 02/385 83 25 Fax (01) 384 01 32
Distribuidora de Livros Bertrand, Ld.a
Grupo Bertrand, SA
Rua das Terras dos Vales. 4-A Apartado 37
2700 Amadora Codex Tel. (01)49 59 050 Telex 15798 BERDIS Fax 49 60 255
UNITED KINGDOM
HMSO Books (Agency section)
HMSO Publications Centre 51 Nine Elms Lane London SW8 5DR Tel. (071)873 9090 Fax 873 8463 Telex 29 71 138
OSTERREICH
Manz'sche Verlags
und Universitätsbuchhandlung Kohlmarkt 16
1014 Wien Tel. (1)531 610 Telex 112 500 BOX A Fax (1)531 61-181
SUOMI/FINLAND
Akateeminen Kirjakauppa
Keskuskatu 1 PO Box 218 00381 Helsinki Tel. (0) 121 41 Fax (0) 121 44 41
NORGE
Narvesen Info Center
Bertrand Narvesens vei 2 PO Box 6125 Etterstad 0602 Oslo 6 Tel. (22) 57 33 00 Telex 79668 NIC N Fax (22) 68 19 01
SVERIGE
BTJ AB
Traktorvgen 13 22100 Lund Tel. (046) 18 00 00 Fax (046) 18 01 25 30 79 47
ICELAND
BOKABUD LARUSAR BLÖNDAL
Skólavördustig. 2 101 Reykjavik Tel. 11 56 50 Fax 12 55 60
BALGARIJA
Europress Klassica BK Ltd
66. bd Vitosha 1463 Sofia Tel./Fax 2 52 74 75
CESKA REPUBLIKA
NIS CR
Havelkova 22 130 00 Praha 3 Tel. (2) 24 22 94 33 Fax (2) 24 22 14 84
HRVATSKA
Mediatrade
P. Hatza 1 4100 Zagreb Tel.(041)430 392
MAGYARORSZAG
EuroInfoService
Honvéd Europa Haz Margitsziget 1138 Budapest Tel./Fax 1 111 6 0 6 1 1 111 62 16
POLSKA
Business Foundation
ul. Krucza 38/42 00-512 Warszawa Tel. (2) 621 99 93, 628-28-82 International Fax&Phone
(0-39) 12-00-77
ROMANIA
Euromedia
65. Strada Dionisie Lupu 70184 Bucuresti Tel./Fax 1-31 29 646
RUSSIA
CCEC
9.60-letiya Oktyabrya Avenue 117312 Moscow
Tel./Fax (095) 135 52 27
SLOVAKIA
Slovak Technical Library
Nrn. slobody 19 812 23 Bratislava 1 Tel. (7)5220 452 Fax : ( 7 ) 5 2 9 5 785
CYPRUS
Cyprus Chamber of Commerce and Industry
Chamber Building 38 Grivas Dhigenis Ave 3 Deligiorgis Street PO Box 1455 Nicosia
Tel. (2)449500/462312
Fax(2)458630
MALTA
Miller distributors Ltd
PO Box 25
Malta International Airport LOA 05 Malta Tel. 66 44 88 Fax 67 67 99
TURKIYE
Pres AS
Istiklal Caddesi 469 80050 Tünel-Istanbul
Tel. 0(212) 252 81 41 - 251 91 96 Fax 0(212) 251 91 97
ROY International
PO Box 13056
41 Mishmar Hayarden Street Tel Aviv 61130
Tel. 3 496 108 Fax 3 648 60 39
EGYPT/ MIDDLE EAST
Middle East Observer
41 Sherif St. Cairo
Tel/Fax 39 39 732
UNITED STATES OF AMERICA / CANADA
UNIPUB
4611-F Assembly Drive Lanham. MD 20706-4391 Tel. Toll Free (800) 274 4888 Fax (301) 459 0056
CANADA
Subscriptions only Uniquement abonnements
Renouf Publishing Co. Ltd
1294 Algoma Road Ottawa, Ontario K1B 3W8 Tel. (613)741 43 33 Fax (613) 741 54 39 Telex 0534783
AUSTRALIA
Hunter Publications
58A Gipps Street Collingwood Victoria 3066 Tel. (3)417 5361 Fax (3) 419 7154
JAPAN
Kinokuniya Company Ltd
17-7 Shinjuku 3-Chome Shinjuku-ku
Tokyo 160-91 Tel. (03) 3439-0121
Journal Department
PO Box 55 Chitóse Tokyo 156 Tel. (03)3439-0124
SOUTH-EAST ASIA
Legal Library Services Ltd
Orchard PO Box 05523 Singapore 9123 Tel. 73 04 24 1 Fax 24 32 47 9
SOUTH AFRICA
Sarto
5th Floor, Export House Cnr Maude & West Streets Sandton2146
Tel. (011)883-3737 Fax (011) 883-6569
AUTRES
PAYS
OTHER COUNTRIES
ANDERE
LÄNDER
Office des publications officielles des Communautés européennes
TABLE VII
ECU EXCHANGE RATES
=
Jf
eurostat
09/01 09/02 09/05 09/06 09/07 09/08 09/09 09/12 09/13 09/14 09/15 09/16 09/19 09/20 09/21 09/22 09/23 09/26 09/27 09/28 09/29 09/30
B/LFR
39.4690 39.4730 39.4056 39.3678 39.3585 39.3655 39.3821 39.3627 39.4047 39.3881 39.4223 39.4513 39.4613 39.4903 39.5076 39.4746 39.4744 39.5060 39.4691 39.4782 39.4943 39.4980
DKR
7.56282 7.56540 7.55892 7.55827 7.56030 7.56128 7.56234 7.55468 7.55948 7.56065 7.56171 7.55956 7.55982 7.54829 7.54912 7.54129 7.54483 7.53959 7.53796 7.54098 7.53664 7.53412
DM
1.91798 1.91773 1.91382 1.91028 1.90941 1.91158 1.91263 1.91248 1.91454 1.91338 1.91552 1.91667 1.91709 1.91878 1.92032 1.91861 1.91836 1.92038 1.91952 1.91987 1.92066 1.92045
DRA
291.225 291.225 290.861 290.647 290.573 291.038 291.180 291.323 291.469 291.276 291.825 291.892 291.874 292.037 292.254 292.263 292.240 292.549 292.458 292.509 292.770 292.827
ESC
195.314 195.460 195.472 195.467 195.232 194.757 194.948 194.936 195.041 195.116 194.971 194.987 195.157 195.049 195.141 195.540 195.900 195.716 195.578 195.726 195.825 195.780
FF
HFL
IRL
Daily rates: September
6.56200 6.56321 6.55353 6.54935 6.55090 6.55126 6.55277 6.54897 655287 6.54883 6.54881 6.55322 6.55135 6.56065 6.56066 6.55845 6.55913 6.56273 6.55765 6.55527 6.55231 6.55435
2.15173 2.15127 2.14656 2.14260 2.14150 2.14316 2.14405 2.14429 2.14701 2.14619 2.14820 2.14866 2.14967 2.15110 2.15208 2.15023 2.14995 2.15191 2.15073 2.14969 2.15164 2.15115
0.798668 0.797867 0.803088 0.806645 0.808568 0.807232 0.805680 0.806514 0.803933 0.804802 0.803199 0.801035 0.798580 0.795374 0.794483 0.795206 0.796331 0.794142 0.795731 0.795641 0.794478 0.794241
LIT
1921.68 1923.89 1931.61 1942.08 1949.24 1944.25 1944.99 1946.52 1943.90 1942.86 1940.01 1934.74 1939.48 1934.72 1927.66 1939.79 1934.18 1930.92 1930.53 1932.12 1930.71 1931.68
PTA
159.028 159.060 159.138 159.264 159.555 159.126 158.912 158.966 159.009 159.069 158.755 159.056 159.086 158.874 158.687 158.840 158.975 158.962 159.151 159.279 159.131 159.159
UKL
0.789309 0.788714 0.795569 0.799241 0.797689 0.796692 0.794751 0.795558 0.791324 0.794260 0.791956 0.790150 0.788328 0.785700 0.785664 0.785573 0.786875 0.783853 0.786628 0.786124 0.785772 0.785444
USD
1.21238 1.21699 1.23210 1.23643 1.23323 1.23248 1.22447 1.24163 1.24119 1.24302 1.23901 1.23856 1.24043 1.23378 1.23868 1.23861 1.23909 1.23418 1.23776 1.24223 1.24050 1.24100
YEN
121.420 121.394 122.125 122.097 122.090 122.472 121.982 122.958 122.915 122.624 123.034 122.828 122.270 121.404 121.229 121.471 121.431 121.505 121.672 122.571 122.251 122.264
Price (excl. VAT) in Luxembourg: Single copy ECU 11 · Subscription: ECU 79
Of»
OFICINA DE PUBLICACIONES OFICIALES DE LAS COMUNIDADES EUROPEAS KONTORET FOR DE EUROPÆISKE FÆLLESSKABERS OFFICIELLE PUBLIKATIONER AMT FUR AMTLICHE VERÖFFENTLICHUNGEN DER EUROPÄISCHEN GEMEINSCHAFTEN ΥΠΗΡΕΣΙΑ ΕΠΙΣΗΜΩΝ ΕΚΔΟΣΕΩΝ ΤΩΝ ΕΥΡΩΠΑΪΚΩΝ ΚΟΙΝΟΤΗΤΩΝ
OFFICE FOR OFFICIAL PUBLICATIONS OF THE EUROPEAN COMMUNITIES OFFICE DES PUBLICATIONS OFFICIELLES DES COMMUNAUTES EUROPEENNES UFFICIO DELLE PUBBLICAZIONI UFFICIALI DELLE COMUNITÀ EUROPEE BUREAU VOOR OFFICIËLE PUBLIKATIES DER EUROPESE GEMEENSCHAPPEN SERVIÇO DAS PUBLICAÇÕES OFICIAIS DAS COMUNIDADES EUROPEIAS