Extrapolating Survival from Randomized
Trials Using External Data: A Review of
Methods
Christopher Jackson, PhD, John Stevens, PhD, Shijie Ren, MPhil, PhD,
Nick Latimer, PhD, MSc, Laura Bojke, PhD, MSc, Andrea Manca, PhD, MSc,
Linda Sharples, PhD
This article describes methods used to estimate parame-ters governing long-term survival, or times to other events, for health economic models. Specifically, the focus is on methods that combine shorter-term individual-level survival data from randomized trials with longer-term external data, thus using the longer-term data to aid extrapolation of the short-term data. This requires as-sumptions about how trends in survival for each treatment arm will continue after the follow-up period of the trial. Furthermore, using external data requires assumptions about how survival differs between the populations repre-sented by the trial and external data. Study reports from a national health technology assessment program in the
United Kingdom were searched, and the findings were combined with ‘‘pearl-growing’’ searches of the academic literature. We categorized the methods that have been used according to the assumptions they made about how the hazards of death vary between the external and inter-nal data and through time, and we discuss the appropri-ateness of the assumptions in different circumstances. Modeling choices, parameter estimation, and characteriza-tion of uncertainty are discussed, and some suggescharacteriza-tions for future research priorities in this area are given. Key words:internal medicine; detailed methodology; survival analysis; technology assessment; multiparameter evidence synthesis. (Med Decis Making 20XX;XX:000–000)
M
odels for health economic evaluation typicallyuse observed data from randomized controlled trials (RCTs) comparing survival (or times to other events) between competing alternative interven-tions. However, the choice of intervention will often affect outcomes over a longer period than the follow-up time of the RCTs. Policy makers responsible for making funding decisions will then require esti-mates of expected survival for a longer period, and
a lifetime horizon is often appropriate.1 If the
observed follow-up time covers a sufficiently large proportion of the overall survival time, then para-metric models could be used to extrapolate the observed trends in the hazard of death for each treat-ment arm. This is the conventional approach to long-term survival estimation in health technology
assessments,2but it assumes that the observed
haz-ard trends will continue into the long term, which becomes less plausible as the unobserved period in-creases. The extent of uncertainty surrounding any
extrapolation should also be quantified,1,3and this
is difficult to determine from short-term data alone for the same reason.
Received 28 August 2015 from MRC Biostatistics Unit, Cambridge, United Kingdom of Great Britain and Northern Ireland (CJ); University of Sheffield School of Health and Related Research (ScHARR), Shef-field, United Kingdom of Great Britain and Northern Ireland (JS, SR, NL); University of York, Heslington, United Kingdom of Great Britain and Northern Ireland (LB, AM); and University of Leeds, Leeds, United Kingdom of Great Britain and Northern Ireland (LS). This work was sup-ported by the Medical Research Council, grant code G0902159 (‘‘Methods of Extrapolating RCT Evidence for Economic Evaluation’’). The first author also acknowledges support from Medical Research Council grant code U015232027. Revision accepted for publication 4 January 2016.
Supplementary material for this article is available on theMedical Deci-sion MakingWeb site at http://mdm.sagepub.com/supplemental.
Address correspondence to Christopher Jackson, PhD, MRC Biostatis-tics Unit, Cambridge, Institute of Public Health, Forvie Site, Cambridge CB2 0SR, United Kingdom of Great Britain and Northern Ireland; e-mail: [email protected].
ÓThe Author(s) 2016 Reprints and permission:
In general, long-term survival can be reliably esti-mated only if there are long-term data, since the impact of long-term modeling assumptions on the
decision can be substantial.4 Since maximum
follow-up in clinical trials is typically only 1 to 5 y, some external information is required. This could be taken from a disease registry, cohort or the general population, a formally elicited expert belief, or a com-bination of observed data and informal assumptions. Most simply, the external ‘‘information’’ could con-sist of a defensible clinical belief that the risks of death will continue in a particular way in the long term. The National Institute for Health and Care Excellence
(NICE) for England and Wales1 recommends that
any extrapolation should be assessed by ‘‘both clini-cal and biologiclini-cal plausibility of the inferred outcome as well as its coherence with external data sources,’’ although it does not suggest specific methods to do this. A number of other national funding agencies have a similar requirement for long-term outcomes
predictions.5 This article discusses methods that
have been applied to use external data explicitly to facilitate survival extrapolation, as well as their merits in different circumstances. Below we describe the scope and provide the terminology used throughout the article.
We consider situations where we have both of the following sources of data.
RCTs providing estimates of the relative treatment effect on survival for the patients of interest, with individual-level survival or censoring times available for at least 1 treatment arm (either directly or esti-mated from published Kaplan-Meier curves6).
Information on longer-term survival from another source, describing a population with some character-istics (to be discussed later) in common with the patients of interest. After some adjustments, these data can be used to estimate the baseline long-term survival of the patients of interest. If any treatments are given, this is unrecorded, so these data give no information about intervention effects.
We assume the trial data are representative of the population for which the decision is required. In practice, however, given the selection criteria of
tri-als, this will not always be strictly true,7–9 which
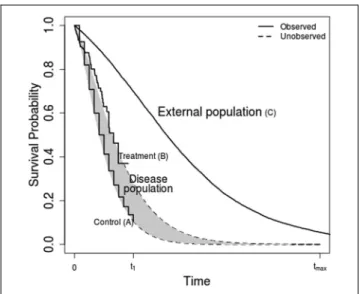
we will briefly discuss at the end of the article. The data and extrapolation problem are illustrated by the hypothetical survival curves in Figure 1. Each of the 3 ‘‘observed’’ curves are representative samples of survival from the populations labeled A, B, and C. The population of interest receiving a control inter-vention is labeled A, the population of interest
receiving the intervention of interest is labeled B, and the external population is labeled C. The survivor functions assumed to generate each data set are
labeledSAðtÞ,SBðtÞ, andSCðtÞ, respectively. We also
define the cumulative hazard HkðtÞ5 logðSkðtÞÞ
and hazard (or mortality) hkðtÞ5dHkðtÞ=dt for each
groupk5A;B;C. The main quantity of interest, the
difference in expected survival between interven-tions, is
ðtmax
0
SBðtÞ SAðtÞ
f gdt;
which is illustrated by the shaded area between the 2
curves. The upper limit tmax is commonly infinite,
giving the lifetime incremental survival.
In the conventional approach,2SAðtÞandSCðtÞare
estimated by parametric models fitted to the A and B
data for t\t1, which are extrapolated to t.t1 to
obtain the incremental survival, without explicitly considering external long-term validity. Instead, we discuss approaches that combine the information
onSBðtÞandSAðtÞfort\t1, with external information
onSCðtÞfort\tmax, through assumptions about:
How survival will differ between the population of interest and the external population. Specifically, howSCðtÞcompares toSBðtÞandSAðtÞin the interval t\t1may give information about howSCðtÞcompares
to the disease population survival aftert.t1.
SBðtÞandSAðtÞfort.t1are related toSBðtÞandSAðtÞ
fort\t1.
Commonly, instead of using this formula directly to
calculate the incremental survival, SAðtÞ and SBðtÞ
are used to obtain parameters in state-transition or similar decision-analytic models, which also allow discounted expected costs and quality-adjusted sur-vival to be estimated for each competing alternative.
In this article, we focus on howSAðtÞandSBðtÞ
them-selves can be estimated using external long-term data and what assumptions are necessary to enable their estimation.
To find methods that have been used for survival extrapolation in cost-effectiveness analysis using external data, we searched the reports of studies car-ried out under the National Institute of Health Research Health Technology Assessment Programme in the United Kingdom and searched academic liter-ature, focused on health economics and medical statistics journals, using ‘‘pearl-growing’’ search
methods.10 The exact search strategy, and a broad
classification of the 38 relevant papers that we found, are given in the online appendix. In this article, we summarize the methods that have been used, discuss their appropriateness in different circumstances, and suggest where further research might be focused.
POTENTIAL EXTERNAL DATA SOURCES
The long-term survivor function for the external
data source SCðtÞ may be estimated from national
administrative data on population survival, disease registries, cohort studies, or elicited expert belief. Typical life-tables published by national statistics authorities provide age, sex, country, year, and cause-specific annual survival probabilities, which can be used to estimate lifetime survival for the gen-eral population. External data may also consist of cohorts of patients who are similar to the patients of interest. This could include national or regional reg-istries (such as cancer regreg-istries), or hospital-based cohorts including all patients with a particular condi-tion or receiving a particular treatment, from a partic-ular period of time. There may even be data from randomized trials in a similar population with a lon-ger follow-up. The advantages of registry or cohort data compared to unselected national population data are that the patient population may be more rep-resentative of the target population, and relevant covariates are more likely to be recorded. However, they may not necessarily have follow-up times cover-ing the whole lifetimes of all participants.
FRAMEWORK FOR SURVIVAL EXTRAPOLATION USING EXTERNAL DATA
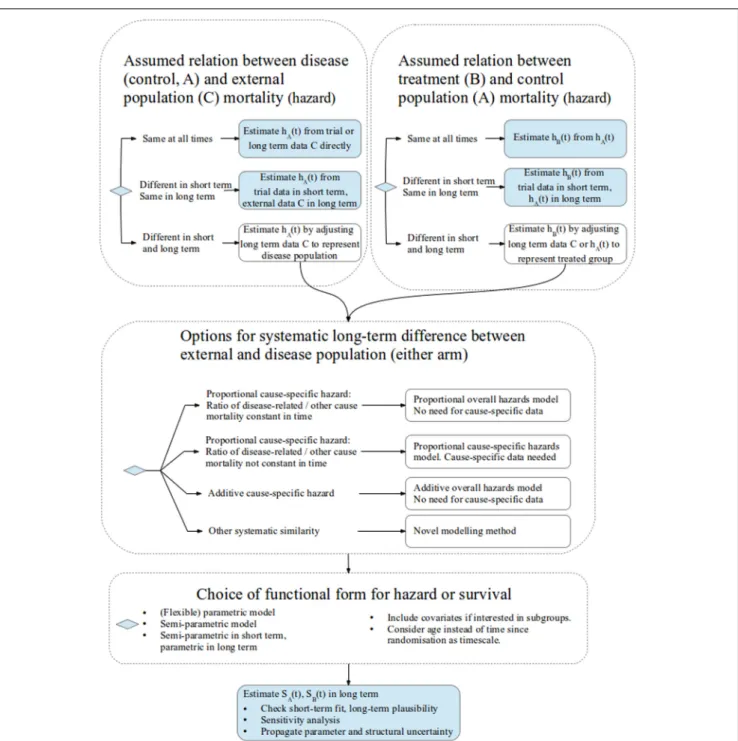
Figure 2 illustrates the choices that need to be made when using external data for survival extrapolation. The structure is based on our categorization of differ-ent methods used in the literature and our judgmdiffer-ent of when they are appropriate. Each of the next few sec-tions of the article discusses a different portion of the figure in detail. Here, we give a brief overview.
First, researchers should identify if the external population (C) has the same mortality at all times, or at least in the long term, as that of the disease pop-ulation receiving a control intervention (A, top-left panel) and the disease population receiving the inter-vention of interest (B, top-right panel). In this case, the data can then be used directly to estimate each
SkðtÞwithout adjustment.
Otherwise, the long-term mortality of populations A and C (and/or B and C) is assumed to be different but is systematically similar in such a way that the external data (C) can be adjusted to estimate the long-term mortality for the target population with the disease (A or B). The assumptions that have been used to do this are represented by the large mid-dle panel of the figure.
Once any systematic similarity between the inter-nal and exterinter-nal data has been characterized, completing the analysis requires a choice of the
func-tional form for each of theSkðtÞ, potential covariate or
subgroup adjustment, parameter estimation, uncer-tainty, and sensitivity analysis. These issues are dis-cussed later. Some suggestions for future research priorities are made, concentrating on how uncer-tainty about assumptions is represented and the role of ‘‘soft’’ or elicited information.
DIFFERENCE IN MORTALITY BETWEEN THE DISEASE AND EXTERNAL POPULATIONS
Disease and External Populations Have the Same Mortality at All Times
Sometimes, the disease or baseline intervention of interest is not expected to affect mortality; for exam-ple, it may affect only quality of life. Then, long-term survival of the patients of interest can be assumed to be the same as that of the national popu-lation of a similar age and sex distribution and taken
directly from the relevant life-table.11,12
This assumption may also hold if the disease or baseline intervention affects mortality, but the external data come from a disease registry or cohort of patients
having the same disease and/or intervention, so that the survival of the control group in the trial data is
the same as that of the external population.13–19
Disease and External Populations Have the Same Mortality after Some Time
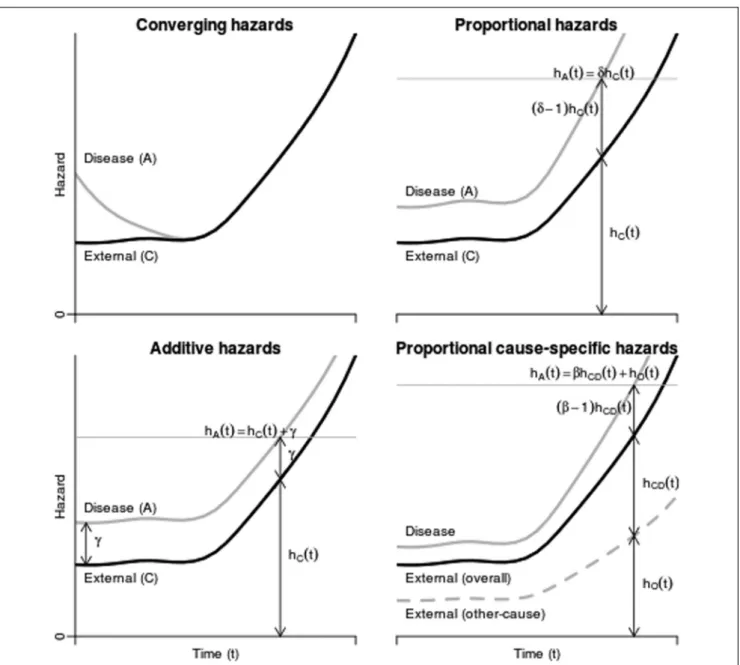
In other cases, the disease population may have a higher initial mortality than does the general popu-lation, but this decreases until at some time (after
t5tc, say) its death rate converges to the mortality
of that of the general population20–29 (Figure 3, top
left).
hAðtÞ5hBðtÞ5hCðtÞfor all t.tc:
Iftc<t1, wheret1is the follow-up time of the RCT,
survival fort<tcandt.tccan be taken directly from
the trial data and the life-table data, respectively.
Oth-erwise, iftc.t1, short-term extrapolations from
para-metric models fitted to the individual-level data from the RCT might be used to estimate the survival
prob-ability between t1 and tc.25,29,30 If the hazard is
decreasing in the short term, extrapolating directly from a parametric model might then lead to hazards that are lower than those of the age/sex-matched gen-eral population, which is assumed to be implausible; therefore, using the life-table data is more
appropri-ate.tc is sometimes interpreted as a ‘‘cure’’ time, so
that all patients who survive this long are assumed to be ‘‘cured’’ and to have mortality equivalent to
that of the general population. Messori and Trippoli27
also suggested that a compromise between ‘‘cured’’ population survival and ‘‘uncured’’ extrapolated sur-vival might sometimes be appropriate—see the
mod-els originating from Boag,31 discussed later in this
article, for examples.
Disease and External Populations Have Different Mortality in the Short and Long Term
If the mortality of patients with the disease is dif-ferent from that of the population represented by
the external data at all timest\tmax, then
extrapola-tion might be achieved by adjusting the external evi-dence to make it more representative of the target population. This requires an assumption that mortal-ity is systematically different between the popula-tions in the long term, in a way that can be determined from the short-term data or informal beliefs. For example, there may be proportional or additive hazards for all-cause or cause-specific mor-tality between the disease and external populations. These assumptions are discussed in detail later.
DIFFERENCE IN MORTALITY BETWEEN THE TREATMENT AND CONTROL POPULATIONS
A similar decision should be made about the dif-ference in mortality between the intervention and control groups (B and A, respectively). If the interven-tion is not expected to affect mortality (e.g., if it affects
only quality of life), then SBðtÞ can be assumed to
equalSAðtÞfor all times. If the relative intervention
effect is expected to diminish to null soon after the
end t1 of the trial data, then hBðtÞ can be assumed
to equalhAðtÞin the long term, and it is sufficient to
estimatehAðtÞ.
SBðtÞcould then be estimated by combining a
pub-lished relative treatment effect from trials,32,33with
the extrapolatedSAðtÞ. The assumptions required to
do this are analogous to those required to extrapolate differences between the disease and external popula-tions; typically, the hazard ratio between treatment groups for all-cause or cause-specific mortality might
be assumed to be constant in perpetuity. Or, if indi-vidual data are available for the intervention as well
as for the control arm of the trial,SBðtÞcould be
pro-duced independently ofSAðtÞby using external data
and a similar method to that used to estimateSAðtÞ.
Even without external data, SBðtÞ and SAðtÞ are
commonly estimated independently, by parametric
extrapolation.2This still assumes implicitly that the
short-term differences between the treatment groups are representative of the long term. Bagust and
Beale30 discuss how knowledge of the treatment’s
mechanism of action might be used to guide long-term estimation; for example, the effects of a drug might take some time to achieve after starting treat-ment and dissipate gradually when treattreat-ment stops.
The assumption about how the relative treatment
effect is likely to change as t increases from t1, the
end of trial follow-up, to the time horizon for the deci-sion model is likely to be an important driver of
which intervention is preferred.34 It is therefore
important to consider uncertainty about this assump-tion. The fundamental problem is that information about this effect is available only in the trial data,
not in the long-term data C. NICE1recommends that
3 alternative scenarios be considered, corresponding to pessimistic, optimistic, and compromise assump-tions about the long-term effect of a treatment that is effective in the short term. For example, expressing
the effect as a hazard ratiohBðtÞ=hAðtÞ, the effect for
t.t1could be
(a) null, so thathBðtÞ=hAðtÞ51fort.t1;
(b) the same as in the short term, thus hBðtÞ= hAðtÞ5expðbÞ, assumed constant for allt; or
(c) diminishing in the long term, thus hBðtÞ=hAðtÞis
increasing fromexpðbÞto 1.
Beyond informal sensitivity analysis, we did not find any literature where external information, such as elicited beliefs or the effects of related treatments with longer follow-up, was used formally to quantify future changes in expected treatment effects on survival.
ADJUSTING EXTERNAL DATA TO REPRESENT THE POPULATION OF INTEREST
If patients with the disease (under either interven-tion) and the external population have different long-term mortality, then one of the following
assumptions might be used to estimate SAðtÞ by
adjusting the long-term external data, and similar
Proportional Hazards for All-Cause Mortality between the Disease and External Populations
Several authors35–37obtained cause-specific
mor-talities hAðtÞ by multiplying those estimated from
life-tableshCðtÞby a constant hazard ratio obtained
from literature or literature combined with expert
belief.38 These studies assumed proportional
hazards; that is, the hazard ratio between the disease-specific and general populations is constant over time (Figure 3, top right).
hAðtÞ5dhcðtÞ;equivalently SAðtÞ5SCðtÞd:
This is sometimes implemented approximately by assuming the probabilities of death over a short period of time (e.g., the cycle length of a state-transition model) are proportional, instead of the haz-ards (the instantaneous rates of death, which are not
probabilities39). Instead of taking the hazard ratio
from the literature, Demiris and Sharples40estimated
it using a joint statistical model for the disease-specific and external data.
Proportional Cause-Specific Mortality
The proportional hazards assumption can be con-venient since comparisons of mortality between groups are often published as hazard ratios. However, all-cause mortality may not be proportional. For example, consider the causes of death that contribute
to overall mortality. Let hAðtÞ5hADðtÞ1hAOðtÞ,
wherehADðtÞis the hazard for disease-related
mortal-ity, and hAOðtÞ is the hazard for mortality from all
other causes in population A. Similar notation is used for populations B and C. Mortality from causes unrelated to the disease of interest can typically be assumed to be the same between patients with the disease and the external population, so that
hAOðtÞ5hBOðtÞ5hCOðtÞ5hOðtÞ:
Mortality for disease-related causes is typically higher. Suppose the hazards for disease-related
mor-tality are proportional, so thathAðtÞ5ghCDðtÞ1hOðtÞ
(Figure 3, bottom right). This is equivalent only
to an all-cause proportional hazards model
hAðtÞ5dhCðtÞ5dðhCDðtÞ1hOðtÞÞ if hCDðtÞ=hOðtÞ is independent of time. In other words, assuming pro-portional all-cause hazards would be valid only if dis-ease-related mortality were a constant proportion of the overall mortality in the external population as
time elapses. Benaglia and others41 estimated the
likely extent of bias in various situations when this assumption is wrongly applied.
To implement a proportional cause-specific
haz-ards model, estimates of hCDðtÞand hOðtÞ can often
be obtained from cause-specific population mortality rates published by national agencies. As with the
all-cause hazard ratio, the all-cause-specific hazard ratiog
for disease populations relative to the external popu-lation might be obtained from the literature or estimated from short-term comparisons between
internal and external data.42–44 The cause-specific
hazard for the intervention grouphBDðtÞcan be
esti-mated similarly by multiplyinghADðtÞby a published
constant treatment-specific hazard ratio, represent-ing the effect of the intervention on cause-specific mortality. This supposes, however, that the causes of death targeted by the intervention are the same as the causes that distinguish the disease population from the general population, which may need to be
investigated.41
In Benaglia and others,41cause-specific death rates
were published in the population life-tables; thus,
hCDðtÞand hOðtÞcould be obtained easily. However, they were not published in the disease-specific individual-level survival data A. To overcome this
and estimate g, since the overall hazard for the
dis-ease population is defined ashAðtÞ5hADðtÞ1hOðtÞ,
a poly-hazard model45 could be applied, which
decomposes the hazard for all-cause mortality as the sum of cause-specific hazards. Specifically, a poly-Weibull model was used for the internal data A, where the cause-specific hazards are both Weibull, and Weibull models were simultaneously applied to the external data. The common other-cause hazard assumption and proportional cause-specific hazard assumption then enabled the parameters of all hazard functions to be estimated through a joint model for populations A and C. This model implicitly assumes that the disease has no effect on hazards that have not been defined as disease-related in the external data, which cannot be tested unless deaths occurring in the internal trial patients also have the cause of death recorded.
A related method, originating from Boag,31
assumes a certain proportion of patients are cured and estimates a parametric survival function for the noncured patients. The cure fraction and the param-eters of the noncured survival function are estimated jointly from individual data on survival and disease
status. Hisashige and others26 and Maetani and
others46 used this approach to obtain a
disease-related survival curveSADðtÞfor the patients of
functions correspond to related and disease-unrelated survival, respectively. A disease-disease-unrelated
survivor function SCOðtÞ is obtained from age- and
sex-matched life-table data. The overall extrapolated survivor function is then calculated as the product of the disease-related and unrelated survival, assuming equivalency to the above assumption of proportional cause-specific and identical other-cause hazards:
SAðtÞ5SADðtÞSAOðtÞ;SAOðtÞ5SCOðtÞ:
Additive Hazards for All-Cause Mortality between the Disease and External Populations
Instead of a constant risk ratio between internal
and external data sources, some authors47–49 have
assumed that the disease-specific population had a constant additive excess hazard compared to the general population (Figure 3, bottom left).
hAðtÞ5hCðtÞ1a:
Under this assumption, it can be shown47 that
logitðSAðtÞ=SCðtÞÞ converges to a linear function as
t increases. Thus, the slope of a linear regression
fitted to the latter part of observed data on
logitðSAðtÞ=SCðtÞÞfor t\t1 gives an estimate of a.
Extrapolations of SAðtÞfor t.t1 can then be
calcu-lated given the estimate ofa. Demiris and Sharples40
also investigated additive hazard models within a Bayesian framework. An advantage of additive haz-ards is that cause-specific modeling is less important. If disease-related hazards are additive, so that
hADðtÞ5hCDðtÞ1a and then hAðtÞ5hCDðtÞ1a1
hOðtÞ5hCðtÞ1a, so the additive all-cause hazard
model also holds, and the cause-specific risk
differ-ence a is equal to the all-cause risk difference
hAðtÞ hCðtÞ. The risk difference (or excess risk) is straightforward to interpret, and under the additive hazard model, it is independent of time. A propor-tional hazards model, however, is multiplicative, so that the excess risk depends on the baseline risk. Informally, the disease has a greater effect on people (such as older people) who are already at a higher risk of death, which is typical for a chronic disease.
The short-term fit of either the proportional or additive hazards assumption can be checked from
the data by diagnostic plots2,30or by embedding in
a model that contains both as special cases, as
dis-cussed by Breslow and Day.50 The assumptions
required to apply either in the long term, however, are untestable from data.
Other Models for Parameterizing Mortality Differences between Populations
Other ways of parameterizing difference in survival between groups include accelerated failure
time models, in which SAðtÞ5SCðdtÞ, so that the
expected survival time in group C is d times
the expected survival time in group A, although we are unaware of these having been used in the context of survival extrapolation with external data. Nonpro-portional, nonadditive hazard models might also be used where the hazard ratio or excess hazard is a pre-dictably varying function of time. For example,
Andersson and others51extrapolated survival of
can-cer patients by combining cancan-cer cohort and life-table data and modeling the log cumulative excess hazard for cancer patients as a cubic spline function of log
time,52assuming a linear trend in the long term.
SURVIVAL MODEL CHOICE WHEN COMBINING INTERNAL AND EXTERNAL DATA
To complete the estimation and to characterize the long-term differences between the disease and
exter-nal population survival SAðtÞ and SCðtÞ as well as
between the treatment and control survival SBðtÞ
andSAðtÞ, the form of each survival function needs
to be specified.
Without external data, extrapolation ofSAðtÞand/
orSBðtÞis typically2based on a parametric functional
form for each survival curve. With external data,
a parametric function could be specified for SCðtÞ
and fitted to the external data and assumptions
such as proportional hazards used to derive SAðtÞ
and SBðtÞ. To convert annual probabilities of death
published in life-tables to individual-level survival times, which allows a survival model to be fitted,
sev-eral authors40,41,47,48have used simulation.
Alternatively, survival extrapolation can be per-formed semiparametrically with external data if these
are available up tot5tmaxand if a systematic
differ-ence between the external and internal populations can be assumed, such as proportional or additive
haz-ards.40,47,48 This has the advantage of avoiding the
risk of misspecifying the baseline survival function.
Fang and others47 used semiparametric models,
which gave plausible estimates where even a 3-parameter generalized gamma model did not. A hybrid approach is also possible, using
nonparamet-ric estimates up to some t\t1 and parametric
assumptions to extrapolate,30 although the results
However, if the parametric form fits well, then fully parametric models can lead to greater precision
in estimates.54 The advantages of parametric and
semiparametric models are combined in a class of flexible parametric models based on modeling the log hazard as a spline, or piecewise cubic, function
of log time,52,55which can adapt to represent survival
arbitrarily well. Since these models are fully paramet-ric, they enable extrapolation beyond the times
observed in the data.56The spline function is defined
to be smooth, and given a particular number of pieces, results have been shown to be not sensitive to the
choice of where to subdivide the log time axis.55
Therefore, we would expect extrapolations from this model to be more robust than those from the ‘‘hybrid’’ approach mentioned above. Guyot and
others56 used these models, implemented in the
BUGS software,57 for survival extrapolation using
a combination of trial and long-term external data. They can also be fitted to single survival data sets
using Stata58 and R.59 Also, unlike the Cox model,
they permit nonproportional hazards to be modeled52
and extrapolated if necessary.51
The choice between alternative parametric models for extrapolation is conventionally based on fit to the
short-term data A, B.2However, as recommended, for
example, in the NICE guidelines,1long-term
plausi-bility should be considered based on external infor-mation such as knowledge of the disease, treatment
and trial protocol,30 or related long-term survival
data. External information could simply be used to inform the choice of model for extrapolation or to inform particular parameters of a chosen model. A plausible distribution might be chosen to represent how the hazard of death is expected to change over time. For example, the exponential distribution cor-responds to a constant hazard, which is generally unrealistic in the long term as the hazard will increase as people get older. Therefore, even though data might suggest a constant hazard over the dura-tion of the RCT, distribudura-tions that allow changes in hazards over time are likely to be more appropriate.
Bagust and Beale30also discuss how the apparent
bet-ter fit of some parametric models may be an artifact of between-patient heterogeneity; for example, a Wei-bull distribution with shape less than 1 could be explained by a mixture of 2 subpopulations with dif-ferent constant hazards.
Once the most appropriate model family has been chosen, its parameters can be estimated; this might be done using a combination of disease-specific data A and external evidence C. For example, Nelson and
others60used a 2-parameter Gompertz model, which
has an exponentially increasing hazard, to extrapo-late survival beyond the follow-up of an RCT. The parameter governing the baseline hazard was estimated using disease-specific data, and the hazard
‘‘acceleration’’ parameter was estimated from
national population life-tables including older people.
When long-term data are not available or sparse, expert belief about long-term survival might be eli-cited to either choose the parametric form or estimate particular parameters, as we discuss later.
EXPLAINING POPULATION DIFFERENCES THROUGH OBSERVED COVARIATES
Under models such as the proportional or additive hazards specifications described above, the long-term difference between the populations underlying the trial and external data is characterized by a param-eter such as the all-cause or cause-specific hazard
ratio dorgor risk differencea. This is sufficient to
estimate long-term survival of the trial population if the model assumptions hold. However, we may also want to explain this difference in terms of the charac-teristics of the people represented, for example, to estimate survival for subgroups of the population with certain characteristics. This is possible if rele-vant covariates are recorded in each source of
evi-dence. Nelson and others,60 for example, used
a proportional hazards model in which the log hazard ratio for all-cause mortality is a linear function of the covariates that distinguish the data sets. The covari-ate effects were estimcovari-ated using a semiparametric model fitted to the long-term external data, to obtain
an expression for survival Sðt;x;bÞas a function of
covariate values x and covariate effects b. The
sur-vival for group A, SAðtÞ, was estimated for all t by
averaging Sðt;x;bÞ over all covariate values x
observed in the data A. This approach assumes that the form of the relationship with covariates is the same between populations A and C, which may not be true. For example, the relationship of the log haz-ard of death with age may be linear among younger people but nonlinear among older people.
It is common to assume that the increase in the haz-ard of death as a person gets older is fully explained by his or her increasing age. Thus, survival extrapola-tions often rely principally on modeling how the haz-ard increases with age. Population-based data commonly cover a wide range of ages and calendar periods. To exploit this diversity, Nelson and
and cohort data in an age metric, where thetinSAðtÞ
andSCðtÞrepresents age rather than time since
diag-nosis or randomization to treatment. This assumes that hazards change through time only with increas-ing age, although the shape of this dependence was modeled nonparametrically, with no further distribu-tional assumptions.
Without long-term follow-up data, age effects on mortality could be estimated from shorter-term data on individuals with widely varying ages at baseline.
Speight and others13 estimated long-term cancer
survival using registry data in this way. The (within-person) increase in the risk of death as a per-son gets older was assumed to equal the risk ratio between people with different baseline ages.
REPRESENTING UNCERTAINTY AND PARAME-TER ESTIMATION
It is important to characterize uncertainty in all
model inputs and ‘‘structural’’ model choices3 in
order to determine the uncertainty surrounding the treatment decision and assess the value of further research. In the presence of substantial decision uncertainty, the treatment might be recommended for use only in research or with otherwise limited
coverage.61If parameters used to extrapolate survival
are estimated from data, the uncertainty inherent in estimating them can be handled by probabilistic
methods. For example, in Fang and others,47
uncer-tainty about the estimation of the hazard increment
bwas propagated through the model to the estimated
survival curve by bootstrapping. Alternatively,
beliefs aboutbcould be represented by a probability
distribution in a standard probabilistic sensitivity analysis. Uncertainty about the choice of parametric model can be represented by choosing a sufficiently flexible model form, such as a spline-based or
gener-alized gamma distribution,56and, if the level of
flex-ibility required is uncertain and different plausible
models give different results, using model
averaging.62
Bayesian methods are particularly suited to
com-bining evidence from different sources in a model.63
The process involves defining a joint model with shared parameters representing the aspects that the different sources of data have in common (e.g., mor-tality for causes other than the disease of interest) and different parameters for the parts where they are expected to differ (e.g., cause-specific mortality). The posterior distributions of model outputs (such as incremental expected survival) are estimated
simultaneously conditional on all data, and the uncertainty about the model inputs is propagated to the outputs. This approach has been used for combin-ing data in the context of survival
extrapola-tion,40,41,56,64 as well as in many other decision
modeling contexts.65,66 External aggregate data or
expert beliefs and associated uncertainty can be included as prior distributions, for example,
pub-lished hazard ratios obtained from meta-analysis.41
A potentially more important uncertainty may arise in how the differences between the external and internal data are modeled—in other words, whether assumptions, such as those set out in this article, are valid in the long term. This is more prob-lematic to identify from data; therefore, elicited beliefs might be used instead.
USING ELICITED BELIEFS IN SURVIVAL EXTRAPOLATION
Expert elicitation has been used to estimate
uncer-tain quantities in health economic models,67,68
although we are unaware of this approach having been used in survival extrapolation. Here, we discuss the potential and challenges.
For example, beliefs about long-term survival might be elicited directly. Suppose that expert belief
suggested that the 5-y survival probability, Sð5jlÞ,
(assuming t1\5) was most likely to be around 0.2
but could be as high as 0.3 or as low as 0.1. Assuming an exponential survival model, this belief about
Sð5jlÞ5expð5lÞcould be translated to a prior
dis-tribution for the rate l5 logðSð5jlÞÞ=5. Bayesian
inference could then be used to combine this prior for long-term survival with the survival data for
t\t1. More complex and realistic parametric models
would be more challenging. For example, in a Weibull
model, eliciting expected survival Sðtja;lÞ5
expð ltaÞcould provide a distribution forlta, but
extra assumptions would be needed to obtain
sepa-rate priors forlanda. To our knowledge, there has
been no investigation of this. Survival estimates would need to be elicited at multiple time points to provide information about multiple parameters or to suggest an appropriate distributional form. Quanti-ties are most easily elicited if expressed on an
inter-pretable scale.69 Here, that could be the expected
number out of 100 patients who will survive 5 y and 10 y, but it may be difficult to convert such infor-mation to priors for parameters. Expressing the
eli-cited information as an artificial extra data set,70
data augmented with the additional data, may be a useful technique to investigate.
If some of the assumptions used to extrapolate are uncertain, then sensitivity analysis should be per-formed. The most basic form of sensitivity analysis is to present results under alternative scenarios and assumptions; however, scenario analyses can be diffi-cult to interpret. Instead, the model might be extended by adding extra parameters representing these uncertain features, with prior distributions eli-cited from experts, then observing how the results are
affected.71For example, to assess the assumption of
a constant hazard ratio between treatment groups, the treatment effect in the extrapolated period could be represented by a parametrically decreasing func-tion of time, and plausible values for the parameter(s) could be elicited. This allows the associated decision uncertainty to be formally quantified and ‘‘value of information’’ methods used to determine whether it is worth doing further research to assess the
assump-tion.72 Even without elicited information, informal
beliefs could be used to demonstrate, for example, that the decision about which treatment would be preferred is robust within a plausible range of assumptions about some parameter. This might involve showing that the cumulative incremental net benefit of the intervention of interest is unlikely to cross the decision threshold in the period of time
being extrapolated over.73
More research and experience are needed on the accuracy (and cost) of different methods to elicit uncertain quantities, ways to combine beliefs of dif-ferent experts, what quantities should be elicited in this context, how best to use elicited information in models, and how the results can be communicated to decision makers.
SUMMARY AND RESEARCH PRIORITIES
Survival extrapolation given short-term data is a challenging task, involving prediction of data that have not been observed. Data on a related long-term population can often be exploited, but the necessary assumptions about how the populations differ, and how short-term trends might continue into the long term, must be clearly expressed and examined for plausibility and consistency with external data. This article reviews typical assumptions that might be made. However, we may sometimes not be confi-dent in making any of these assumptions—it may be unclear whether the external data are relevant or how to explain differences between the data sets.
The information required to adjust the external pop-ulation to represent the internal poppop-ulation may not be available, for example, a marker of disease sever-ity. In those cases, careful sensitivity analysis and characterization of uncertainty will be important. Since long-term assumptions, such as proportional hazards, are untestable from data, they should be clearly explained and justified to decision makers. More experience is needed in situations where nei-ther proportional nor additive hazards assumptions are appropriate to distinguish the external and dis-ease populations, and similarly when the treatment effect or other key parameters are not constant or oth-erwise predictable in the long term. Important open questions concern how ‘‘soft’’ information, such as formally elicited beliefs or the analyst’s own assumed distribution for uncertain quantities, can be obtained and used in modeling. Finally, we assumed that the trial data are representative of the target population that will ultimately receive the treatments of interest. This is not always true given the selection criteria of trials, although is more plausible for the phase III, pragmatic trials that typically inform
cost-effective-ness models. Various authors7–9 have suggested
methods and conditions for using external evidence to adjust the treatment effect from a trial to obtain the effect in an overlapping but nonidentical popula-tion. The covariate adjustment methods we discussed may also be used to explain differences in baseline survival between populations, if the relevant covari-ates are recorded.
ACKNOWLEDGMENTS
Thanks to the rest of the project team, including Alan Brennan, Patrick Fitzgerald, Miqdad Asaria, Ronan Mahon, and Steve Palmer.
REFERENCES
1. National Institute for Health and Care Excellence. Guide to the methods of technology appraisal. Available from: URL: https:// www.nice.org.uk/article/pmg9
2. Latimer NR. Survival analysis for economic evaluations along-side clinical trials: extrapolation with patient-level data: inconsis-tencies, limitations, and a practical guide. Med Decis Making. 2013;33(6):743–54.
4. Kim LG, Thompson SG. Uncertainty and validation of health economic decision models. Health Econ. 2009;19(1):43–55. 5. Kleijnen S, George E, Goulden S, et al. Relative effectiveness assessment of pharmaceuticals: similarities and differences in 29 jurisdictions. Value Health. 2012;15(6):954–60.
6. Guyot P, Ades A, Ouwens MJ, Welton NJ. Enhanced secondary analysis of survival data: reconstructing the data from published Kaplan-Meier survival curves. BMC Med Res Methodol. 2012; 12(1):9.
7. Imai K, King G, Stuart EA. Misunderstandings between experi-mentalists and observationalists about causal inference. J R Stat Soc Ser A Stat Soc. 2008;171(2):481–502.
8. Hartman E, Grieve R. From sample average treatment effect to population average treatment effect on the treated: combining experimental with observational studies to estimate population treatment effects. J R Stat Soc Ser A Stat Soc. 2015; 178(3):757–78.
9. Stuart EA, Cole SR, Bradshaw CP, Leaf PJ. The use of propensity scores to assess the generalizability of results from randomized tri-als. J R Stat Soc Ser A Stat Soc. 2001;174(2):369–86.
10. Ramer SL. Site-ation pearl growing: methods and librarianship history and theory. J Med Libr Assoc. 2005;93(3):397–400. 11. Imamura M, Abrams P, Bain C, et al. Systematic review and economic modelling of the effectiveness and cost-effectiveness of non-surgical treatments for women with stress urinary inconti-nence. Health Technol Assess. 2010;14(40):1–188.
12. Carlton J, Karnon J, Czoski-Murray C, Smith K, Marr J. The clin-ical effectiveness and cost-effectiveness of screening programmes for amblyopia and strabismus in children up to the age of 4–5 years: a systematic review and economic evaluation. Health Technol Assess. 2008;12(25):iii, xi–194.
13. Speight P, Palmer S, Moles D, et al. The cost-effectiveness of screening for oral cancer in primary care. Health Technol Assess. 2006;10(14):1–144.
14. Main C, Palmer S, Griffin S, et al. Clopidogrel used in combina-tion with aspirin compared with aspirin alone in the treatment of non-ST-segment-elevation acute coronary syndromes: a systematic review and economic evaluation. Health Technol Assess. 2004; 8(40):1–141.
15. Burch J, McKenna C, Palmer S, et al. Rimonabant for the treat-ment of overweight and obese people. Health Technol Assess. 2009;13(suppl 3):13–22
16. Robinson M, Palmer S, Sculpher M, Philips Z, Ginnelly L, Bowens A, et al. Cost-effectiveness of alternative strategies for the initial medical management of non-ST elevation acute coro-nary syndrome: systematic review and decision-analytical model-ling. Health Technol Assess. 2005;9(27):1–158.
17. Wilson J, Connock M, Song F, et al. Imatinib for the treatment of patients with gastrointestinal stromal tumours. Health Technol Assess. 2005;9(25):1–142.
18. Bond M, Pitt M, Akoh J, Moxham T, Hoyle M, Anderson R. The effectiveness and cost-effectiveness of methods of storing donated kidneys from deceased donors: a systematic review and economic model. Health Technol Assess. 2009;13(38):1–156.
19. Takeda A, Cooper K, Bird A, et al. Recombinant human growth hormone for the treatment of growth disorders in children:
a systematic review and economic evaluation. Health Technol Assess. 2010;14(42):1–209.
20. Grant A, Wileman S, Ramsay C. The effectiveness and cost-ef-fectiveness of minimal access surgery amongst people with gastro-oesophageal reflux disease: a UK collaborative study. The REFLUX Trial. Health Technol Assess. 2008;12(31):1–181.
21. Peek GJ, Elbourne D, Mugford M, et al. Randomised controlled trial and parallel economic evaluation of conventional ventilatory support versus extracorporeal membrane oxygenation for severe adult respiratory failure (CESAR). Health Technol Assess. 2010; 14(35):1–46.
22. Chambers D, Paulden M, Paton F, et al. Sugammadex for the reversal of muscle relaxation in general anaesthesia: a systematic review and economic assessment. Health Technol Assess. 2010; 14(39):1–211.
23. Hind D, Ward S, De Nigris E, Simpson E, Carroll C, Wyld L. Hormonal therapies for early breast cancer: systematic review and economic evaluation. Health Technol Assess. 2007;11(26): 1–134.
24. Main C, Pitt M, Moxham T, Stein K. The clinical effectiveness and cost-effectiveness of rituximab for the first-line treatment of chronic lymphocytic leukaemia: an evidence review of the submis-sion from Roche. Health Technol Assess. 2010;14(suppl 2):27–32. 25. Aballe´a S, Chancellor JV, Raikou M, et al. Cost-effectiveness analysis of oxaliplatin compared with 5-fluorouracil/leucovorin in adjuvant treatment of stage III colon cancer in the US. Cancer. 2007;109(6):1082–90.
26. Hisashige A, Yoshida S, Kodaira S. Cost-effectiveness of adju-vant chemotherapy with uracil–tegafur for curatively resected stage III rectal cancer. Br J Cancer. 2008;99(8):1232–8.
27. Messori A, Trippoli S. A new method for expressing survival and life expectancy in lifetime cost-effectiveness studies that eval-uate cancer patients (review). Oncol Rep. 1999;6(5):1135–41. 28. Viscomi S, Pastore G, Dama E, et al. Life expectancy as an indi-cator of outcome in follow-up of population-based cancer regis-tries: the example of childhood leukemia. Ann Oncol. 2006; 17(1):167–71.
29. Howard DH, Tangka FK, Seeff LC, Richardson LC, Ekwueme DU. The impact of detection and treatment on lifetime medical costs for patients with precancerous polyps and colorectal cancer. Health Econ. 2009;18(12):1381–93.
30. Bagust A, Beale S. Survival analysis and extrapolation model-ing of time-to-event clinical trial data for economic evaluation: an alternative approach. Med Decis Making. 2014;34(3):343–51. 31. Boag J. Maximum likelihood estimates of the proportion of patients cured by cancer therapy. J R Stat Soc Ser B Stat Soc. 1949;11(1):15–53.
32. Williams C, Brunskill S, Altman D, et al. Cost-effectiveness of using prognostic information to select women with breast cancer for adjuvant systemic therapy. Health Technol Assess. 2006; 10(34):1–204.
34. Henriksson M, Epstein D, Palmer S, et al. The cost-effective-ness of an early interventional strategy in non-ST-elevation acute coronary syndrome based on the RITA 3 trial. Heart. 2008;94: 717–23.
35. Barton P, Jobanputra P, Wilson J, Bryan S, Burls A. The use of modelling to evaluate new drugs for patients with a chronic condi-tion: the case of antibodies against tumour necrosis factor in rheu-matoid arthritis. Health Technol Assess. 2004;8(11):1–91. 36. Rodgers M, Hodges R, Hawkins J, et al. Colour vision testing for diabetic retinopathy: a systematic review of diagnostic accuracy and economic evaluation. Health Technol Assess. 2009;13(60): 1–160.
37. Chen YF, Jobanputra P, Barton P, et al. A systematic review of the effectiveness of adalimumab, etanercept and infliximab for the treatment of rheumatoid arthritis in adults and an economic eval-uation of their cost-effectiveness. Health Technol Assess. 2006; 10(42):1–229.
38. Chambers D, Epstein D, Walker S, et al. Endovascular stents for abdominal aortic aneurysms: a systematic review and economic model. Health Technol Assess. 2009;13(48):1–189.
39. Fleurence R, Hollenbeak C. Rates and probabilities in eco-nomic modelling. Pharmacoecoeco-nomics. 2007;25(1):3–6.
40. Demiris N, Sharples LD. Bayesian evidence synthesis to extrapolate survival estimates in cost-effectiveness studies. Stat Med. 2006;25(11):1960–75.
41. Benaglia T, Jackson CH, Sharples LD. Survival extrapolation in the presence of cause specific hazards. Stat Med. 2014;34(5): 796–811.
42. Rodgers M, McKenna C, Palmer S, et al. Curative catheter abla-tion in atrial fibrillaabla-tion and typical atrial flutter: systematic review and economic evaluation. Health Technol Assess. 2008;12(34):1–198. 43. Stevenson M, Lloyd-Jones M, Papaioannou D. Vitamin K to prevent fractures in older women: systematic review and economic evaluation. Health Technol Assess. 2009;13(45):1–134.
44. Black C, Sharma P, Scotland G, et al. Early referral strategies for management of people with markers of renal disease: a systematic review of the evidence of clinical effectiveness, cost-effectiveness and economic analysis. Health Technol Assess. 2010;14(21):1–184. 45. Louzada-Neto F. Polyhazard models for lifetime data. Biomet-rics. 1999;55(4):1281–5.
46. Maetani S, Nakajima T, Nishikawa T. Parametric mean sur-vival time analysis in gastric cancer patients. Med Decis Making. 2004;24(2):131–41.
47. Fang CT, Chang YY, Hsu HM, et al. Life expectancy of patients with newly-diagnosed HIV infection in the era of highly active antiretroviral therapy. QJM. 2007;100(2):97–105.
48. Chu PC, Wang JD, Hwang JS, Chang YY. Estimation of life expectancy and the expected years of life lost in patients with major cancers: extrapolation of survival curves under high-censored rates. Value Heal. 2008;11(7):1102–9.
49. Hwang J, Wang J. Monte Carlo estimation of extrapolation of quality-adjusted survival for follow-up studies. Stat Med. 1999; 18(13):1627–40.
50. Breslow N, Day N. Statistical methods in cancer research. Vol-ume II: the design and analysis of cohort studies. IARC Sci Publ. 1987;82:1–406.
51. Andersson TM-LL, Dickman PW, Eloranta S, Lambe M, Lam-bert PC. Estimating the loss in expectation of life due to cancer using flexible parametric survival models. Stat Med. 2013;32(30): 5286–300.
52. Royston P, Parmar MKB. The use of restricted mean survival time to estimate the treatment effect in randomized clinical trials when the proportional hazards assumption is in doubt. Stat Med. 2011;30(19):2409–21.
53. Davies A, Briggs A, Schneider J, et al. The ends justify the mean: outcome measures for estimating the value of new cancer therapies. Health Outcomes Res Med. 2012;3(1):e25–36.
54. Jackson CH, Sharples LD, Thompson SG. Survival models in health economic evaluations: balancing fit and parsimony to improve prediction. Int J Biostat. 2010;6(1):article 34.
55. Royston P, Parmar MKB. Flexible parametric proportional-ha-zards and proportional-odds models for censored survival data, with application to prognostic modelling and estimation of treat-ment effects. Stat Med. 2002;21(15):2175–97.
56. Guyot P, Welton NJ, Beasley M, Ades AE. Extrapolation of tri-al-based survival curves using external information. Value Health. 2014;17(7):A326.
57. Lunn D, Jackson C, Best N, Thomas A, Spiegelhalter D. The BUGS Book: A Practical Introduction to Bayesian Analysis. Boca Raton (FL): CRC Press; 2012.
58. Lambert PC, Royston P. Further development of flexible para-metric models for survival analysis. Stata J. 2009;9(2):265. 59. Jackson CH. flexsurv: a platform for parametric survival mod-elling in R. J Stat Softw. In press.
60. Nelson CL, Sun JL, Tsiatis AA, Mark DB. Empirical estimation of life expectancy from large clinical trials: use of left-truncated, right-censored survival analysis methodology. Stat Med. 2008; 27(26):5525–55.
61. Walker S, Sculpher M, Claxton K, Palmer S. Coverage with evi-dence development, only in research, risk sharing, or patient access scheme? A framework for coverage decisions. Value Health. 2012;15(3):570–9.
62. Jackson CH, Bojke L, Thompson SG, Claxton K, Sharples LD. A framework for addressing structural uncertainty in decision mod-els. Med Decis Making. 2011;31(4):662–74.
63. Spiegelhalter DJ, Abrams KR, Myles JP. Bayesian Approaches to Clinical Trials and Health-Care Evaluation. Chichester (UK): Wiley; 2004.
64. Buxton M, Caine N, Chase D, et al. A review of the evidence on the effects and costs of implantable cardioverter defibrillator ther-apy in different patient groups, and modelling of cost-effectiveness and cost-utility for these groups in a UK context. Health Technol Assess. 2006;10(27):1–164.
65. Welton NJ, Sutton AJ, Cooper N, Abrams KR, Ades AE. Evi-dence Synthesis for Decision Making in Healthcare. Chichester (UK): John Wiley & Sons; 2012.
68. Soares MO, Bojke L, Dumville J, Iglesias C, Claxton K. Methods to elicit experts’ beliefs over uncertain quantities: application to a cost effectiveness transition model of negative pressure wound therapy for severe pressure ulceration. Stat Med. 2011;30(19): 2363–80.
69. O’Hagan A, Buck CE, Daneshkhah A, et al. Uncertain Judge-ments: Eliciting Experts’ Probabilities. Chichester (UK): John Wiley & Sons; 2006.
70. Greenland S. Bayesian perspectives for epidemiological research: I. Foundations and basic methods. Int J Epidemiol. 2006;35(3):765–75.
71. Strong M, Oakley JE, Chilcott J. Managing structural uncer-tainty in health economic decision models. J R Stat Soc Ser C (Applied Stat). 2012;61(1):25–45.
Journal Title : MDM
Article Number : 639900
Greetings, and thank you for publishing with SAGE Publications. We have prepared this page proof for your review.
Please respond to each of the below queries by digitally marking this PDF and sending the marked PDF back. Please use only the icons shown below for your mark-up, and do not use “sticky notes” or other “pop-up” comments.
Please use: Please do NOT use:
Help with Digital Mark-up
1. Do you have Adobe Reader? Quick, safe, free download is available at http://get.adobe.com/reader/
2. To access the recommended tools, please click “Comment” in upper right of Adobe Reader, then “Drawing Markups.” 3. Using tools other than those recommended may cause data loss.
4. Some mark-up examples are shown below.
Please note that sending corrections in any form other than the marked-up PDF can significantly delay the processing of your corrections.
Please assist us by clarifying the following queries:
Sl. No. Query
GQ: Please confirm that all author information, including names, affiliations, sequence, and contact details, is correct.]
GQ: Please review the entire document for typographical errors, mathematical errors, and any other necessary corrections; check headings, tables, and figures.]