ISSN: 1992-8645 www.jatit.org E-ISSN: 1817-3195
VIBRATION CONTROL OF PIEZOELECTRIC FLEXIBLE
STRUCTURE USING ROBUST CONTROL METHODOLOGY
JUNFENG HU, GUIYANG XU
School of Mechanical & Electrical Engineering, Jiangxi University of Science and Technology, Ganzhou
341000, China
E-mail: [email protected],[email protected]
ABSTRACT
Active vibration control of a smart flexible cantilever beam was studied by using mode theory and μ synthesis method. The actuator is piezoceramic patch, the sensor is strain gauge. The finite element method and experimental modal test was applied to obtain the dynamic model of the smart structure. Taking account into uncertainty of the external disturbance and measurement noise, and uncertainty of natural frequency, damping ratio and actuator parameters of the system, μ synthesis approach was applied to design the vibration controller by selecting mode displacement as evaluation signal and selecting appropriate weighting function according to amplitude and frequency characteristics of the actual signal. A
H∞controller with same weightings was also designed and implemented for comparison analysis. The
performances of the controller are verified experimentally in this study. Experimental results showed that
µ-controller can provide good disturbance rejection and is more robust to parameter variations than
H∞controller. And the proposed controllers can effectively suppress the vibration response of the flexible
beam.
Keywords: Smart Structure, Active Vibration Control, Finite Element Method, µSynthesis, Experimental Modal Test
1. INTRODUCTION
In precision and aerospace industry, many researches on lightweight and miniaturized structures have been carried out to improve structural performances. Among the researches, passive structures using composite material are typically known as one of the effective methods. However, the traditional passive structures are very sensitive to change of internal load condition and external environment condition which can even cause sudden destruction of structures. Therefore, in order to satisfy stringent requirements for precision control and lightweight miniaturization, smart materials such as shape memory alloys, piezoceramics, and magnetorheological fluids are frequently adopted for smart structures. The performance requirements of future space structures, jet fighters and concept automobiles have brought much interest to the area of smart structures. A smart structure can be defined as a structure with bonded or embedded sensors and actuators as well as an associated control system, which enable the structure to respond
simultaneously to external stimuli exerted on it and then suppresses undesired effects or enhance desired effects. Among various smart structures, those with piezoelectric patches have received much attention in recent years, due to the fact that piezoelectric materials have simple mechanical properties, small volume, light weight, large useful bandwidth, efficient conversion between electrical and mechanical energy, good ability to perform vibration control and ease of integration into metallic and composite structures [1-3].
parameter uncertain systems [5]. Mayhan combined intelligent control and smart materials to produce an adaptive and robust controller to dampen the fundamental vibration mode of the system in the presence of modeling uncertainties [6]. Zhang et al. studied the active vibration control problem for the high-speed flexible mechanisms all of whose members were considered as flexible by using complex mode method and robust H∞ control scheme [7-8]. Kawabe utilized neural networks (NN) theory for active control in a longitudinal cantilevered-beam system by simulation and experiment. It is found that fairly satisfactory active damping effect using the NN controller is obtained [9]. But the random disturbance and measurement noise of the actual system were not considered by these currently proposed vibration control strategies. The issue of robustness against external disturbances was not addressed, and therefore the proposed vibration controllers cannot be effectively applied to the smart structure under the random uncertain disturbances.
Very few attempts have been made toward the application of robust control methodology to control vibrations in lightweight flexible structures. Robust vibration control methodology has received much attention due to their wide applications, and led to a rapid development of various control strategies such as the LQG control and the fuzzy control, etc. In recent years, a great deal of attention has been paid to the H∞control because it not only
provides a unified and general control framework for all control structures, but also yields a controller with guaranteed margins. However, H∞ control
models all uncertainties as a single complex full block, which results in a rather conservative design. Under such circumstances, the µ synthesis technique, which involves the use of
H∞ optimization for synthesis and structured
singular value for analysis, has been developed. During the controller design, an issue to be considered is the process of the mathematical model between the disturbance force and the manipulator, which is always assumed to be known. In engineering practice, however, it is difficult to obtain this model even though system identification or theoretical approach. Hence, how to design a µ -controller without requiring a mathematical model between the disturbance force and structure is of great interest in the application of µ -synthesis technique.
We aim here to deal with the active vibration reduction problem in flexible structure with uncertainties through designing reasonable µ -controller. In this paper, the vibration control of a flexible beam is investigated by using µsynthesis and experimental modal test method, and taking into account the random disturbance uncertainty, modal parameter uncertainty and measurement noise.
The paper is organized as follows. In section 2, a dynamic model of a flexible beam bonded with piezoelectric actuators and strain gauge sensors is constructed by using finite element method. In section 3, the µcontroller is proposed. In section 4, experimental identification of the flexible cantilever beam is performed to obtain its modal parameters. And the experimental validation test is performed based on the dSPACE DS1103 platform. The conclusions are given in section 5.
2. DYNAMIC MODELING OF SMART STRUCTUE
The modeling of smart structure with piezoelectric actuators and sensors has been a subject of intense research for a long time and is only briefly described here.
x y
1 u 3
u u5
6 u
8 u 2
u
4 u
7 u e
L
[image:2.612.314.556.411.486.2]A B
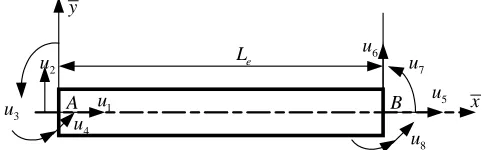
Figure 1: Planar beam element showing nodal degrees of freedom and coordinate systems
The flexible structure is modeled by using
a two-node beam element. The beam element is
shown in Fig. 1, which has two nodes with four
degrees of freedom at each node; namelyu1
,
u5,
the longitudinal displacement, and u2 , u6 ,the transverse displacement, and u3
,
u7, the slope, and4
u
,
u8, the curvature.Le is the length of element. The nodal displacement vector u with respect toreference frame A−x yis expressed as
[
]
T1 2 3 4 5 6 7 8
u u u u u u u u =
u (1)
The transverse and longitudinal displacement fields of two-node beam element are constructed using the quintic hermite and linear
ISSN: 1992-8645 www.jatit.org E-ISSN: 1817-3195 W denotes longitudinal and transverse elastic
displacement of arbitrary point, respectively. Subscript T denotes matrix transpose. They can be written by the following form
( )
( )
( )
( )
12 ,
,
V x t x
W x t x
=
N u
N (2)
where N
( )
x = N1( )
x N2( )
x T is shape function, uis the nodal displacement vector.The system dynamic equations can be obtained by using finite element method
+ + =
MU CU KU P (3)
whereM,C,Kare the systematic mass, damping, stiffness, respectively. U,U,Uare the generalized displacement, velocity, and acceleration vectors of the system, respectively. P is the systematic generalized disturbance force vector corresponding to vector U.
The piezoelectric patches work as actuators are perfectly bonded on the upper and lower surfaces of the beam at the same location. For the modeling of PZT actuators, literature [10, 11] provides a detailed derivation of coupling of PZT actuators and a host beam. These bending moments induced by the actuators is given by
(
)
31 p p p a in
A B
T =T = −d E b t +t V (4)
whered31,Ep,bp,tpis piezoelectric constant, elastic module, width, and thickness of PZT patch, respectively. ta is the thickness of the beam element,Vin is the vector of input voltage to the piezoelectric actuators. The moments are assembled as a part of the external moments exerted on node.
Strain is the amount of deformation of a structure due to an applied force. Strain gauge is the most common sensor for measuring strain. A strain gauge’s electrical resistance varies in proportion to the amount of strain placed on it. The deformations mainly include compression or tension and bending deformation for the flexible beam. The strain
ε
inx direction is given by
L B
ε ε= +ε (5)
where εL is compression or tension strain and
B
ε are longitudinal strain due to bending
deformation, respectively. They can be given by
L 1 1
B 2 2
,
h h
ε ε
′′ ′′
= =
′′ ′′
= − = −
N u N BU
N u N BU
(6)
where h is the distance between the neutral axis of
the beam and the outer surface of the beam, N1′′,
2′′
N are the first-order and the second-order
differential of the shape function N1 and N2, respectively,B denotes the transformation matrix. Thus, the exogenous perturbation and the control inputs have no direct effect on the measured outputs.
There are a piezoelectric actuators and s
strain gage sensors on the flexible structure. Combining Eq. (3)~ Eq.(6), the dynamic equations of the structure equipped with piezoelectric actuators and strain gauge transducer can be expressed as
in
a s
+ + = +
=
MU CU KU P D V
y D U
(7)
whereDa is the systematic control matrix related to
configuration of actuators, Ds is the systematic output matrices determined by configuration of sensors, a a-by-1 vector, and yis the strain from the sensors, a s-by-1 vector.
It was shown that the dynamic response of the flexible structure is composed mainly of the lower modes. In order to control the lower modes, the physical-coordinate equations must be first transformed into modal coordinates. Here, we choose the first c order modes as control modes. Applying the modal theory, the normalized modal transformation is introduced by
c c
=
U ψ η (8)
where ψc is the controlled normalized modal
matrix, ηc
i
s controlled modal coordinate vectors. Substituting Eq. (8)into Eq.(7), the system dynamicequations are rewritten as
c c c c c c ac in
sc c
+ + = +
=
η C η K η N D V
y D η
(9)
where T T T
c= c , ac= c a, sc= c s
N ψ P D ψ D D ψ D C Kc, c
i
sc c× diagram matrix, which is determined by system natural frequency and damping ratio.
For control synthesis, the system must be written as a system of first-order ordinary differential equations (ODEs). We can define the controlled state variables by the following form
[
]
T1 1
c = η η ηc ηc
X (10)
Due to the controlled mode number c
,
thec c c c in c
c c
= + +
= +
X A X B V N
y C X ν
(11)
where
c c
c
c c
= − −I
A
K C
0
, ac
c ac =
B D
0
[
]
c sc sc
,C = D 0 ,
c
I is c c× unit matrix,0ac,0scare c a s c× , × zero matrix, respectively.
3. ROBUST
µ
-CONTROLLER DESIGNRobust control theory is exploited to develop a more simple and reliable controller for the flexible structure vibration control applications. The robust controller requires both nominal model and uncertainty model. So in order to make actual control become robust, it is necessary to provide an accurate and detail modeling of the uncertainties that is relevant to the structure model. Because the plant to be controlled is a flexible structure modal model is best one described its dynamic behavior.
In general, modal parameters of a flexible structure model are: resonance frequencies, damping ratios, modal vibration shape. Each of these modal parameters contains uncertainty. In addition, the truncated modes in the model reduction and signal noise in actuators and sensors also increase the uncertainty in the assumed model. The mathematical models for uncertainties established in robust theory are additive uncertainty. Since the natural frequencies and mode shapes of the system are functions of the time, Equations (11) are continuous time-varying state space representation of the mechanism system. Designing a controller with time-varying state-space matrices is out of the scope of this study. The prevailing practice in the analytical studies available is to assume constant state space matrices, i.e., constant natural frequencies and mode shapes for the entire motion cycle of the system. Although these results are not conclusive, similar assumption will be made in the controller design of current work.
Based on the model obtained in section 2, a controller is designed for the smart flexible beam. The goal of the controller is to attenuate the vibrations of the smart beam at its first two flexural frequencies and obtain gain stabilize the unmodeled high frequency modes. In H∞ control design framework, the objective is to minimize the
H∞norm of the weighted transfer functions from
the input disturbance signals to the output error signals. The uncertainties in the plant model can be put in such a form that some of the disturbances and error signals correspond to the channels
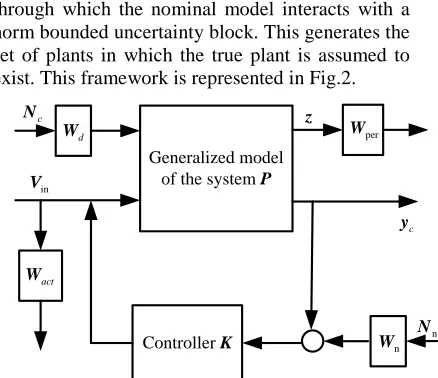
through which the nominal model interacts with a norm bounded uncertainty block. This generates the set of plants in which the true plant is assumed to exist. This framework is represented in Fig.2.
Generalized model of the system P
Controller K
c
N
d
W
act
W
per W
n W in
V
c
y
[image:4.612.317.536.95.284.2]n N z
Figure 2: The augmented dynamic closed-loop system
From the perspective of robust control, the suppression of the vibration response of elastic mechanism is to inhibit the effect of the disturbance signal, such as modal force and measurement noise, on the output of the system. According to
H∞ control theory, that is, the better the control
performance is, the smaller sensitivity function is. This is a minimum sensitivity control problem. According to the model of flexible manipulator, we can obtain the augmented dynamic closed-loop system as shown in Fig.2. In the Figure, Nc is the modal force, is treated as external disturbance term, and Wdis the weighted function of the signal. Nn
is the measurement noise, and Wn is the weighted function corresponding to the noise signal. In general, in order to find a controller to suppress Nc
in desired frequency bandwidth
y
c should be weighted by a performance weighting function matrix. zrepresents the evaluation signal and Wperis the weighted function of the signal. Vin is the control voltage. In addition, the control voltage should be weighted by the weighting function matrix so as to prevent the saturation of controller output. In order to limit the voltage range, the weighted function Wact is used to penalize the signal. ycis the measurement output of the system, the output strains from strain gages. Measurement noise represents electrical noise, sampling errors, drifting calibration, and other effects that impair measurement precision and accuracy.
ISSN: 1992-8645 www.jatit.org E-ISSN: 1817-3195
controlled plant, the first type signal is the controlled mode displacement, and the other is the output strain signal from the sensor. And taking into account the range of input voltage of actuator, the two different evaluation signals z1 and z2are represented by the following form
1
1 in
in a a
c c c N N = = + 0 C η
z X V
0 I
V (12)
where 1 c c
c c = I 0 C
0 0 , Ic,INais c c× and Na×Na unit matrix, respectively. 0c
、
a N
0 is c c×
、
a a
N ×N zero matrix. The external disturbance signal w includes the modal force signal and measurement noise signal, and it can denotes
[
c, n]
=w N N
.
Combined equation(11) andequation(12), the state-space equation of the generalized controlled plant can be written as follow
in
1
1 in
in a a
c c c c c
c c c
c c c N N = + + = = = +
X A X B V N
y C X
0 C
η
z X V
0 I
V
(13)
The determination of weighting function matrices Wd
( )
s ,Wn( )
s ,Wact( )
s ,Wper( )
s is a crucial step in the controller design. According to the amplitude and frequency characteristics of modal force and measurement noise signal, the weighting function Wd( )
s and Wn( )
s are set to respectively( )
max d d n n s = =W N f
W M (14)
where Nmaxis the maximum amplitude of the mode
force signal, fd
( )
s denotesi
ts characters in the frequency domain, Mn is the amplitude of the measurement noise signal.The weighting function matrix Wact
( )
s is selected as to prevent the saturation of controller output due to the limits of DS1103 D/A converter output. Suppose the maximum allowable value of the actuatorVmax, the frequency character of thesignal fact, theweightingfunction Wact
( )
s is( )
max 1act = act s
W f
V (15)
The introduction of Wper
( )
s is to reduce the influence of disturbance on sensor outputs. Ingeneral, it is chosen with large amplitude so as to suppress the low-frequency vibration. There are two type evaluation signals. One is modal displacement and Wper1is its weighting function; the other is output strain and Wper2 denotes the weighting function corresponding to the signal. They are given by
( )
( )
1 1 1
2 2 2
per per per per P s P s = = W f
W f (16)
where P1 and P2 is the weighting coefficient,
( )
per1 sf and fper2
( )
s is chosen as a one-order diagonal matrix, and they can be given by( )
( )
1 1 2 1 1 , ,/ 1 / 1
1 1
, ,
/ 1 / 1
per c per o o s diag s s s diag s s ω ω ω ω = + + = + + f f (17)
where ω1~ωcis chosen as the larger value than the
first ccontrolled mode frequency, ωo is a slightly larger value than the highest the controlled natural frequency value. That is, the output signal whose frequency is less than ωo can be attenuated under the action of the controller.
In general, the design of a µ -control system includes the synthesis of the controller and the selection of weighting functions. The consideration of the physical system is crucial. The so-called physical system includes both the system
to be controlled and the actuator/sensor
configuration. Different selections of
actuator/sensor locations lead to very different sensor/actuator transfer functions and accordingly
affect the design of µcontrollers. As is known
,
the actuator/sensor configuration determines the controllability and observability of the system, which has direct impact on the modes to be controlled and the control energy required. When piezoelectric actuators are used, they should be usually located at regions where the strain deformations of the most dominant modes are large enough. Ideally, sensors should be collocated (or at least very close to the actuators) to ensure the plant model described by the transfer function as a minimum phase system in the controlled frequency band. The number of sensors and actuators to be used depends on the number of modes to be controlled.11 12
in 21 22 in
c
= =
z w P P w
P
y V P P V (18)
Suppose the controller is given by
in = c
V Ky (19)
Substituting equation (19) into equation (18), the closed-loop transfer function from w to
z canbe obtained
(
)
(
)
111 12 22 21
,
l
−
= + −
F P K P P K I P K P (20)
The controllerKcan obtained by solving two algebraic Riccati equations which the loop system is stable and the norm of the closed-loop transfer function can reach to the minimum value.
1
or
2z
z
P
[
∆ ∆
A B]
[
∆ ∆
F1 F2]
in
V
y
c [image:6.612.119.274.267.421.2]K
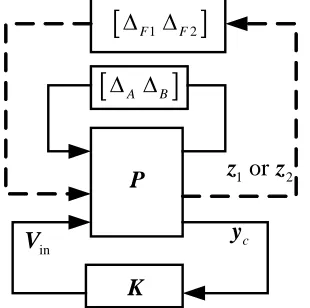
Figure 3: Block diagram ofµsynthesisaugmented model
Since it is difficult to establish the exact mathematical model of the dynamic system by using finite element method, the structural parameters such as natural frequency, damping ratio and the parameter relative to the actuator are
not accurate. ∆ω
,
∆ζ and ∆g are used to represent the uncertainty of these parameters, the uncertainty of coefficient matrix of state equations are described as(
)
(
)
( )
,( )
,c c c
c g c g c
ω ζ ω ζ
∆ ∆ ∆ = ∆ ∆ −
∆ ∆ = ∆ −
A A A
B B B (21)
where Ac
(
∆ ∆ω ζ,)
and Bc( )
∆g is the actualcoefficient matrix
,
Ac and Bc is the nominal value,
∆Ac(
∆ ∆ω ζ,)
and ∆Bc( )
∆g represent thebounded uncertainty of these parameters. In order
to design the controller by using µ -synthesis method, ∆Acand∆Bccanbedescribedas
(
)
(
)
(
)
( )
( )
( )
, , , 1
1
c A A A A
c g B B g B B g
ω ζ ω ζ ω ζ
∆ ∆ ∆ = ∆ ∆ ∆ ∆ ∆ ∆ ≤
∆ ∆ = ∆ ∆ ∆ ∆ ≤
A D E
B D E (22)
where DA , EA , DB and EB are uncertainty
structured constant matrix, respectively.
( , )
A ω ζ
∆ ∆ ∆ and∆ ∆B
( )
g is unknown uncertaintyparameterswhich is a bounded perturbation.
According to the performance index introduced by above part, the µ -synthesis augmented model is shown as Fig.3. The dotted lines indicate the hypothetical perturbation
[
∆ ∆F1 F2]
.
[
∆ ∆A B]
is the actual perturbations.Thus, the diagonal block ∆pof uncertainty matrix is obtained to construct a standard µ -synthesis framework.
1
2
F F p
A B ∆
∆
=
∆
∆
Δ (23)
Obviously, this is the standard µ-control problem, and the design can be based on the Matlab
µ-toolbox, in which the D-K iteration is adopted to perform the synthesis procedure. D-K iteration is a two-step minimization process: the first step is a minimization of the H∞norm over all stabilizing
controllers K while the scaling matrix D is held fixed and second step is a minimization over a set
of scalingD whilethecontrollerK isheldfixed
.
4. EXPERIMENTAL INVESTIGATION
In this section, we shall experimentally evaluate the effectiveness of the proposed control method in the vibration control of a flexible beam.
4.1 Experimental setup
The length of the cantilever beam is 300 mm, its width and thickness are 20 mm, 1.5 mm, respectively. Its material is steel with elastic module, density and Poisson’s ratio 2100 GPa,
7800kg/m3, 0.3, respectively. The beam is divided into 7 beam elements and 28 generalized coordinates shown as in the Fig. 4. The lengths of the elements are 50 mm, 40 mm, 40 mm, 40 mm, 40 mm, 40 mm, 50 mm, respectively. The symbols N
,
E,
A,
S denotenode, actuator,
ISSN: 1992-8645 www.jatit.org E-ISSN: 1817-3195
module and density is 200 10⋅ −12m/V, 1200 GPa
,
7650 kg/m3, respectively
.
The sensors are resistance strain gage. The configuration of the actuators and sensors are shown in Fig.4. The three pairs actuator bonded on the link are located at elementsE2,
E4 andE6.
Two sensorsS1,
S2arelocated at the midpoint of elements E3 andE5
.
Three actuatorsA A A1, 2, 3 are located
at
elements2
E
,
E4 and E6,
respectively.
actuator sensor
1
A A2 A3
1
S S2
1
N N2 N3 N4 N5 N6 N7 N8
1
E
2
E E3
4
E E5
6
[image:7.612.89.306.272.541.2]E E7
Figure 4: Configuration of the elements and nodes, actuator and sensor, N
,
E, A,Sdenote node,
actuator, sensor, respectively
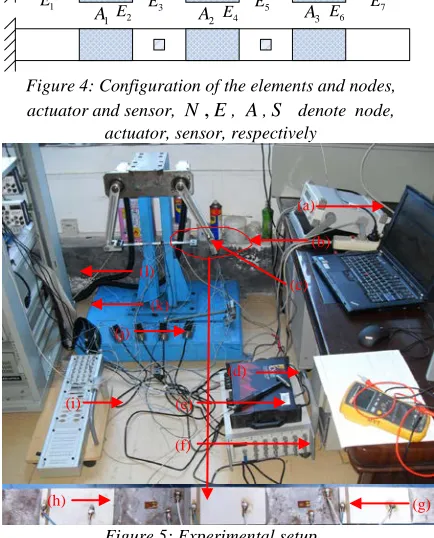
Figure 5: Experimental setup
(a) signal generator (b) cantilever beam (c) accelerometer (d) dynamic signal acquisition (e) hammer (f) dynamic strain gauge
(g) strain gauge (h) piezoelectric patch (i) DS1103 connector panel (j) electric bridge box (k) voltage amplifier (l) industrial
computer
Fig. 5 illustrates the experimental setup that consists of a flexible beam bonded on PZT and strain gauge. As the bolt is tighten, the rotational pair becomes a fixed pair, that is, the flexible link can be considered as a cantilever beam. The high-speed analog input and output ports are provided with dSPACE DS1103. The electric amplifier made in Harbin core tomorrow science and technology Co., Ltd is used to drive piezoelectric patch. Resistance strain gauges are made in ZEMIC Co., Ltd, its type is BE120-3AA (11), the resistance is
120Ω, and the sensitivity coefficient is 2.17. The strain gauge is connected to dynamic strain gauge through 1/4 electric bridge which is used to transform the strain signal to voltage.
4.2. Experimental modal test
Experimental modal analysis is a case of system identification where a priori model form consisting of modal parameters is assumed. Because it is hard to obtain damping ratio of structure by finite element method (FEM), the experimental modal test is a good method to get accurate natural frequency and damping ratio, which provide a basis for adjustment of the control model of the flexible structure. The setup of the experimental modal test is shown as Fig.5. Kistler 8690C50-type piezoelectric accelerometer is used as acceleration sensor. The ZonicBook/618E is the dynamic signal acquisition system. The eZ-Analyst software is real-time vibration analysis software equipped with a dynamic signal acquisition system which provides a real-time analysis capability in the frequency domain and time domain. ME’scopeVES software is used to be a post-processing test which is capable of analyzing mechanical and structural static and dynamic characteristics to obtain modal parameters.
Impulse hammer method is applied to perform experimental modal test. To excite the bending vibration, the cantilever beam was hit with a hammer at the specified excitation points. Using a hammer to produce a wide band of excitation, it can excite each mode in a wider frequency range. The locations of hammer and accelerometers are located at midpoints of element E3 and elementsE1~E7
,
respectively. A miniaturized accelerometer PCB is sequentially placed at different locations. The tap position of the hammer is fixed, and the measurement points are 7 different positions. In order to eliminate measurement noise, the multiple measurements value of measurement point is averaged, the times of measurement is set to 5. The eZ-Analyst software is used to collect data of excitation point and all measurement points, to obtain the frequency response function of the measuring point, and then export the data format
which ME’scopeVES can support. The
ME’scopeVES software is used to identify the modal parameters of the flexible beam. The synthesis of the controller is based on a nominal model constructed by low-frequency modes. In the present case, the first four-order mode of the link is identified. The first four-order nature frequencies by using experimental identification and FEM are shown in Table 1, respectively, and the corresponding damping ratios are identified and
(h) (g)
(f)
(b) (a)
(k)
(i) (j)
(c)
tabulated in Table 1. As can be seen from the table, relative error of calculated and experimental values of natural frequency is close to 2-6 %, which indicates that the finite element model is not fully consistent in the actual system. That is to say, the model used to design controller is uncertain.
Figure 6: Fitting curve of frequency response data
Table 1: The first four-order natural frequency and damping ratio
Mode order
Natural frequency (Hz)
Relative error
Damping ratio (%) Calculation
value
Experimental value
1
2
3
4
10.5
73.8
180.9
366.7
10.8
72.6
189.6
387.5 1.52
2.37
4.56
5.37
1.52
2.37
1.24
0.96
4.3. Experimental results
Schematic diagram of vibration control experiment is shown as Fig. 7. The principal of the vibration control is described as follows. When the exogenous disturbances are exerted on the beam, the vibration response will be generated. The output of the strain gage is given as input to the dynamic strain gauge which filters out the noise contents. The conditioned sensor signal is given as analog input card through the electric bridge connector box. The vibration signal measured by a sensor is transformed into a voltage signal by a dynamic strain transducer, and through a low-pass filter and an A/D converter, the analog voltage signal is converted into a digital signal to the dSPACE controller board. And the control voltage applied to actuator can be obtained through the designed controller. As the control voltage from D/A port is
relatively low, the voltage exerted on the piezoelectric patch must be amplified by the voltage amplifier to implement the vibration control. The control signal calculated by the dSPACE is converted into an analog signal by a D/A converter, and then is magnified 15 times by a voltage amplifier. Signals are then amplified and fed to a digital control system. The control algorithms are implemented using dSPACE DS1103 system with necessary Matlab/Simulink software installed in an industrial computer. The control algorithm is implemented using Simulink software and Real Time Workshop (RTW) is used to generate C code from the developed Simulink model. The C code is then converted to target specific code by real time interface (RTI) and target language compiler (TLC) supported by DS1103 controller board. Then we can design a vibration control experiment in real time by using ControlDestk software provided by dSPACE. The control objective is to minimize the output strain of two sensor outputs within the control bandwidth under the excitation of the disturbance force induced by external force.
1
A 1 A2 A3
S S2
Voltage amplifier
Dynamic strain gauge DS1103 platform
Excitation 1 Excitation 2
Figure7: Schematic diagram of experiment
The objective in the experimental studies is to control the first three vibration modes. In order to generate the disturbance force exerted on the beam, we use the actuator A3as excitation source. The actuators A A1, 2 are applied to vibration control. The gain of the dynamic strain gauge is set to 1000, the bridge voltage 6 V, cutoff frequency of filter is set to 100 Hz. The sampling frequency of analog input and output port is set to 1000 Hz. The covariance of measurement noise is estimated as
4
ISSN: 1992-8645 www.jatit.org E-ISSN: 1817-3195
taping instantly the free end of the beam. The second excitation source
n
amed as excitation 2 is the forced one by applying a voltage to the piezoelectric ceramic patch A3.
The excitation voltage is generated by the signal generator which generates a white noise signal, amplified by voltage amplifier. And the covariance of the excitation signal is set to 120 V.In the following section, the control effect of the controller is analyzed. In order to meet better the situation of the actual system, the measurement noise is considered in the experimental validation, and the signal is treated as white noise whose amplitude is set to 2 10× −4. Since the frequency
band to control is between 0 and 100 Hz including the first two modes of the structure, the cut-off frequency of low-pass filter of dynamic strain gauge is set to 5 Hz. The weighting matrix of performance index function shown as equatio
n
(14),
(15)and (16) are set as follows
( )
( )
42
150, 1 10 1,1
1 200
1,1
150 600
75 470
500 ,
75 470
930 930
500 ,
930 930
d n
act
per
per
W W diag
s
W diag
s
W diag
s s
W diag
s s
−
= = × ×
+
= × ×
+
= ×
+ +
= ×
+ +
(24)
where diag
( )
⋅ denotes diagonal matrix.
The minimum and maximum value of input voltage is set to Vmin( )
k = −150V
andVmax( )
k =150V.
The effectiveness and control performance of the four controllers are analyzed from the time domain point of view. The controller synthesis and analysis techniques described above are applied to the smart beam. Two H∞ controllers and
two
µcontrollers are designed according to above two performance index. In subsequent section, theH∞ controller with modal displacement for
evaluation signal is called controller1. The
H∞ controller with output strain for evaluation signal is called controller2. The µcontroller
with
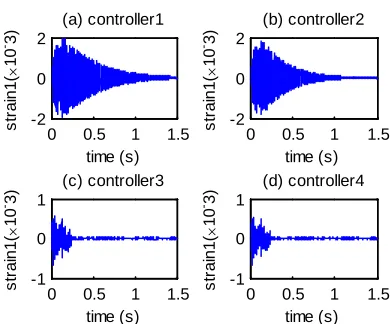
modal displacement for evaluation signal is called controller3, and the µcontroller with output strain for evaluation signal is named as controller4. Figure 8 (a), (b) shows the output strain from two sensors without controller. Figure 9 and 10 (a), (b), (c), (d) represents the output strain from two sensors with controller1,
controller2,
controller3and controller4, respectively. By comparing Fig.9 and 10 with Fig.8, we can see that the two output strains from sensors are reduced rapidly under the action of the four controllers. The results show that the four kinds of controllers can suppress vibration response of the flexible manipulator. By comparing the analysis of Figure 9, Figure 10(a), (b), the analysis results showed that two H∞ controllers
have the same control effect. Similarly, the two
µ controllers also have the same control
performance. However, the results of comparative analysis of Fig.9-10 (a), (b), (c), (d) show that the suppression of the output strain with µcontrolleris faster than one wit
h
H∞, which it also indicates thecontrol performance of µcontroller is better than
H∞ controller. Figure 11 and 12 show the two actuator input voltages correspond to the controller 1, 2, 3, 4, respectively. From these diagrams, we can observe that these input voltages are with the available range. Through comparative analysis of the above two input voltages, the input voltage of the controller3 and controller4arehigher than
the
controller1andcontroller2.
Thisindicates thatthe µcontrollercanconsumemore
energyto
obt
ain
bettercontrolperformance.
0 0.5 1
-1 0 1
time(s)
s
tr
ai
n(×
10
-3)
0 0.5 1
-1 0 1
time(s)
s
tr
ai
n(×
10
-3)
(a) strain from sensor S1 (b) strain from sensor S2
Figure8: Strain of from two sensors in case of without controller
0 0.5 1 1.5 -2
0 2
time (s)
s
tr
ai
n1(
×
10
-3)
(a) controller1
0 0.5 1 1.5 -2
0 2
time (s)
s
tr
ai
n1(
×
10
- 3)
(b) controller2
0 0.5 1 1.5 -1
0 1
time (s)
s
tr
ai
n1(
×
10
-3)
(c) controller3
0 0.5 1 1.5 -1
0 1
time (s)
s
tr
ai
n1(
×
10
- 3)
[image:9.612.128.301.350.447.2](d) controller4
Figure 9: Strains from sensor S1 with controller 1, 2, 3
[image:9.612.327.522.526.688.2]0 0.5 1 1.5 -2 0 2 time (s) s tr ai n2( × 10 - 3) (a) controller1
0 0.5 1 1.5 -2 0 2 time (s) s tr ai n2( × 10 - 3) (b) controller2
0 0.5 1 1.5 -0.5 0 0.5 1 time (s) s tr ai n2( × 10 - 3) (c) controller3
0 0.5 1 1.5 -0.5 0 0.5 time (s) s tr ai n2( × 10 - 3) (d) controller4
Figure 10: Strains from sensorS2withcontroller 1, 2, 3
and 4
0 0.5 1 1.5 -20 0 20 time (s) c ont rol v ol tage1 ( V ) (a) controller1
0 0.5 1 1.5 -40 -20 0 20 40 time (s) c ont rol v ol tage1 ( V ) (b) controller2
0 0.5 1 1.5 -200 0 200 time (s) c ont rol v ol tage1 ( V ) (c) controller3
0 0.5 1 1.5 -200 0 200 time (s) c ont rol v ol tage1 ( V ) (d) controller4
Figure11: ControlinputvoltageforactuatorA1
0 0.5 1 1.5 -20 0 20 time (s) c ont rol v ol tage2 ( V ) (a) controller1
0 0.5 1 1.5 -40 -20 0 20 40 time (s) c ont rol v ol tage2 ( V ) (b) controller2
0 0.5 1 1.5 -200 0 200 time (s) c ont rol v ol tage2 ( V ) (c) controller3
0 0.5 1 1.5 -200 0 200 time (s) c ont rol v ol tage2 ( V ) (d) controller4
Figure12: ControlinputvoltageforactuatorA2
ACKNOWLEDGMENT
It is a project supported by the National Natural Science Foundation of China (No. 51265016), the Natural Science Foundation of Jiangxi Province
(
No.
20122BAB216029), theEducation Fund of Jiangxi Provincial Department (No. GJJ12358) and the Research Fund of Jiangxi University of Science and Technology(No. jxxj12050).
REFRENCES:
[1] S.B. Choi, “Active structural acoustic control of a smart plate featuring piezoelectric actuators”, Journal of Sound and Vibration, Vol. 294, 2006, pp. 421-429.
[2] K. Ma, “Adaptive nonlinear control of a clamped rectangular plate with PZT patches”,
Journal of Sound and Vibration, Vol. 264, No.
4, 2003,pp. 835-850.
[3] G. L. C. M. Abreu, J. F. Ribeiro, and V. Steffen, “Experiments on optimal vibration control of a flexible beam containing piezoelectric sensors and actuators”, Shock
and vibration, Vol.10,2003,pp. 283–300.
[4] J. F. Hu, D. C. Zhu, “Vibration control of smart structure using sliding mode control with observer”, Journal of Computer, Vol. 7, No. 2, 2012, pp.411-418.
[5] J. F. Hu, “Vibration Control of a High-Speed Parallel Robot Using Discrete Variable Structure Control Methodology”, International Journal of Advancements in Computing
Technology, Vol. 4, No. 15, 2012, pp. 362-370.
[6] X. M. Zhang, C. J. Shao, and A. G. Erdman, “Active vibration controller design and comparison study of flexible linkage mechanism systems”, Mechanism & Machine
Theory, Vol. 37, 2002, pp. 985-997.
[7] X. M. Zhang, C. J. Shao, and S. Li, et al, “Robust H∞ vibration control for flexible
linkage mechanism systems with piezoelectric sensors and actuators”, Journal of Sound and
Vibration, Vol. 243, No. 1, 2001, pp. 145-155.
[8] H. Kawabe, N. Tsukiyama, and K. Yoshida, “Active vibration damping based on neural network theory”, Materials Science and
Engineering A, Vol. 442, 2006, pp. 547-550.
[9] L. Iorga, H. Baruh, and I. Ursu, “A Review of
H∞ robust control of piezoelectric smart
structures”, Appl. Mech. Rev., Vol. 61, No. 4, 2008, pp. 1-16.
[10] X. Y. Wang, K. M. James, S. X. Guo, “Experimental identification and active control of configuration dependent linkage vibration in a planar parallel robot”, IEEE Transactions
on Control Systems Technology, Vol. 17, No.
[image:10.612.96.529.70.709.2]ISSN: 1992-8645 www.jatit.org E-ISSN: 1817-3195
[11] N. Bel Hadj Ali, I.F.C. Smith, “Dynamic behavior and vibration control of a tensegrity structure”, International Journal of Solids and
Structures, Vol. 47, No. 9, 2010, pp.