Transcripts within Viral Replication Compartments
Atsuko Sugimoto,a,bYoshitaka Sato,a,b,cTeru Kanda,aTakayuki Murata,aYohei Narita,a,bDaisuke Kawashima,aHiroshi Kimura,b Tatsuya Tsurumia,d
Division of Virology, Aichi Cancer Center Research Institute, Nagoya, Japana
; Department of Virology, Nagoya University Graduate School of Medicine, Nagoya, Japanb
; Division of Genetics, Kobe University School of Medicine, Kobe, Japanc
; Department of Oncology, Graduate School of Pharmaceutical Sciences, Nagoya City University, Nagoya, Japand
Productive replication of the Epstein-Barr virus (EBV) occurs in discrete sites in nuclei, called replication compartments, where
viral genome DNA synthesis and transcription take place. The replication compartments include subnuclear domains,
desig-nated BMRF1 cores, which are highly enriched in the BMRF1 protein. During viral lytic replication, newly synthesized viral DNA
genomes are organized around and then stored inside BMRF1 cores. Here, we examined spatial distribution of viral early and
late gene mRNAs within replication compartments using confocal laser scanning microscopy and three-dimensional surface
reconstruction imaging. EBV early mRNAs were mainly located outside the BMRF1 cores, while viral late mRNAs were identified
inside, corresponding well with the fact that late gene transcription is dependent on viral DNA replication. From these results,
we speculate that sites for viral early and late gene transcription are separated with reference to BMRF1 cores.
T
he Epstein-Barr virus (EBV), a human lymphotropic
herpes-virus that infects more than 95% of the human adult
popula-tion (
1
), is the causative agent of infectious mononucleosis and is
also associated with some B cell and epithelial cell malignancies (
2
,
3
). After primary infection, EBV persists lifelong as a chronic
asymptomatic infection by establishing latency in resting memory
B cells (
4
,
5
). Although the hallmark of latency is the absence of a
complete viral productive cycle, EBV productive reactivation
from latency, which occurs spontaneously in a subset of cells or
can be induced artificially, leads to viral production through
ex-pression of a variety of lytic genes (
6
,
7
). The EBV genome is
amplified 100- to 1,000-fold by viral replication machinery
com-posed of BALF5 DNA polymerase, BMRF1 polymerase
processiv-ity factor, BALF2 single-stranded DNA binding protein, and the
BBLF4-BSLF1-BBLF2/3 helicase-primase complex in discrete
sites in nuclei, called replication compartments (
8
,
9
). With
pro-gression of lytic replication, the replication compartments
be-come enlarged and fuse to form large globular structures that
eventually fill the nucleus in late stages (
8
).
Analysis of the architecture of the EBV replication
compart-ments has revealed that BMRF1 cores, where BMRF1 protein is
enriched, constitute subnuclear domains inside the replication
compartment (
10
). BMRF1 is a major phosphoprotein
abun-dantly expressed during EBV productive infection (
11
,
12
) which
forms a heterodimer with the BALF5 polymerase catalytic subunit
to enhance polymerase processivity (
13
). Furthermore, crystal
structure analysis has demonstrated that BMRF1 by itself forms
head-to-head homodimer or tetrameric ring structures (
14
,
15
),
presumably contributing to BMRF1 core structures. Thus, the
BMRF1 protein may play dual roles during lytic replication, one as
a polymerase processivity factor and the other in protecting the
viral genome after synthesis.
De novo
synthesis of viral DNA
oc-curs mainly outside the BMRF1 cores coupled with homologous
recombination repair (HHR), which is followed by storage of
rep-licated DNAs inside the cores where mismatch repair (MMR)
fac-tors are recruited to guarantee their integrity (
10
). The envisioned
scenario is that viral DNA replication and viral genome
matura-tion are assigned to outside and inside the BMRF1 cores,
respec-tively.
During productive replication, EBV genes are expressed in a
highly regulated temporal cascade. Three different classes of EBV
genes have been characterized, the immediate-early (IE), early (E),
and late (L) genes (
16
). The switch from latent to lytic infection is
triggered by expression of the IE BZLF1 gene product, a b-Zip
transcriptional factor (
15
,
17
,
18
). The BZLF1 protein binds to the
promoters of E genes encoding proteins involved in viral DNA
replication and metabolism (
19
,
20
) and recruits RNA polymerase
II on their promoters (
21
), initiating the lytic cascade program.
Intriguingly, the transcription of L genes encoding virion
struc-tural components and DNA packaging proteins (
20
) is known to
be tightly coupled to viral DNA replication (
22
). However, it
re-mains unknown where E and L genes are transcribed within viral
replication compartments.
Here, we examined spatial distribution of viral E and L gene
mRNAs within the replication compartments using confocal laser
scanning microscopy and three-dimensional (3D) surface
recon-struction imaging. Viral early gene mRNAs were found to be
lo-cated mainly outside the BMRF1 cores. In contrast, viral L gene
mRNAs were identified inside, corresponding well with the fact
that L gene transcription is dependent on viral DNA replication.
These results indicate that the transcription sites for viral E and L
genes are different, and that they are separated by the BMRF1
cores. This is the first report to describe a spatial relationship
be-tween the sites of viral gene transcription and replication
com-partments during EBV lytic replication.
Received24 January 2013 Accepted26 March 2013
Published ahead of print3 April 2013
Address correspondence to Tatsuya Tsurumi, [email protected].
A.S. and Y.S. contributed equally to this study.
Copyright © 2013, American Society for Microbiology. All Rights Reserved.
doi:10.1128/JVI.00219-13
on November 7, 2019 by guest
http://jvi.asm.org/
MATERIALS AND METHODS
[image:2.585.328.515.71.507.2]Cells and reagents.Tet-BZLF1/B95-8 cells were maintained as described previously (10). The anti-EBV EA-D-p52/50 (BMRF1 gene product) mouse monoclonal antibody (clone R3) was purchased from Chemicon, and anti-RNA polymerase II mouse monoclonal antibodies were from Abcam. Fluorescein isothiocyanate (FITC)-conjugated anti-digoxigenin (DIG) sheep monoclonal antibodies were obtained from Roche Applied Science, and secondary goat anti-mouse IgG antibodies conjugated with Alexa 488 or 594, a Zenon mouse IgG labeling kit (Alexa 594), and a Zenon rabbit IgG labeling kit (Alexa 594) were from Molecular Probes. To block late gene transcription, phosphonoacetic acid (PAA), a herpesvirus TABLE 1Oligonucleotide primer sequence
Primer name Sequence
[image:2.585.42.287.77.215.2]BMRF1-forward 5=-GCCGTTGAGGCCCACGTTGT-3= BMRF1-reverse 5=-TGGGAATGGCAGGCGAGGGT-3= BALF5-forward 5=-GCTGACGGACGGCAAGACCC-3= BALF5-reverse 5=-GGGCAGTTCCTCGTTGCGCT-3= BALF4-forward 5=-AACCTTTGACTCGACCATCG-3= BALF4-reverse 5=-ACCTGCTCTTCGATGCACTT-3= BcLF1-forward 5=-CATCCATGTTCATTGGGACC-3= BcLF1-reverse 5=-CATTAGTCATACCTGCCAGG-3= BLLF1-forward 5=-GTCAGTACACCATCCAGAGCC-3= BLLF1-reverse 5=-TTGGTAGACAGCCTTCGTATG-3= GAPDH-forward 5=-TGCACCACCAACTGCTAGC-3= GAPDH-reverse 5=-GGCATGGACTGTGGTCATGAG-3=
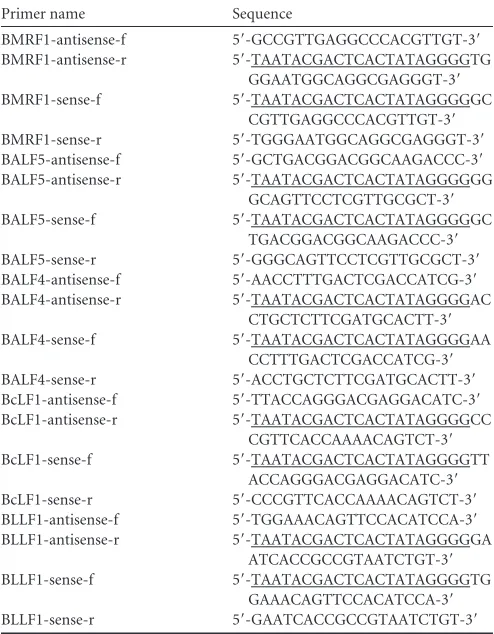
TABLE 2Oligonucleotide primer sequencea
Primer name Sequence
BMRF1-antisense-f 5=-GCCGTTGAGGCCCACGTTGT-3= BMRF1-antisense-r 5=-TAATACGACTCACTATAGGGGTG
GGAATGGCAGGCGAGGGT-3= BMRF1-sense-f 5=-TAATACGACTCACTATAGGGGGC
CGTTGAGGCCCACGTTGT-3= BMRF1-sense-r 5=-TGGGAATGGCAGGCGAGGGT-3= BALF5-antisense-f 5=-GCTGACGGACGGCAAGACCC-3= BALF5-antisense-r 5=-TAATACGACTCACTATAGGGGGG
GCAGTTCCTCGTTGCGCT-3= BALF5-sense-f 5=-TAATACGACTCACTATAGGGGGC
TGACGGACGGCAAGACCC-3= BALF5-sense-r 5=-GGGCAGTTCCTCGTTGCGCT-3= BALF4-antisense-f 5=-AACCTTTGACTCGACCATCG-3= BALF4-antisense-r 5=-TAATACGACTCACTATAGGGGAC
CTGCTCTTCGATGCACTT-3= BALF4-sense-f 5=-TAATACGACTCACTATAGGGGAA
CCTTTGACTCGACCATCG-3= BALF4-sense-r 5=-ACCTGCTCTTCGATGCACTT-3= BcLF1-antisense-f 5=-TTACCAGGGACGAGGACATC-3= BcLF1-antisense-r 5=-TAATACGACTCACTATAGGGGCC
CGTTCACCAAAACAGTCT-3= BcLF1-sense-f 5=-TAATACGACTCACTATAGGGGTT
ACCAGGGACGAGGACATC-3= BcLF1-sense-r 5=-CCCGTTCACCAAAACAGTCT-3= BLLF1-antisense-f 5=-TGGAAACAGTTCCACATCCA-3= BLLF1-antisense-r 5=-TAATACGACTCACTATAGGGGGA
ATCACCGCCGTAATCTGT-3= BLLF1-sense-f 5=-TAATACGACTCACTATAGGGGTG
GAAACAGTTCCACATCCA-3= BLLF1-sense-r 5=-GAATCACCGCCGTAATCTGT-3= af, forward; r, reverse. Underlining indicates the T7 promoter.
FIG 1RNAPII becomes localized inside BMRF1 cores at late stages of pro-ductive replication. Tet-BZLF1/B95-8 cells were treated with doxycycline to induce lytic replication and harvested at the indicated postinduction times. After treatment with mCSK buffer, they were fixed. (A) Harvested cells were stained with anti-BMRF1 (green), anti-BALF2 (red), and anti-RNAPII (yel-low) antibodies and observed by laser scanning confocal microscopy. The 2D images show brightest-point projections. Lower panels are merged images of the indicated combinations of the proteins. Pol II, RNA polymerase II. (B) Lytic replication-induced cells were stained with anti-BMRF1 (green) and an-ti-RNAPII (red). Projections of 60 images collected at 0.33-m steps in thez axis are displayed as 3D topographical reconstruction images of BMRF1 and RNAPII (left and middle panels, respectively). Representative 3D surface re-construction images are presented. Right panels are merged 3D surface recon-struction images. (C) The ratio of cells in which RNAPII was located outside the BMRF1 core to total BMRF1-positive cells was determined (black bar). White bars show the ratios of cells in which RNAPII was located inside the BMRF core to total BMRF1-positive cells. We regard cells as inside when 50% or more of RNAPII signal was detected inside the core. More than 100 cells were counted at each of the indicated time points.
on November 7, 2019 by guest
http://jvi.asm.org/
[image:2.585.40.287.398.715.2]DNA polymerase inhibitor, was added to the culture medium at a final concentration of 400g/ml.
Plasmid.For pcDNA-HA-BcRF1, the BcRF1 sequence was amplified from the B95-8 genome using the following primers: 5=-CGCGGGTACC GCCACCATGTATCCATATGACGTTCCAGATTACGCTACACAAGG TAAGAGGGAGAT-3=(forward) and 5=-CGCGGAATTCTTACACTTG AGCATCACGGC-3=(reverse). Underlined nucleotides indicate the hem-agglutinin (HA) epitope. The amplified DNA was digested with KpnI and EcoRI and then inserted into the KpnI/EcoRI sites of pcDNA3.
Immunofluorescence analyses.Immunofluorescence (IF) analyses were performed based on our previous studies (8,10). For immunofluo-rescence experiments, cells were extracted with 0.5% Triton X-100 – mCSK buffer (8) and then fixed with 70% ethanol. After permeabiliza-tion, samples were blocked for 1 h in 10% normal goat serum in phosphate-buffered saline (PBS) and incubated overnight with the anti-RNA polymerase II mouse monoclonal antibody, followed by secondary goat anti-mouse IgG antibodies conjugated with Alexa Fluor 594 (1 h). Anti-BMRF1 antibodies were directly labeled with a Zenon tricolor mouse IgG1 labeling kit (Molecular Probes). Cells were incubated with Alexa Flour 488-labeled anti-BMRF1 antibodies for 45 min and washed
three times with PBS, followed by a second fixation with 4% paraformal-dehyde solution in PBS for 15 min at room temperature. All of the pri-mary antibodies were employed at a 1:300 dilution, and the secondary antibodies were applied at a 1:500 dilution. All washes after antibody incubation were performed with PBS containing 0.1% normal goat serum and 0.01% Tween 20. The slides were mounted in ProLong Gold antifade reagent with 4=,6-diamidino-2-phenylindole (DAPI) (Molecular Probes) prior to microscopic analyses.
Quantitative RT-PCR.Total cell RNA was purified using TriPure iso-lation reagent (Roche) and subjected to real-time reverse transcription-PCR (RT-transcription-PCR) using a one-step SYBR PrimeScript RT-transcription-PCR kit II (TaKaRa) and a real-time PCR system 7300 according to the manufactur-er’s instructions. PCR was performed in 10l of solution containing 0.2
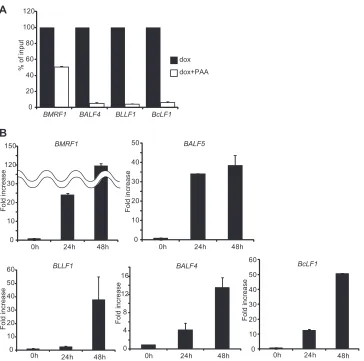
M primers, 0.2l ROX dye, and the sample RNA in 1⫻one-step SYBR RT-PCR buffer. The intensity of the ROX dye was used to compensate for volume fluctuations among the tubes. PCR included 5 min at 42°C, 10 s at 95°C, and 40 cycles at 95°C for 5 s, followed by 40 s at 60°C. Immediately after RT-PCR, the specificity of each PCR product was confirmed by dis-sociation curve analysis. An arbitrary RNA value was set to 1.0, and a standard curve was constructed using serial dilutions of RNA from the FIG 2BALF4,BLLF1, andBcLF1are late (L) genes. (A) Lytic replication-induced tet-BZLF1/B95-8 cells were cultured in the absence or presence of PAA (phosphonoacetic acid) and harvested at 48 h postinduction. Total RNAs were purified using TriPure isolation reagent and applied for real-time RT-PCR as described in Materials and Methods. Levels ofBMRF1,BALF4,BcLF1, andBLLF1mRNAs were normalized to GAPDH mRNA levels. The value obtained in the absence of PAA was set to 100%, and data are expressed as means⫾standard deviations (SD) from 3 biological replicates. dox, doxycycline. (B) Expression profiles for mRNA levels of EBV early (E) and L genes. Lytic replication-induced tet-BZLF1/B95-8 cells were harvested at 0, 24, and 48 h postinduction. Total RNAs were purified using TriPure isolation reagent and applied for real-time RT-PCR as described in Materials and Methods. Levels ofBMRF1,BALF5,BALF4, BcLF1, andBLLF1mRNAs were normalized to GAPDH mRNA levels. The value obtained at 0 h postinduction was set to 1, and data are expressed as means⫾ SD from 3 biological replicates.
on November 7, 2019 by guest
http://jvi.asm.org/
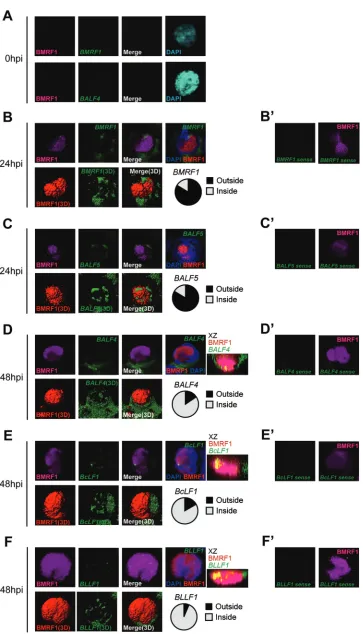
[image:3.585.113.477.62.423.2]FIG 3Alteration of viral gene transcription foci at early and late stages of EBV lytic replication. Lytic replication-induced tet-BZLF1/B95-8 cells were hybridized with DIG-labeled RNA FISH probes and then exposed to anti-BMRF1 antibodies (magenta), anti-DIG antibodies (green), and DAPI (blue). The data are presented as 3D reconstruction images (lower panels; merged images are at the right) and corresponding 2D images (upper panels). The 2D images show
on November 7, 2019 by guest
http://jvi.asm.org/
[image:4.585.113.476.60.694.2]RNA set to 1.0. The amount of mRNA was quantitated based on the standard curve. Real-time PCR with glyceraldehyde-3-phosphate dehy-drogenase (GAPDH) primers was also performed to serve as an internal control for input RNA. Primers used for RT-PCR are listed inTable 1.
Probe preparation for FISH.The EBV E or L gene open reading frames (ORFs) coding for BMRF1, BALF5, BALF4, BcLF1, and BLLF1 were amplified by PCR from a bacterial artificial chromosome (BAC)-cloned copy of the EBV B95-8 genome. The PCR primer pairs used to amplify each ORF are given inTable 2. Fluorescence in situ hybridization (FISH) probes were prepared using a DIG-RNA labeling kit (SP6/T7) (Roche Applied Science).
FISH.For FISH experiments, cells were fixed in 4% paraformaldehyde in PBS containing 10% acetic acid for 15 min at room temperature and washed with PBS, followed by a second fixation with 70% ethanol for 24 h at⫺20°C. After washing in Tris-buffered saline, cells were treated with 0.01% pepsin– 0.01N HCl for 5 min at 37°C and immediately rinsed with double-distilled water, followed by washing with PBS for 5 min and treat-ment with 1% formaldehyde in PBS for 10 min. For dehydration, fixed cells were treated with 70, 90, and 100% ethanol for 5 min each and then air dried. For immuno-RNA-FISH, postfixed cells were incubated with a prehybridization buffer containing 4⫻SSC (1⫻SSC is 0.15 M NaCl plus 0.015 M sodium citrate), 10% dextran sulfate, 0.2% bovine serum albu-min (BSA), sheared salmon DNA (0.5g/l),Escherichia colitRNA (0.25
g/l), and RNase inhibitor and hybridized with RNA probes in prehy-bridization buffer overnight at 42°C in a moist chamber. After sequential washes 3 times with 50% formamide in 1⫻SSC at room temperature, with 50% formamide in 1⫻SSC at 42°C, and with 2⫻SSC at room temperature, samples were blocked for 30 min in 4% milk in PBS contain-ing 0.05% Tween 20 and then exposed at room temperature to anti-BMRF1 mouse monoclonal antibodies (3 h), followed by Alexa 594-con-jugated secondary antibodies (2 h) and FITC-labeled anti-DIG sheep monoclonal antibodies (1 h). Samples then were mounted in ProLong Gold antifade reagent with DAPI prior to microscopic analysis.
Microscopy and image analyses.Images were captured and processed using an LSM510 Meta microscope (Carl Zeiss) with a Plan Apochromat 100⫻/1.4-numerical-aperture oil immersion objective. For 3D recon-struction with confocal laser scanning microscopy, images observed with an LSM510 Meta microscope were computerized to automatically make 50 to 100 serial optical sections at intervals of around 0.26m. The 3D reconstruction was performed with Imaris software (Carl Zeiss) based on the appropriate intensity threshold.
RESULTS AND DISCUSSION
RNA polymerase II migrates into BMRF1 cores with
progres-sion of lytic replication.
Viral IE, E, and L genes, like cellular
genes, are transcribed by RNA polymerase II (RNAPII) into
mRNAs. We first examined the localization of cellular RNAPII
in latent or lytic replication-induced tet-BZLF1/B95-8 cells
(
Fig. 1A
). In the latent phase, RNAPII was distributed throughout
nuclei, colocalizing with chromosomal DNA as judged by DAPI
staining. With lytic replication, RNAPII was recruited to viral
rep-lication compartments where BMRF1 and BALF2 reprep-lication
pro-teins were localized (
Fig. 1A
). Since viral transcription dominates
in lytically replicating cells, the majority of cellular RNAPII may
be recruited to viral transcription sites. Spatial arrangement of
RNAPII relative to the BMRF1 cores within replication
compart-ments was examined by time course imaging utilizing a 3D surface
reconstruction technique. The distribution of RNAPII relative to
BMRF1 cores was examined in cells at 12, 24, and 48 h
postinduc-tion, and the frequencies of cells with RNAPII outside and inside
BMRF1 cores were determined. At 12 h postinduction,
corre-sponding to the early stages of productive replication, RNAPII was
distributed throughout nuclei and surrounded the BMRF1 cores
in more than 70% of cells (
Fig. 1C
; a representative image is shown
in panel B). At this time point, a subset of cells having RNAPII
inside the BMRF1 core may reflect spontaneous reactivation
with-out induction. At 24 h postinduction, RNAPII localization tended
to become more restricted within nuclei (a representative image is
shown in
Fig. 1B
), and the frequency of cells with RNAPII outside
the BMRF1 cores decreased to approximately 50% (
Fig. 1C
). At 48
h postinduction, corresponding to late stages of infection, the cells
with RNAPII inside the BMRF1 cores accounted for more than
70% (
Fig. 1C
; a representative image is shown in panel B). Thus,
the localization of RNAPII shifted from outside to inside the
BMRF1 cores in concordance with progression of EBV lytic
rep-lication. These observations let us hypothesize that viral E gene
transcription and L gene transcription take place at different loci
within nuclei.
Spatial distributions of viral E and L gene transcripts.
We
designed experiments to examine the intracellular distribution of
viral E and L transcripts with mRNA FISH, expecting that
abun-dantly expressed viral mRNAs should transiently accumulate in
loci of transcription. mRNA FISH was combined with
immuno-staining of BMRF1 protein, and the results were analyzed using 3D
surface reconstruction imaging.
BMRF1
and
BALF5
(DNA polymerase) were selected as viral E
genes, while
BALF4
(gB, gp110),
BcLF1
(major capsid protein),
and
BLLF1
(gp350/220) were chosen as L genes. Levels of
BALF4
,
BcLF1
, and
BLLF1
mRNA signals were very low compared to that
of
BMRF1
mRNA signal in the presence of PAA treatment after 48
h postinduction (
Fig. 2A
), confirming that
BALF4
,
BcLF1
, and
BLLF1
are L genes. We performed quantitative RT-PCR analysis at
0, 24, and 48 h postinduction to establish the expression time
courses of E and L genes in our system. As shown in
Fig. 2B
, upper,
mRNA levels of the E genes
BMRF1
and
BALF5
became high at 24
h postinduction. In contrast, as shown in
Fig. 2B
, lower, mRNA
levels of L genes such as
BALF4
,
BcLF1
, and
BLLF1
were still low at
24 h postinduction, and their expression levels became high at 48
h postinduction. Sense and antisense RNA probes were
synthe-sized for each transcript in order to make sure that only the
anti-sense probes, but not the anti-sense probes, generated signals. As
ex-pected, cells undergoing lytic replication, verified by BMRF1
brightest-point projections of 60 images collected at 0.33-m steps on thezaxis. (A) Lytic replication-induced tet-BZLF1/B95-8 cells were harvested at 0 h postinduction and hybridized with antisense mRNA probes forBMRF1(upper panels) andBALF4(lower panels), followed by exposure to anti-BMRF1 monoclonal antibodies (magenta). (B and C) Lytic replication-induced tet-BZLF1/B95-8 cells were harvested at 24 h postinduction and hybridized with antisense mRNA probes forBMRF1(B) andBALF5(C), followed by exposure to anti-BMRF1 monoclonal antibodies (magenta). More than 30 cells were counted, and the ratio of the cells in which FISH signals were located outside the BMRF1 core to total BMRF1-positive cells was determined (circle chart, black). (D to F) Lytic replication-induced tet-BZLF1/B95-8 cells were harvested at 48 h postinduction and hybridized with antisense mRNA probes forBALF4(D),BcLF1(E), and BLLF1(F), followed by exposure to anti-BMRF1 monoclonal antibodies (magenta).x-z2D merged images, which show brightest-point sections in theyaxis, are also shown. More than 30 cells were counted, and the ratio of the cells in which FISH signals were located inside the BMRF1 core to total BMRF1-positive cells was determined (circle chart, gray). (B=to F=) As negative controls, cells were hybridized with a sense RNA probe forBMRF1(B=),BALF5(C=),BALF4(D=),BcLF1 (E=), andBLLF1(F=), followed by exposure to anti-BMRF1 monoclonal antibodies (magenta).
on November 7, 2019 by guest
http://jvi.asm.org/
protein expression, did not exhibit any mRNA FISH signals when
sense probes of
BMRF1
,
BALF5
,
BALF4
, and
BcLF1
were used
(
Fig. 3B
=
,
C
=
,
D
=
,
E
=
, and
F
=
).
On the other hand, when antisense probes of viral E (
BMRF1
and
BALF5
) and L transcripts (
BALF4
,
BcLF1
, and
BLLF1
) were
used as probes, nearly all of the cells undergoing lytic replication
(with BMRF1 protein expression) exhibited mRNA FISH signals
(
Fig. 3B
,
C
,
D
,
E
, and
F
). Importantly, the same antisense probes
for
BMRF1
,
BALF4
, and
BALF5
did not raise any signals in cells
prior to the induction of lytic replication (
Fig. 3A
and data not
shown). The results indicated that the FISH signals obtained with
the antisense probes actually represent the localization of viral E
and L mRNAs.
The distribution of viral E transcripts (
BMRF1
and
BALF5
)
relative to BMRF1 protein in lytically replicating cells was
exam-ined at 24 h postinduction. The mRNAs were found to form small
globular bodies at the nuclear periphery, partly concealing the
BMRF1 cores (
Fig. 3B
and
C
). Signals were also detected in the
cytoplasm, presumably representing mRNA that had been
ex-ported from nuclei. The frequencies of cells with viral E transcripts
at the periphery or inside BMRF1 cores were determined.
BMRF1
mRNA signals were observed outside BMRF1 cores in more than
80% of cells that were positive for BMRF1 protein expression
(
Fig. 3B
). Similarly,
BALF5
mRNA signals were observed outside
BMRF1 cores in more than 80% of BMRF1-positive cells
(
Fig. 3C
). The same results were obtained at 48 h postinduction
(data not shown).
We then examined the spatial distribution of viral L transcripts
(
BALF4
,
BcLF1
, and
BLLF1
) in cells at 48 h postinduction, which
was expected to be in the phase of maximal L gene expression (
20
).
In contrast to the localization of E transcripts, viral L transcripts
were frequently found to form globular structures in the inner
space of BMRF1 cores. The frequencies of cells with viral L
tran-scripts being inside BMRF1 cores were 85% for
BALF4
, 83% for
BcLF1
, and 93% for
BLLF1
(
Fig. 3D
,
E
, and
F
). L gene signals were
hardly detected at 24 h postinduction (data not shown) because
mRNA levels of BALF4, BcLF1, and BLLF1 remained low at 24 h
postinduction (
Fig. 2B
). Thus, these results support the idea that
EBV L gene transcription takes place inside the BMRF1 cores,
while E genes are predominantly transcribed at the periphery.
Recently, several studies have shed light on the regulation of
herpesvirus L gene expression (
22
–
25
). It appears to depend not
only on viral DNA replication but also on the presence of virally
encoded factors. In the case of EBV, Gruffat et al. reported that the
BcRF1
gene product binds to a TATT motif within the promoters
of various L genes, such as
BALF4
,
BcLF1
, and
BLLF1
, and it works
as an L gene-specific TATA binding protein (
25
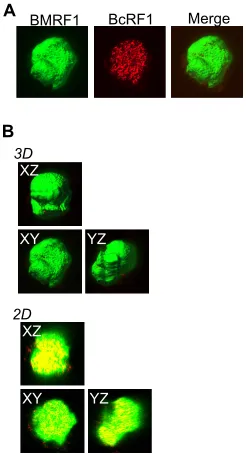
). Supporting this
idea, we observed that BcRF1 protein is localized inside BMRF1
cores in late stages of lytic replication (
Fig. 4A
and
B
).
We previously identified BMRF1 core structures within
repli-cation compartments and proposed a model for viral genome
DNA synthesis and maturation (
10
). First, viral DNA genomes are
synthesized by viral replication machinery outside the BMRF1
cores, coupled with homologous recombination by host HHR
fac-tors. The synthesized viral genomes are then stored inside the core,
where host MMR factors are loaded on the synthesized DNA to
repair mismatched base pairs for maturing intact viral genomes.
The BMRF1 cores therefore partition the replication
compart-ments into inside and outside subdomains, specifying viral
ge-nome synthesis and maturation, respectively. Consistent with this
model, our present study showed that E gene transcripts were
detected outside the BMRF1 cores, while L gene transcripts were
found inside (
Fig. 2
). It was previously demonstrated that viral L
gene transcription is dependent on viral DNA synthesis (
23
), and
newly synthesized viral genomes, which serve as the templates of L
gene transcription, are stored inside the BMRF1 cores (
10
). Thus,
it is reasonable that viral L gene transcription occurs inside
BMRF1 cores. Taking the available information together, we
pro-pose an advanced model of viral transcription loci in concordance
with inbound transition of viral genomes while they are replicated
by virally encoded replication machinery.
ACKNOWLEDGMENTS
This work was supported by grants in aid for Scientific Research from the Ministry of Education, Science, Sports, Culture and Technology of Japan (no. 23114512, 3390118, and 24659213 to T.T.). A.S. is supported by a Research Fellowship of the Japanese Society for the Promotion of Science for Young Scientists.
REFERENCES
1.Baer R, Bankier AT, Biggin MD, Deininger PL, Farrell PJ, Gibson TJ, Hatfull G, Hudson GS, Satchwell SC, Seguin C, et al. 1984. DNA sequence and expression of the B95-8 Epstein-Barr virus genome. Nature 310:207–211.
2.Imai S, Nishikawa J, Takada K.1998. Cell-to-cell contact as an efficient mode of Epstein-Barr virus infection of diverse human epithelial cells. J. Virol.72:4371– 4378.
3.Yoshiyama H, Imai S, Shimizu N, Takada K.1997. Epstein-Barr virus infection of human gastric carcinoma cells: implication of the existence of a new virus receptor different from CD21. J. Virol.71:5688 –5691. FIG 4BcRF1, the EBV late gene transactivator, is located inside the BMRF1 core. Tet-BZLF1/B95-8 cells were transfected with HA-BcRF1 expression vec-tor and then treated with doxycycline to induce lytic replication. Cells were harvested at 48 h postinduction, treated with mCSK buffer, fixed, and stained with anti-BMRF1 (green) and anti-HA (red) antibodies. (A) The data are presented as 3D surface reconstruction images of BMRF1 and HA-BcRF1 (left and middle panels). A merged 3D surface reconstruction image is also pre-sented (right panel). (B) The data are prepre-sented as serialx-y,x-z, andy-z3D surface reconstruction images (3D) and corresponding 2D images (2D). The 2D images show brightest-point sections in thex,y, orzaxis.
on November 7, 2019 by guest
http://jvi.asm.org/
[image:6.585.360.483.66.293.2]4.Babcock GJ, Decker LL, Volk M, Thorley-Lawson DA. 1998. EBV persistence in memory B cells in vivo. Immunity9:395– 404.
5.Henle W.1972. Role of Epstein-Barr virus in infectious mononucleosis and malignant lymphomas in man. Fed. Proc.31:1674.
6.Ben-Sasson SA, Klein G.1981. Activation of the Epstein-Barr virus ge-nome by 5-aza-cytidine in latently infected human lymphoid lines. Int. J. Cancer28:131–135.
7.Ragona G, Ernberg I, Klein G.1980. Induction and biological character-ization of the Epstein-Barr virus (EBV) carried by the Jijoye lymphoma line. Virology101:553–557.
8.Daikoku T, Kudoh A, Fujita M, Sugaya Y, Isomura H, Shirata N, Tsurumi T.2005. Architecture of replication compartments formed dur-ing Epstein-Barr virus lytic replication. J. Virol.79:3409 –3418. 9.Fixman ED, Hayward GS, Hayward SD.1995. Replication of Epstein-Barr
virus oriLyt: lack of a dedicated virally encoded origin-binding protein and dependence on Zta in cotransfection assays. J. Virol.69:2998 –3006. 10. Sugimoto A, Kanda T, Yamashita Y, Murata T, Saito S, Kawashima D,
Isomura H, Nishiyama Y, Tsurumi T.2011. Spatiotemporally different DNA repair systems participate in Epstein-Barr virus genome maturation. J. Virol.85:6127– 6135.
11. Cho MS, Milman G, Hayward SD.1985. A second Epstein-Barr virus early antigen gene in BamHI fragment M encodes a 48- to 50-kilodalton nuclear protein. J. Virol.56:860 – 866.
12. Li JS, Zhou BS, Dutschman GE, Grill SP, Tan RS, Cheng YC.1987. Association of Epstein-Barr virus early antigen diffuse component and virus-specified DNA polymerase activity. J. Virol.61:2947–2949. 13. Tsurumi T, Daikoku T, Kurachi R, Nishiyama Y. 1993. Functional
interaction between Epstein-Barr virus DNA polymerase catalytic subunit and its accessory subunit in vitro. J. Virol.67:7648 –7653.
14. Murayama K, Nakayama S, Kato-Murayama M, Akasaka R, Ohbayashi N, Kamewari-Hayami Y, Terada T, Shirouzu M, Tsurumi T, Yokoyama S.2009. Crystal structure of Epstein-Barr virus DNA polymerase proces-sivity factor BMRF1. J. Biol. Chem.284:35896 –35905.
15. Nakayama S, Murata T, Yasui Y, Murayama K, Isomura H, Kanda T, Tsurumi T.2010. Tetrameric ring formation of Epstein-Barr virus poly-merase processivity factor is crucial for viral replication. J. Virol.84: 12589 –12598.
16. Knipe DM, Howley PM, Griffin DE, Lamb RA, Martin MA, Roizman B, Straus SE.2007. Fields virology, 5th ed. Lippincott Williams & Wilkins, Philadelphia, PA.
17. Amon W, Farrell PJ.2005. Reactivation of Epstein-Barr virus from latency. Rev. Med. Virol.15:149 –156.
18. Tsurumi T, Fujita M, Kudoh A.2005. Latent and lytic Epstein-Barr virus replication strategies. Rev. Med. Virol.15:3–15.
19. Furnari FB, Adams MD, Pagano JS.1992. Regulation of the Epstein-Barr virus DNA polymerase gene. J. Virol.66:2837–2845.
20. Kieff E, Richinson A.2001. Epstein-Barr virus and its replication, p 2512–2573.InKnipe DM, Howley PM, Griffin DE, Lamb RA, Martin MA, Roizman B, Straus SE (ed), Fields virology, 4th ed, vol 2. Lippincott Wil-liams & Wilkins, Philadelphia, PA.
21. Lehman AM, Ellwood KB, Middleton BE, Carey M.1998. Compensa-tory energetic relationships between upstream activators and the RNA polymerase II general transcription machinery. J. Biol. Chem.273:932– 939.
22. Serio TR, Kolman JL, Miller G.1997. Late gene expression from the Epstein-Barr virus BcLF1 and BFRF3 promoters does not require DNA replication in cis. J. Virol.71:8726 – 8734.
23. Amon W, Binne UK, Bryant H, Jenkins PJ, Karstegl CE, Farrell PJ. 2004. Lytic cycle gene regulation of Epstein-Barr virus. J. Virol.78:13460 – 13469.
24. Chang PJ, Chang YS, Liu ST.1998. Characterization of the BcLF1 pro-moter in Epstein-Barr virus. J. Gen. Virol.79(Pt 8):2003–2006. 25. Gruffat H, Kadjouf F, Mariame B, Manet E.2012. The Epstein-Barr virus
BcRF1 gene product is a TBP-like protein with an essential role in late gene expression. J. Virol.86:6023– 6032.
on November 7, 2019 by guest
http://jvi.asm.org/