Stochastic Modeling Approach
Frederik Graw,aDanyelle N. Martin,bAlan S. Perelson,cSusan L. Uprichard,b,dHarel Daharib,c
Center for Modeling and Simulation in the Biosciences, BioQuant Center, Heidelberg University, Heidelberg, Germanya; The Program for Experimental and Theoretical Modeling, Division of Hepatology, Department of Medicine, Loyola University Medical Center, Maywood, Illinois, USAb; Theoretical Biology and Biophysics, Los Alamos National Laboratory, Los Alamos, New Mexico, USAc; Department of Microbiology and Immunology, Loyola University Medical Center, Maywood, Illinois, USAd
ABSTRACT
It has been proposed that viral cell-to-cell transmission plays a role in establishing and maintaining chronic infections.
Thus, understanding the mechanisms and kinetics of cell-to-cell spread is fundamental to elucidating the dynamics of
in-fection and may provide insight into factors that determine chronicity. Because hepatitis C virus (HCV) spreads from cell
to cell and has a chronicity rate of up to 80% in exposed individuals, we examined the dynamics of HCV cell-to-cell spread
in vitro
and quantified the effect of inhibiting individual host factors. Using a multidisciplinary approach, we performed
HCV spread assays and assessed the appropriateness of different stochastic models for describing HCV focus expansion.
To evaluate the effect of blocking specific host cell factors on HCV cell-to-cell transmission, assays were performed in the
presence of blocking antibodies and/or small-molecule inhibitors targeting different cellular HCV entry factors. In all
ex-periments, HCV-positive cells were identified by immunohistochemical staining and the number of HCV-positive cells per
focus was assessed to determine focus size. We found that HCV focus expansion can best be explained by mathematical
models assuming focus size-dependent growth. Consistent with previous reports suggesting that some factors impact HCV
cell-to-cell spread to different extents, modeling results estimate a hierarchy of efficacies for blocking HCV cell-to-cell
spread when targeting different host factors (e.g., CLDN1
>
NPC1L1
>
TfR1). This approach can be adapted to describe
focus expansion dynamics under a variety of experimental conditions as a means to quantify cell-to-cell transmission and
assess the impact of cellular factors, viral factors, and antivirals.
IMPORTANCE
The ability of viruses to efficiently spread by direct cell-to-cell transmission is thought to play an important role in the
establish-ment and maintenance of viral persistence. As such, elucidating the dynamics of cell-to-cell spread and quantifying the effect of
blocking the factors involved has important implications for the design of potent antiviral strategies and controlling viral escape.
Mathematical modeling has been widely used to understand HCV infection dynamics and treatment response; however, these
models typically assume only cell-free virus infection mechanisms. Here, we used stochastic models describing focus expansion
as a means to understand and quantify the dynamics of HCV cell-to-cell spread
in vitro
and determined the degree to which
cell-to-cell spread is reduced when individual HCV entry factors are blocked. The results demonstrate the ability of this approach to
recapitulate and quantify cell-to-cell transmission, as well as the impact of specific factors and potential antivirals.
V
iral entry into permissive cells is the first step in establishing
infection and is thus a common and often effective target for
antiviral therapy. However, after replication and assembly of viral
particles in an infected cell, many viruses, including hepatitis C
virus (HCV), can spread to infect additional cells by two routes of
transmission: cell-free and cell-to-cell spread (
1
,
2
). Although
vi-ral dissemination is facilitated by the release of “cell-free” virus
from infected cells, which can then travel throughout the body to
enter distant cells, direct cell-to-cell transmission allows the virus
to spread to neighboring cells while remaining shielded from host
neutralizing antibodies and other extracellular viral clearance
mechanisms (
3
,
4
). It is the latter advantage that implicates
cell-to-cell spread in the establishment and maintenance of persistent
infections and therapy failure (
3
,
5
,
6
).
Different mechanisms of direct viral cell-to-cell transmission
have been described (reviewed in references
1
and
2
). In cell
cul-ture, cell-to-cell spread of HIV-1 has been found to be much more
efficient than cell-free virus uptake, with estimates ranging
be-tween 10-fold- and 18,000-fold-higher efficiency in mediating
vi-ral spread (
7–11
). However, while HIV-1 cell-to-cell transmission
is more efficient, it appears to be mediated by the same factors that
are involved in cell-free virus entry, as it has been found to be
equally sensitive to inhibition by the same fusion inhibitors and
receptor-blocking antibodies that inhibit cell-free virus entry (
8
).
Consistent with cell-to-cell spread being efficient, cell-to-cell
transmission has been implicated in mediating HCV persistence
Received8 January 2015 Accepted24 March 2015
Accepted manuscript posted online1 April 2015
CitationGraw F, Martin DN, Perelson AS, Uprichard SL, Dahari H. 2015. Quantification of hepatitis C virus cell-to-cell spread using a stochastic modeling
approach. J Virol 89:6551–6561.doi:10.1128/JVI.00016-15.
Editor:R. W. Doms
Address correspondence to Frederik Graw,
[email protected], or Susan L. Uprichard, [email protected].
S.L.U. and H.D. contributed equally to this work.
Copyright © 2015, American Society for Microbiology. All Rights Reserved.
doi:10.1128/JVI.00016-15
on November 7, 2019 by guest
http://jvi.asm.org/
(
12–14
) and possibly playing a role in viral escape during therapy
by allowing the spread of viral variants resistant to direct-acting
antivirals (
15
). For HCV infection, cell-to-cell transmission has
been studied
in vitro
using HCV focus spread assays in which
cell-free virus uptake is blocked by neutralizing antibodies against
the HCV E2 glycoprotein (
6
,
13
,
16
,
17
). Based on these
in vitro
studies, it appears that the factors that mediate HCV cell-free viral
spread do not completely overlap those involved in cell-to-cell
spread, and thus some inhibitors block cell-free entry but not
cell-to-cell spread (
6
,
16
). However, the dynamics of cell-to-cell
spread has not been determined and the involvement of different
HCV entry factors on the kinetics of cell-to-cell spread has not
been quantified.
Mathematical modeling has been widely used to understand
viral infection dynamics and treatment response; however, these
models typically assume only cell-free virus infection mechanisms
(
18–23
).
In vitro
mathematical models were developed to
under-stand intracellular HCV RNA kinetics during infection and
treat-ment (
24–26
) and cell-free HCV entry (
27
). Models accounting
for the dynamics of cell-to-cell viral spread have been developed
for HIV-1 (
3
,
28–31
), as well as for oncolytic virotherapy (
32
).
However, there are no mathematical models specifically
address-ing the kinetics of HCV cell-to-cell spread
in vitro
.
In this study, we performed experiments to monitor the
kinet-ics of HCV cell-to-cell spread and the effect of blocking different
HCV entry factors on those kinetics. To quantify and provide
insight into the dynamics of cell-to-cell spread, we developed
mathematical models that describe focus growth assuming
differ-ent modes of expansion and that account for stochastic variability
in the initiation and the growth rates of individual foci. Fitting our
models to the observed experimental data, we determined that
models assuming size-dependent focus growth best recapitulate
the data. To quantify the effect of blocking different HCV entry
factors, such as the tetraspanin CD81, claudin-1 (CLDN1), the
Niemann-Pick C1-like 1 receptor (NPC1L1), and transferrin
re-ceptor 1 (TfR1), on focus expansion, we performed experiments
in the presence of blocking antibodies and small-molecule
inhib-itors. Consistent with previous reports suggesting differential
re-quirements for individual cellular factors in HCV cell-to-cell
spread, blocking CLDN1 and NPC1L1 potently reduced focus
ex-pansion, while blocking TfR1 and CD81 resulted in more
inter-mediate effects. The results demonstrate the ability of this
ap-proach to recapitulate and quantify cell-to-cell transmission, as
well as the impact of specific factors and potential antivirals.
MATERIALS AND METHODS
Cells.Huh7 cells (33) (also known as Huh7/scr cells [34,35] and Huh7-1 cells [36]) were obtained from Francis Chisari (The Scripps Research In-stitute, La Jolla, CA). Cells were cultured in Dulbecco’s modified Eagle’s medium (DMEM) (Mediatech) supplemented with 10% fetal bovine se-rum (FBS) (HyClone, Logan, UT), 100 units/ml penicillin, 100 mg/ml streptomycin, and 2 mML-glutamine (Gibco Invitrogen, Carlsbad, CA). Virus.Plasmid DNA containing the full-length HCV JFH-1 genome (pUC-JFH1) was provided by Takaji Wakita (National Institute of Infec-tious Diseases, Tokyo, Japan) (37–39). Methods for HCV RNAin vitro
transcription, HCV RNA electroporation, as well as propagation and titration of HCV cell culture (HCVcc) stocks have been described in detail elsewhere (40).
Reagents and antibodies.Dimethyl sulfoxide (DMSO) stocks of ezetimibe (Sequoia Research Products) and the TfR1 inhibitor ferristatin (NSC306711; National Cancer Institute) were diluted into culture
me-dium to the indicated concentrations. Rabbit anti-human CLDN1 poly-clonal antibody was obtained from Abcam (Cambridge, MA). Rabbit anti-human NPC1L1 polyclonal antibody was obtained from Santa Cruz Biotechnology (Santa Cruz, CA). TfR1 monoclonal antibody (clone M-A712) was obtained from BD Pharmingen (San Jose, CA). Mouse anti-human CD81 monoclonal antibody (clone 1D6) was purchased from AbD Serotec (Raleigh, NC). Inhibition of all these HCV entry factors by antibodies/inhibitors has been previously reported by us or others to block HCV cell-free entry without affecting HCV RNA replication (6,16, 41,42). The human anti-HCV E2 monoclonal antibody (MAb) AR3A (or C1), obtained from Dennis Burton and Mansun Law (The Scripps Re-search Institute, La Jolla, CA), was described previously (33,43,44). Horseradish peroxidase (HRP)-conjugated anti-human, anti-mouse, and anti-rabbit secondary antibodies were purchased from Pierce (Rockford, IL). Negative-control IgG antibodies were obtained from Santa Cruz Bio-technology.
Cell-to-cell spread “focus size” assay.Confluent monolayers of Huh7 cells were infected with 50 focus-forming units (FFU) of HCVcc. After 17 h of incubation, the viral inoculum was removed, cells were rinsed with phosphate-buffered saline (PBS), and medium containing 10 g/ml anti-E2 was added to neutralize cell-free virus infection as previously de-termined (6,13,16). Additional indicated treatments were performed in parallel with anti-E2 treatment for the duration of the experiment to assess the effect of blocking different host factors on HCV cell-to-cell spread. For antibody inhibition experiments, all blocking antibodies were used at 25g/ml in a total volume of 100l, a concentration that ensured that the maximal effect of each antibody was achieved. Triplicate wells were fixed and stained to detect HCV-positive foci. The number of HCV-positive cells per focus was counted as a readout of HCV cell-to-cell spread. To determine the degree of cell division during the assay period, cell counts from equiva-lently infected and treated triplicate wells were performed at the time of in-fection and 72 h postinoculation at the time of fixing.
Immunostaining of HCV positive foci.Immunostaining of HCV-positive cells was described previously (40). Briefly, endogenous peroxi-dases were blocked by incubating fixed cells in 1⫻PBS containing 0.3% (vol/vol) hydrogen peroxide (Fisher, Fairlawn, NJ). Following three washes with 1⫻PBS, cells were permeabilized and blocked for 1 h with 1⫻PBS containing 0.5% (vol/vol) Triton X-100 (Fisher), 3% (wt/vol) bovine serum albumin (BSA) (Sigma), and 10% (vol/vol) FBS. The pri-mary human HCV E2 MAb AR3A was diluted to 2.3g/ml in 1⫻PBS containing 0.5% (vol/vol) Triton X-100 and 3% (wt/vol) BSA and incu-bated with cells for 1 h at room temperature. Bound anti-E2 was subsequently detected with a 1:1,000 dilution of an HRP-conjugated anti-human antibody (Pierce) followed by a 30-min incubation with a 3-ami-no-9-ethyl-carbazole (AEC) detection substrate (BD Biosciences). Cells were washed with distilled water (dH2O), and foci were quantified and
photographed using a Nikon TE2000U microscope (Nikon Instruments). Mathematical models of HCV focus expansion.We assume that each focus of HCV-infected cells is founded by a single infected cell that be-came infected at timet0. The size of each focus, measured in number of
cells [N(t)], changes over time according to a stochastic model represent-ing the propagation of infection to other cells: the probability of a cluster of sizekexisting at timetto expand to a cluster of sizek⫹1, withk⫽
1,2,. . ., in a small interval of timehgiven that the first cell became infected at timet0, is denoted by
P[N(t ⫹h)⫽k⫹ 1
ⱍ
N(t) ⫽ k;t0]⫽ k ⫹ o(h)k ⫽1, 2, ... (1)
Here,krepresents the growth rate of the cluster from sizektok⫹1.
The first cell of each focus is assumed to have become infected in a time window of 0 to 17 h postinoculation before E2 and individual anti-body/inhibitor treatments were applied; i.e.,t0is between 0 and 17 h. The
initiation of infection could have occurred at any point during this time interval. Thus, the time of infection,t0, is assumed to follow a probability
distribution truncated on the time interval from 0 to 17 h. The actual distribution fort0with density functionf(t) (see equation 8) is inferred
on November 7, 2019 by guest
http://jvi.asm.org/
from our experimental data (45) as described below. Based on the lack of any observed cell death, we also assume that no cell death occurs during the 72-h assay.
The transition probabilities described in equation 1 lead to the follow-ing equations for the conditional state probabilitiespk(t|s)⫽P[N(t)⫽
k|s]:
dp1⁄dt⫽ ⫺1p1 dp2⁄dt⫽ 1p1 ⫺2p2
⯗ ⯗ ⯗
dpk⁄dt⫽ k⫺1pk⫺1 ⫺kpk
⯗ ⯗ ⯗
(2)
wherepk,k⫽1,2, . . . is shorthand for the probability that a focus contains
kcells at timetgiven that the focus was founded at times,pk(t|s). We
assume that each focus is founded by one infected cell at times, which is equivalent to the initial conditionsp1(s|s)⫽1 andpk(s|s)⫽0,k⬎1. For
allt⬍s,pk(t|s)⫽0,k⫽1,2,. . . ., as no cell is infected before times. The
system of equation 2 can be solved oncekis specified (see below) to
determine the probability generating function for the conditional state probabilitiespk(t|s) (46). The probability that we would observe a cluster
of sizekat a timetafter anti-E2 treatment (t⬎17 h), given that the first cell of the focus became infected at timesin the time interval from 0 to 17 h postinoculation, can then be calculated by integrating over all possible times at which a focus could have been initiated, i.e.,
pk(t)⫽
兰
0 17hpk(t
ⱍ
s)f(s)ds, t⬎17 h (3)With this, the probability of observing, for example, a focus of size 12 or larger is then given by
pⱖ12(t)⫽1⫺
兺
k⫽1 11pk(t).
As stated earlier, each focus is assumed to be established by a single cell that became infected by an HCV particle administered to the culture at time zero. Because there is an eclipse phase of⬃24 h (42) between the time a cell becomes infected and the time progeny virus are secreted into the medium and we removed the original viral inoculum when neutraliz-ing anti-E2 was added to the culture at 17 h postinoculation, we assume that all virus transmission in a specific focus is due to cell-to-cell trans-mission of progeny virus from the founding cell. We then made the fol-lowing different assumptions about the growth rate,k, with each
corre-sponding to different assumed focus growth dynamics.
(i) Poisson process.In the simplest scenario, we assume a constant growth rateindependent of the size of the focus, hence,k⫽ ,k⫽1,2,
. . . . In this case, foci grow according to a Poisson process, where the time between infection events is exponentially distributed with parameter (46). In this scenario, the probability of observing a cluster of sizekat time
t⬎17 h (equation 2) is given by
pk(t)⫽
兰
0 17he⫺(t⫺s)
关
共
t⫺s兲兴
k⫺1共
k ⫺1兲
! f(s)ds, t⬎17 h (4) This formulation represents focus growth dynamics that is not depen-dent on the limitations that would be inherent in a growth process solely depending on cell-to-cell transmission, especially for larger focus sizes.(ii) Birth process.A second possible assumption would be a birth process where each infected cell in a focus can give rise to another infected cell with a constant rate, i.e.,k⫽k(46). In this case, the probability of
observing a cluster of sizekat timetis given by
pk(t)⫽
兰
0 17he⫺共t⫺s兲
共
1⫺e⫺共t⫺s兲兲
k⫺1f(s)ds, t⬎17 h (5)Under this assumption, at later times even when infected cells are completely surrounded by other infected cells (termed inner
focus-in-fected cells), these cells would still contribute to the expansion of the focus (Fig. 1).
(iii) Boundary process.A third possible assumption is a boundary expansion process, where only infected cells at the perimeter of the focus contribute to focus expansion (Fig. 1). Thus, the growth rate of a focus of sizek,k, depends on the number of infected cells at the edge of the focus
that are in direct contact with uninfected hepatocytes,IB. This size of the
focus boundary and, thus, the growth rate vary with increasing cluster size. Considering compact focus expansion, cluster growth can be as-sumed to occur radially. A focus comprisingkinfected cells would cover an area (A) ofr2, whereris the radius of the cluster, and hence,k⬃ r2.
Analogously, we can approximate the boundary cells byIB⬃2r. As only
cells at the edge of the cluster would contribute to focus growth, the growth rate per infected cell of the total cluster is given byIB0/k, where0
defines the basic infection rate per cell. The growth rate of a focus of sizek
is then defined by
k⫽k IB
k0⫽k
2r
r20⫽2
兹
k0 (6)withr⫽
兹
k⁄. Defining ⫽2兹
0, i.e.,k⫽兹
k, we can calculate the probability of observing a focus of sizekat timetgiven that the focus was established at timet0bypk(t|t0)⫽
再
e⫺(t⫺t0) fork⫽1
兺
j⫽1 k
ak,je⫺兹j共t⫺t0兲 forkⱖ2
(7)
withak,jdefined by
ak,j⫽
共
⫺1兲
k⫺1冑
j ki⫽兿
1,i⫽jk
冉
兹
i兹
j⫺兹
i冊
The detailed derivations and mathematical proofs for the state prob-abilities in equation 7 are given in the Appendix. Using equation 7 in equation 3, we can derive the probability of observing a focus of sizekat the end of the experiment, i.e.,t⫽72 h.
Distribution for the time to infection of the first cell in a focus,t0.We
previously demonstrated that the rate of HCVcc infection initiation after
FIG 1Depiction of cells that contribute to focus expansion in the birth and boundary models. Shown is a sample 12-cell focus. In the birth model, all HCV-infected cells of a focus contribute to focus expansion (i.e., red and light red cells); in the boundary model, only cells at the perimeter of a focus can mediate focus growth (i.e., only light red cells). Of note, the boundary model assumes a compact focus shape, i.e., infected cells are approximately distrib-uted in a circle.
on November 7, 2019 by guest
http://jvi.asm.org/
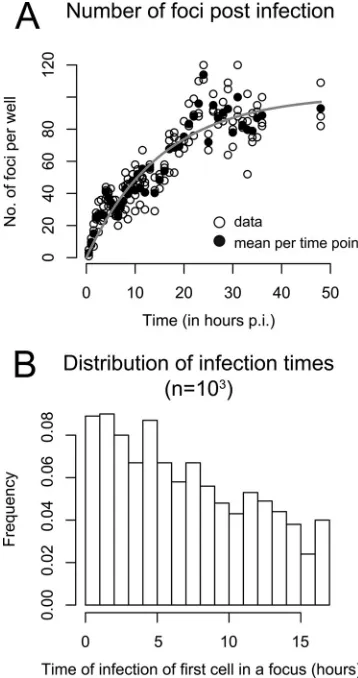
[image:3.585.320.523.65.268.2]viral inoculation is not constant but rather decreases over time (seeFig. 1 in reference45). If the infection rate was constant, then the number of foci would increase linearly over time. However, as shown in reference45, the number of foci increases more slowly than linearly. To match the data, we assume that the infection rate0decreases exponentially over time with a
loss rate␣; hence,(t)⫽ 0e-␣t. This is equivalent to assuming that virions
lose infectivity at rate␣. Fitting(t) to the data, we estimated0and␣to
determine the distribution of the time to infection of the first cell of a focus. The data and the best fit of(t) using our derived estimates of␣ ⫽ 0.065 h⫺1and
0⫽6.59 foci per hour are shown inFig. 2A. A possible
distribution oft0at which the first cell of a focus becomes infected after
inoculation of the culture with HCVcc and before antibody treatment, i.e.,t0僆[0, 17 h], is shown inFig. 2B.
The corresponding density function for the time to infection of the founding cell of a focus,f(t), truncated on the time interval from 0 to 17 h is then defined by
f(t)⫽ d
dt
冢
兰
0 t
0e⫺␣sds
兰
017h
0e⫺␣sds
冣
⫽1⫺␣ee⫺␣⫺␣t17h (8)
The definition off(t) as given in equation 8 is then used in equation 3 when the focus growth rateis estimated. Assuming that the infection rate decays in a multiphasic manner, as observed in reference45, which leads to a biphasic infection rate on the interval from 0 to 17 h, does not lead to a significant change in our results (data not shown).
Data fitting.We fitted equation 3 with the different scenarios for the focus expansion rate,k, given by equations 4 to 7, to the data using a
maximum likelihood approach. The log likelihood of observingn differ-ent foci in the culture at 72 h, with each focus comprisingki,i⫽1,. . .,n
infected cells, is then denoted by
ᐉ(|k,t⫽72h)⫽
兺
i⫽1 nln
关
pki
共
t⫽72h兲
兴
(9)Equation 9 was maximized to estimateusing the fitting routine op-tim in the R language of statistical computing (47).
RESULTS
HCV focus expansion is best described by mathematical models
assuming focus size-dependent growth rates.
In order to
moni-tor the kinetics of HCV cell-to-cell spread, we performed focus
formation assays in which a neutralizing antibody to the HCV E2
glycoprotein is used to block cell-free virus infection such that
focus expansion is dependent on cell-to-cell viral transmission (
6
,
13
,
16
,
17
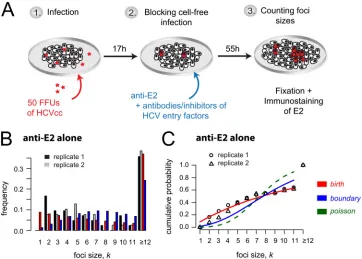
). Specifically, as depicted in
Fig. 3A
, confluent Huh7 cell
cultures were inoculated with 50 FFU of HCVcc for 17 h to allow
time for
⬃
80% viral entry into
⬃
40 individual single cells (
45
).
Cells were then washed, and cell-free virus spread was blocked by
the addition of anti-E2 at a concentration that neutralizes
extra-cellular virus infection of cells (
6
,
13
,
16
). At 72 h postinoculation,
cell monolayers were fixed and stained for HCV-positive cells. The
extent of cell-to-cell spread was assessed by counting the number
of HCV-positive cells per focus. Across experiments, under these
conditions (i.e., anti-E2-only treatment), we observed an average
of 41
⫾
2 (standard deviation [SD]) individual foci per well, with
⬃
35% of the foci consisting of 12 or more infected cells (
Fig. 3B
).
Despite the fact that the assay was performed in confluent
monolayers, limited cell division still occurred under these
exper-imental conditions, and thus, net focus expansion could be
af-fected not only by cell-to-cell virus transmission but also by
pro-liferation of infected cells. Hence, in parallel equivalently treated
wells, we counted the number of cells present at the time of
infection and at 72 h postinoculation, when the assay ended, to
estimate the number of cell divisions that had occurred.
Though the precise cell count varied between experiments, we
observed an average
⬃
5.3-fold (
⫾
0.7-fold) increase in the
number of cells during the 72-h experiment in untreated
cul-tures and in those treated with anti-E2 alone, indicating that
approximately 2 to 2.5 cell divisions had occurred. As such, cell
division alone could in theory result in foci containing up to 4
to 6 cells; however, because HCV-infected cells divide more
slowly than noninfected cells (
48
), we assume that cell
prolif-eration could account for foci containing up to 4 cells.
To elucidate the dynamics of focus expansion observed and
more accurately quantify the kinetics of spread, we fitted three
mathematical models to the observed data that describe focus
ex-pansion as a stochastic process according to different assumptions
(see Materials and Methods). The different models explicitly
ac-count for the fact that individual foci are initiated at different time
points during the 17 h before anti-E2 is added to the culture (
Fig.
2
). The Poisson model, which assumes that foci grow at a constant
rate independent of focus size,
k⫽
, did not fit the observed data
FIG 2Time of infection of the first cell in a focus. (A) Analysis of the experi-mental data from reference45indicates that the number of foci per well de-pends on the time postinoculation (p.i.). Open circles indicate numbers of foci counted in triplicate wells. Filled circles are means for each time point. The gray curve shows the fit of a time-dependent infection rate,(t), to the data, assuming an exponential loss of infectivity over time,(t)⫽ 0e⫺␣t. (B)
Dis-tribution of the time of first cell infection in a focus in the period from 0 to 17 h. The plot shows the histogram for 1,000 random draws.
on November 7, 2019 by guest
http://jvi.asm.org/
[image:4.585.72.251.67.406.2]well (
Fig. 3C
). In contrast, the birth and boundary models, which
are based on the assumption that the rate of focus expansion
de-pends on the current size of the focus, led to better fits of the
experimental data (
Fig. 3B
and
C
). Ruling out the Poisson model
is consistent with the anti-E2 treatment inhibiting cell-free virus
infection, confirming that the focus expansion observed was
me-diated solely by cell-to-cell transmission and potentially
prolifer-ation of infected cells.
With a model assuming that individual foci grow according to
a birth process where each infected cell of a focus can contribute to
focus expansion,
k⫽
k
, we estimate a focus expansion rate of
⫽
0.038 h
⫺1[0.034, 0.041] (
Table 1
). This model provides a
good explanation of the experimental data; however, it
overesti-mates the frequency of foci of size
k
⫽
1 (
Fig. 3B
and
C
). As a
modification of the birth model, the boundary model assumes
that focus expansion is mainly driven by infected cells at the
boundary of the focus. While both models fit the data reasonably
well, the boundary model overestimates intermediate focus sizes
(
Fig. 3B
) and provides a slightly impaired fit to the data compared
to the birth model as measured by the Akaike information
crite-rion (AIC), where a lower AIC value indicates a better fit of the
model (
49
) (corrected AIC for the birth model, 348.9; that for the
boundary model, 369.7). The boundary model leads to estimates
of the focus expansion rate that are roughly twice as high as those
[image:5.585.111.473.66.325.2]FIG 3HCV cell-to-cell spread assays with observed and predicted focus size distribution. (A) Sketch of the experimental protocol. (B) Distribution of focus sizes at 72 h postinoculation, when cell-free virus is neutralized by anti-E2 treatment. Foci comprising 12 or more cells were combined. Observed data from two replicate wells (black and gray) compared to model predictions (red, birth model; blue, boundary model) are shown. Results are representative of over 5 experiments in which the anti-E2-alone condition was included. (C) Agreement of model fits (lines) and data (symbols) can best be determined when looking at the cumulative probability of observing a focus that comprises up tokinfected cells. The birth model (red line) provides the best fit to the data.
TABLE 1Estimated HCV focus expansion rates using different mathematical modelsa
Treatment Parameter
Value with model
Poisson Birth Boundary
Anti-E2 (10⫺2per hour) 10.83 (9.79, 12.13) 3.76 (3.49, 4.02) 6.70 (6.22, 7.27)
LL ⫺224.5 ⫺173.4 ⫺183.8
AIC 453.2 348.9 369.7
Anti-E2⫹IgG (10⫺2per hour) 7.91 (7.10, 8.66) 3.07 (2.84, 3.27) 5.24 (4.85, 5.69)
LL ⫺276.6 ⫺222.4 ⫺233.2
AIC 557.4 446.8 468.5
aFocus expansion rates during anti-E2 treatment alone and with additional IgG control treatment were estimated assuming constant focus expansion,
k⫽ (Poisson), or
size-dependent focus expansion,k⫽k(birth) ork⫽
兹
k(boundary) after 17 h p.i. Triplicates of each condition were combined in the fitting procedure. Numbers in parenthesesare the 10% and 90% percentiles over 200 bootstrap replicates of the data. The maximized value of the log likelihood function (equation 8) (LL) determines the quality of the fit. The higher the LL, the better the model explanation of the data. In addition, the corrected Akaike information criterion (AIC) for model comparison is shown, indicating a consistent improper fit of the Poisson model. Analysis of one representative experiment of 5 is shown.
on November 7, 2019 by guest
http://jvi.asm.org/
[image:5.585.38.553.577.678.2]for the birth model,
⫽
0.067 h
⫺1[0.062, 0.073] (
Table 1
).
Be-cause the birth and the boundary models represent the two
ex-treme scenarios of size-dependent focus growth, we proceeded
under the assumption that the actual growth rate lies between the
values estimated by these two models.
Quantification of focus expansion when blocking specific
host factors with antibodies.
It has been previously reported that
blocking host factors, such as NPC1L1 (
6
), CLDN1 (
4
,
13
), TfR1
(
16
), and possibly CD81 (
4
,
13
,
14
,
50–52
), inhibits HCV
cell-to-cell spread. In order to quantify the effect of blocking these host
cell factors on HCV cell-to-cell spread, we performed the same
focus cell-to-cell spread assay described above, but cultures were
additionally cotreated with antibodies that block individual HCV
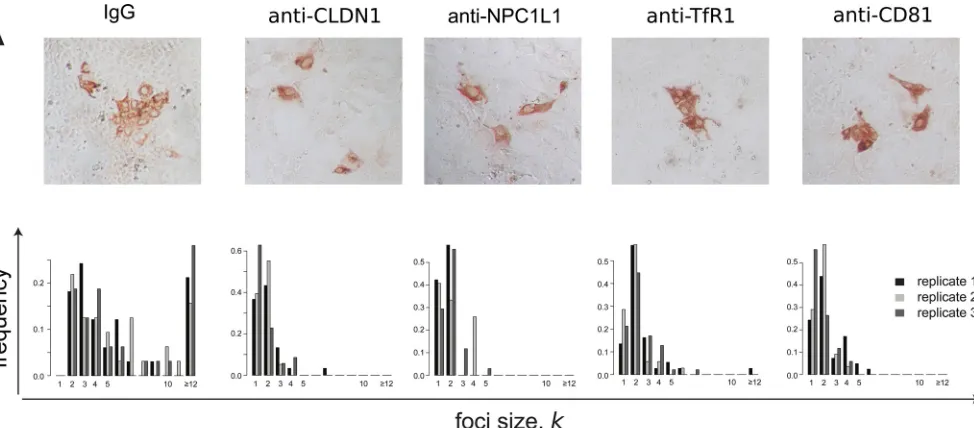
entry factors, in particular, NPC1L1, CLDN1, TfR1, and CD81. As
a negative control, parallel cultures were cotreated with
nonspe-cific IgG. At 72 h postinoculation, cell monolayers were fixed and
stained for HCV E2 (
Fig. 4A
), so that the number of cells per focus
could be counted (
Fig. 4B
). Again, in parallel infected and
equiv-alently treated wells, we counted the number of cells present at the
time of infection and at 72 h postinoculation, when the assay
ended, to estimate the number of cell divisions that occurred
un-der each treatment condition. In contrast to the average
⬃
5.3-fold
⫾
0.7-fold increase in cell number observed in the untreated
and anti-E2-alone-treated cultures, cell numbers increased only
⬃
2-fold
⫾
0.4-fold during the 72-h experiment in cultures treated
with any of the other antibodies or small-molecule inhibitors
(
Table 2
). Thus, in this case, foci comprising 2 cells could be due to
cell division alone. Under all of these conditions, we observed on
average 37
⫾
7 individual foci per well. However, foci in cultures
treated with anti-NPC1L1 or anti-CLDN1 had an average focus
size of only 1 or 2 cells with a maximum of 5 or 7 cells, respectively,
consistent with high levels of inhibition of cell-to-cell spread.
Since the appropriateness of the Poisson model was ruled out
above because it generated poor fits to the observed data, we
quan-tified the effect of the various antibodies on HCV focus expansion
rates using the birth and the boundary models. Both models
indi-cate that cotreatment of cultures with control IgG led to an
⬃
20%
nonspecific reduction of focus expansion rates (
Table 1
), which is
at least in part due to the reduced cell proliferation observed
dur-ing treatment with the IgG (
Table 2
). To control for this reduced
cell proliferation and estimate the effect of blocking the targeted
host factors, in these assays we defined the focus expansion rate by
k⫽
(1
⫺
ε
)
kIgG,
k
⫽
1,. . .,
n
, where
kIgGdefines the baseline
expansion rate calculated from the IgG control (
Table 1
). The
parameter
ε
represents the degree to which focus expansion was
reduced in the presence of the different antibody treatments, with
ε
⫽
0 indicating no specific effect and
ε
⫽
1 defining 100% inhibition
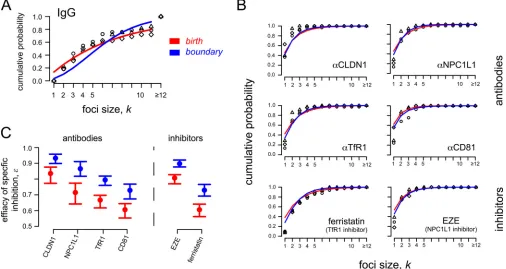
of focus growth. Model fits are shown in
Fig. 5A
and
B
. Both models
indicate a similar hierarchy of efficacies for reducing HCV focus
ex-pansion when these different host factors are targeted (
Table 3
and
Fig. 5C
). Blocking CLDN1 with antibodies showed the largest
[image:6.585.52.539.66.280.2]reduc-FIG 4Blocking different cellular HCV entry factors exhibits differential effects on HCV focus expansion. HCV cell-to-cell spread assays were performed in the presence of neutralizing anti-E2 plus IgG, anti-CLDN1, anti-NPC1L1, anti-TfR1, or anti-CD81. (A) Representative images of foci formed 72 h postinoculation. HCV-infected cells were stained for E2 (red). (B) Distribution of focus sizes at 72 h postinoculation. For each condition, 3 replicate wells were analyzed. Results of one representative experiment of three are shown.
TABLE 2Proliferation of cells during thein vitrofocus assaya
Treatment
Fold increase
(mean⫾SD) Average fold increase
None 5.4⫾1.0 Untreated, 5.3⫾0.7 Anti-E2 5.1
IgG 2.4⫾1.0 Specifically treated, 2.0⫾0.4 Anti-CLDN1 1.4⫾0.4
Anti-NPC1L1 1.7⫾0.4 Anti-TfR1 1.9⫾0.2 Anti-CD81 1.9⫾0.1 EZE 1.9⫾0.7 Ferristatin 2.7⫾0.2
aDuring each experiment, cell number was counted in equivalently treated cell cultures
at the time of infection and at 72 h p.i. The averages for triplicate wells from one representative experiment of three are shown.
on November 7, 2019 by guest
http://jvi.asm.org/
[image:6.585.298.545.571.697.2]tion of focus growth of
⬃
93% for boundary (
⬃
84% for birth).
Antibody blocking of NPC1L1 exhibited a slightly less potent
reduc-tion of
⬃
87% (
⬃
72%). Antibodies against TfR1 resulted in even less
inhibition of
⬃
80% (
⬃
67%), and antibodies against CD81 resulted
in the least inhibition,
⬃
77% (
⬃
64%). As the amount of cell
prolif-eration is comparable among the different treatment regimens (
Table
2
), the estimated efficacy
ε
mainly represents the effect of the
treat-ments on cell-to-cell transmission rates.
Quantification of focus expansion when specific host factors
are blocked with small-molecule inhibitors.
To confirm the
above antibody results, we performed the same focus assay but
used an alternative blocking strategy utilizing the small-molecule
inhibitors ezetimibe and ferristatin, which specifically inhibit
NPC1L1 and TfR1, respectively. In this case, estimated focus
ex-pansion rates with anti-E2 treatment alone,
kanti-E2, were
consid-ered the baseline expansion rates, and the focus expansion rate
was defined as
k⫽
(1
⫺
ε)
kanti-E2. Importantly, similar to what
was observed with anti-NPC1L1, ezetimibe blocking of NPC1L1
led to a similar reduction in focus growth (
⬃
90% [
⬃
81%]).
Like-wise, the inhibition of focus growth under ferristatin treatment
was comparable to the efficacy of anti-TfR1, with an
⬃
73%
(
⬃
61%) reduction in focus growth (
Fig. 5B
and
Table 3
). Of note,
although the effects measured were similar to that observed in
response to antibody blocking of these receptors, the anti-E2-only
control cultures exhibited more cell proliferation during the assay,
and thus, the model estimates of focus growth inhibition by these
small-molecule inhibitors are influenced to some extent by
inhi-bition of cell proliferation (
Table 2
).
[image:7.585.40.546.69.338.2]FIG 5Observed and predicted focus size distributions under different treatment conditions. HCV cell-to-cell spread assays were performed in the presence of neutralizing anti-E2 plus antibodies (anti-CLDN1, anti-NPC1L1, anti-TfR1, and anti-CD81) or small-molecule inhibitors (ezetimibe [EZE] and ferristatin) against specific HCV entry factors. The birth (red) and boundary (blue) models were used to analyze the data. (A) Data and model predictions of foci in control cultures treated with anti-E2 plus IgG. (B) Data and model predictions of focus sizes in cultures treated with antibodies or small-molecule inhibitors blocking specific HCV entry factors. (C) Both the birth and boundary models indicate the same hierarchy in the estimated focus growth reduction when the different HCV entry factors are blocked. Circles and bars indicate the estimated effectiveness of blocking specific host factors (ε) and the 95% confidence interval, respectively (seeTable 3).
TABLE 3Effect of blocking host factors on HCV focus expansiona
Factor
Birth model Boundary model
ε(%) LL AIC ε(%) LL AIC
CLDN1 83.6 (77.3, 87.6) ⫺119.2 240.3 93.3 (89.9, 95.8) ⫺117.7 237.4 NPC1L1 71.5 (64.2, 77.4) ⫺96.7 195.5 86.6 (81.8, 91.1) ⫺94.5 191.1 TfR1 66.7 (61.7, 69.7) ⫺188.4 378.9 79.5 (76.0, 81.9) ⫺178.2 358.5 CD81 60.6 (55.3, 64.4) ⫺176.7 355.5 72.9 (67.4, 76.8) ⫺169.3 340.7 EZE 80.7 (77.0, 82.8) ⫺271.3 339.6 89.8 (87.7, 92.1) ⫺256.2 329.3 Ferristatin 60.6 (56.2, 64.1) ⫺168.8 544.6 73.0 (69.2, 76.6) ⫺163.6 514.3
aThe estimated effectiveness (ε) of host antibodies and small inhibitors in blocking focus expansion using the birth and boundary models is shown. Triplicates of each treatment
were combined in the fitting procedure. Numbers in parentheses are the 10% and 90% percentiles over 200 bootstrap replicates of the data. LL and AIC parameters are as described inTable 1. Analysis of one representative experiment of 3 is shown.
on November 7, 2019 by guest
http://jvi.asm.org/
[image:7.585.40.549.605.697.2]Modeling predicts that the growth of larger foci is best
ex-plained by the birth model, while the dynamics of smaller foci
could be better described by the boundary model.
We observed
that some HCV foci appeared to grow in a more irregular (i.e.,
noncircular) pattern (
Fig. 6
). In these cases, the boundary model,
which assumes a circular focus shape, would underestimate the
number of infected cells that contribute to focus growth. In
order to better define the differences in how these two models
explain the observed focus size distributions, we performed a
detailed comparison of the birth and the boundary models
using the current 72-h assay data. Initial analysis suggested that
the birth model provides a better fit to data when larger focus
sizes are observed (e.g., for anti-E2-alone treatment, AIC
birth⫽
348.9 and AIC
boundary⫽
369.7 [
Table 1
]), while the boundary
model performs better for scenarios with smaller average focus
sizes. We tested this observation by fitting the data to a model
with a growth rate defined by
k⫽
k
␣
, where the exponent 0
ⱕ
␣
ⱕ
1 defines the dependence of
on focus size. For
␣ ⫽
1, the
model would be equivalent to the birth model, while for
␣ ⫽
0.5, the relationship is equivalent to the one assumed by the
boundary model. Fitting such a model to the observed data and
estimating
and
␣
, we estimated
␣ ⫽
1 for anti-E2 alone and
anti-E2
⫹
IgG with a confidence interval of 0.92 to 1.0 based on
10% and 90% percentiles over 200 bootstrap replicates of the
data. With CLDN1 and NPC1L1 inhibitors, which led to
small-est focus sizes, we small-estimated
␣ ⬇
0.5 for CLDN1 (
␣ ⫽
0.43) and
NPC1L1 (
␣ ⫽
0.45), but with large confidence intervals
rang-ing from 0.0 to 1.0. These results corroborate our initial
obser-vations, i.e., that scenarios leading to larger focus sizes during
the 72-h experiment are best explained by a birth model, while
the dynamics of smaller focus sizes seems to be better described
by the boundary model.
DISCUSSION
Understanding the mechanisms and dynamics by which viruses
spread within a host has important implications for pathogenesis,
viral escape, and the design of potent antiviral therapies (
6
,
12
,
15
,
53
). Hence, in this study, we analyzed data from
in vitro
HCV
cell-to-cell spread assays using simple stochastic models
describ-ing focus expansion as a means to understand and quantify the
dynamics of HCV cell-to-cell spread and the degree to which
spread is reduced when individual HCV entry factors are blocked.
Specifically, we tested three different mathematical models and
found that focus expansion in the presence of neutralizing anti-E2
is best explained by models based on size-dependent growth rates
(
Fig. 3
). Cell-free infection should lead to focus growth rates that
are independent of focus size. Because the Poisson model, which
assumes size-independent focus growth rates, does not explain the
observed focus size distribution, our analysis supports the
empir-ical determination that 10
g/ml of AR3A anti-E2 is effective at
blocking cell-free HCV infection and thus confirms that the focus
expansion observed in our assay is due to cell-to-cell spread of
HCV and/or proliferation of infected cells.
Since our data indicate that cell proliferation in anti-E2 treated
cultures can increase cell numbers 5.3-fold
⫾
0.7-fold (
Table 2
),
pro-liferation of infected cells can in theory account for foci up to size
k
⫽
4 to 6. However, most foci formed under anti-E2 treatment alone are
larger than
k
⫽
4, suggesting that cell-to-cell transmission is the main
mechanism of the focus expansion observed under these assay
con-ditions. The birth and the boundary models tested represent two
ex-tremes of size-dependent focus growth, with the birth model
assum-ing that every cell in a focus contributes to expansion while the
boundary model only allows cells at the edge of a focus to contribute.
Despite this difference, both models fit the current data reasonably
well. This might be because most cells in the small foci formed during
the short (72-h) experiment are in contact with uninfected cells for
the majority of the assay period.
Interestingly, the boundary model provided a better fit to
ex-perimental data where there were smaller average focus sizes,
while scenarios with the growth of larger foci were better described
by the birth model. Two possible explanations for this observation
can be suggested. (i) The boundary model assumes compact focus
growth, with the surface of a focus of size
k
approximated by a
circle. Because some HCV foci appear to grow in a more irregular
(i.e., noncircular) pattern (
Fig. 6
), this might underestimate the
number of cells that contribute to focus expansion. While this
would not affect the analysis of relatively small foci (e.g.,
k
⬍
4
cells), where all cells are by default adjacent to uninfected cells, as
observed for CLDN1 and NPC1L1, it might play a role as foci
FIG 6Irregular shape of HCV foci. HCV cell-to-cell spread assays were performed in the present of neutralizing anti-E2. At 72 h postinoculation, cells were fixed and stained for E2 (red). Photographs were taken at a magnification of⫻20 using a Nikon TE2000U microscope. Representative noncircular images are shown.
on November 7, 2019 by guest
http://jvi.asm.org/
[image:8.585.45.544.66.241.2]become larger. (ii) Although most of the cell proliferation
de-tected likely occurred early in the assay before cells became
in-creasingly compressed, the relative contribution of cell
prolifera-tion on focus expansion might increase proporprolifera-tionally to focus
size, which would more easily violate the assumption that foci
expand only by cell-to-cell transmission along the boundaries of a
focus. Additionally, our data indicate that cell proliferation is
sig-nificantly larger in untreated cultures (
Table 1
), suggesting that
cell proliferation may perhaps have played a more significant role
on the larger foci formed in these untreated cultures. Further
ex-perimental and modeling efforts are needed to estimate the effect
of cell-to-cell spread in conjunction with cell proliferation, not
only accounting for focus size but also controlling for observed
focus shapes (
Fig. 6
) and possibly decreased proliferation rates of
infected cells (
54
).
The actual influence of cell proliferation on the observed focus
sizes is difficult to quantify in these assays. For cultures cotreated
with anti-E2 plus antibodies against NPC1L1 or CLDN1, we
ob-served average focus sizes of only 1 or 2 infected cells. In addition,
we found that incubation with any nonhuman antibody reduced
cell proliferation slightly, such that only a roughly 2-fold increase
in cell numbers occurred during the 72 h experiment (
Table 2
).
This seems to indicate that inhibition of CLDN1 or NPC1L1
blocks the majority of cell-to-cell spread, with the observed focus
sizes being solely due to proliferation of infected cells. Performing
the same HCV cell-to-cell spread assays in a nongrowing Huh7
cell culture model (
40
,
55
,
56
) could be useful to eliminate the
influence of cell proliferation on focus size.
One factor not considered in our analysis is the possibility that
two or more individual foci may merge at some point during the
experiment, which might happen if closely situated foci grow large
enough, as previously analyzed (
32
). However, because the
aver-age numbers of foci per well are comparable between the different
conditions tested (anti-E2 and IgG,
⬃
36 foci per well; all other
scenarios,
⬃
38 foci per well; Wilcoxon test,
P
⫽
0.5), we can
assume that this did not affect our comparisons of the efficacies of
different antibody treatments on cell-to-cell spread. For longer
experiments monitoring more extensive focus expansion, even
less virus per square millimeter of cell monolayer could be
inocu-lated to allow more room for individual foci to grow. Additionally,
live cell imaging and/or counting the number of foci at subsequent
time points over the course of the experiment would help to
de-termine if merging of individual foci occurs (e.g., focus number
would decrease over time).
Despite the difficulties and limitations of mathematical models
in capturing the dynamics of individual focus growth, estimates of
focus growth rates obtained by the birth and the boundary models
describing size-dependent focus growth represent the potential
upper and lower limits of the actual growth rates, respectively.
Importantly, when various inhibitors targeting different host cell
factors are assessed, both the birth and the boundary models
in-dicate the same hierarchy of cell-to-cell inhibition, with blocking
of CLDN1 reducing focus expansion the most, followed by
NPC1L1, TfR1, and finally CD81 (
Fig. 5C
). As foci up to a size of
k
⫽
2 cells could be solely due to cell proliferation (
Table 2
),
antibodies against CLDN1 and NPC1L1 may in fact block all
cell-to-cell transmission of infection, given the observed focus sizes in
these scenarios. Blocking TfR1 either with an antibody or a
small-molecule inhibitor does not exhibit as great a reduction of focus
expansion, consistent with TfR1 being less essential for cell-to-cell
transmission of HCV. Likewise, our anti-CD81 data suggest that
CD81 is not absolutely required for HCV cell-to-cell spread;
how-ever, further analysis with additional antibodies or other types of
CD81-targeted inhibitors is needed to resolve the ongoing debate
(
6
,
13
,
14
,
16
) regarding the involvement of CD81 in HCV
cell-to-cell transmission.
In summary, in the current study we developed stochastic
models to explain the dynamics of HCV spread in an
in vitro
focus
expansion assay and to quantify the effect that blocking specific
host factors has on cell-to-cell spread. This mathematical
ap-proach confirms that our anti-E2 treatment blocks cell-free
infec-tion and indicates a hierarchy of effectiveness of the tested entry
factor-targeted inhibitors in slowing focus expansion/cell-to-cell
viral spread. This type of approach could be used to quantify
in
vitro
cell-to-cell transmission of other viruses and to determine
the effectiveness of antivirals on blocking viral cell-to-cell spread.
APPENDIX
Detailed derivation and calculation of the state probabilities for the boundary model.Here, we prove the state probability of observing a focus of sizekat timetfor the boundary model as defined in equation 7. For simplicity, we assume that the first cell of the focus was infected at time
t0⫽0. Given1⫽ , the probability of observing a focus of sizek⫽1 at
timet,p1(t), is given by
p1(t)⫽e⫺t (A1)
As given in equation 7, the general probability of observing a focus of sizekat timet,pk(t),kⱖ2, is then defined by
pk(t)⫽
兺
j⫽1 kak,je⫺兹jtforkⱖ2 (A2)
To prove equation A2, we can use the following relationship between
pk(t) andpk⫹1(t). To observe a focus of sizek⫹1 at timet, the focus needs to have expanded to a sizekby times⬍t, one additional cell must become infected at timeswith ratek, and there must be no further expansion of the focus until timet. Thus, the probability of observing a focus of sizek⫹
1 at timet,pk⫹1(t), is defined by
pk⫹1(t)⫽
兰
0 tpk(s)kek⫹1(t⫺s)ds (A3) The proof that equation A2 holds true for allkⱕ⌵follows by induc-tion. With equation A3 and equation A1, it is easy to show that equation A2 holds fork⫽2. Fork⫹1, we then obtain
pk⫹1(t)⫽
兰
0 tpk(s)
兹
ke⫺兹k⫹1(t⫺s)ds⫽
兹
ke⫺兹
k⫹1t兺
j⫽1 k(⫺1)k⫺1
兿
i⫽1,i⫽jk
冉
兹
i兹
j⫺兹
i冊
冑
j k兰
0t
e⫺共兹j⫺兹k⫹1兲sds
⫽e⫺兹k⫹1t
兺
j⫽1 k(⫺1)k
兿
i⫽1,i⫽jk
冉
兹
i兹
j⫺兹
i冊
兹
j兹
j⫺兹
k关
e⫺共兹j⫺兹k⫹1兲t⫺1
兴
⫽
兺
j⫽1 k
(⫺1)k
冑
j k⫹1i⫽兿
1,i⫽jk⫹1
冉
兹
i兹
j⫺兹
i冊
e ⫺兹jt⫺
兺
j⫽1 k
(⫺1)k
冑
j k⫹1 i⫽兿
1,i⫽jk⫹1
冉
兹
i兹
j⫺兹
i冊
e ⫺兹k⫹1t⫽
兺
j⫽1 k⫹1
ak,je⫺兹jt
on November 7, 2019 by guest
http://jvi.asm.org/
Thereby, the last equation follows, as
兺
j⫽1 k(⫺1)k
冑
j k⫹1i⫽兿
1,i⫽jk⫹1
冉
兹
i兹
j⫺兹
i冊
⫽ (⫺1)k⫹1兿
i⫽1 k
冉
兹
i兹
k⫹1⫺兹
i冊
⫽ ak⫹1,k⫹1With this, equation 7 has been shown.
ACKNOWLEDGMENTS
We thank Gitanjali Subramanya and Beverly Chrabot for excellent tech-nical support.
F.G. was supported by the Center for Modeling and Simulation in the Biosciences (BIOMS). Portions of this work were performed under the auspices of the U.S. Department of Energy under contract DE-AC52-06NA25396 and supported by NIH grant R01-AI07881.
REFERENCES
1.Sattentau Q.2008. Avoiding the void: cell-to-cell spread of human viruses. Nat Rev Microbiol6:815– 826.http://dx.doi.org/10.1038/nrmicro1972. 2.Mothes W, Sherer NM, Jin J, Zhong P.2010. Virus cell-to-cell
trans-mission. J Virol84:8360 – 8368.http://dx.doi.org/10.1128/JVI.00443-10. 3.Sigal A, Kim JT, Balazs AB, Dekel E, Mayo A, Milo R, Baltimore D.2011.
Cell-to-cell spread of HIV permits ongoing replication despite antiretroviral therapy. Nature477:95–98.http://dx.doi.org/10.1038/nature10347. 4.Brimacombe CL, Grove J, Meredith LW, Hu K, Syder AJ, Flores MV,
Timpe JM, Krieger SE, Baumert TF, Tellinghuisen TL, Wong-Staal F, Balfe P, McKeating JA.2011. Neutralizing antibody-resistant hepatitis C virus cell-to-cell transmission. J Virol85:596 – 605.http://dx.doi.org/10 .1128/JVI.01592-10.
5.Abela IA, Berlinger L, Schanz M, Reynell L, Gunthard HF, Rusert P, Trkola A.2012. Cell-cell transmission enables HIV-1 to evade inhibition by potent CD4bs directed antibodies. PLoS Pathog8:e1002634.http://dx .doi.org/10.1371/journal.ppat.1002634.
6.Barretto N, Sainz B, Jr, Hussain S, Uprichard SL.2014. Determining the involvement and therapeutic implications of host cellular factors in hep-atitis C virus cell-to-cell spread. J Virol88:5050 –5061.http://dx.doi.org /10.1128/JVI.03241-13.
7.Chen P, Hubner W, Spinelli MA, Chen BK.2007. Predominant mode of human immunodeficiency virus transfer between T cells is mediated by sustained Env-dependent neutralization-resistant virological synapses. J Virol81:12582–12595.http://dx.doi.org/10.1128/JVI.00381-07. 8.Martin N, Welsch S, Jolly C, Briggs JA, Vaux D, Sattentau QJ.2010.
Virological synapse-mediated spread of human immunodeficiency virus type 1 between T cells is sensitive to entry inhibition. J Virol84:3516 – 3527.http://dx.doi.org/10.1128/JVI.02651-09.
9.Sato H, Orenstein J, Dimitrov D, Martin M.1992. Cell-to-cell spread of HIV-1 occurs within minutes and may not involve the participation of virusparticles.Virology186:712–724.http://dx.doi.org/10.1016/0042-6822 (92)90038-Q.
10. Sourisseau M, Sol-Foulon N, Porrot F, Blanchet F, Schwartz O.2007. Inefficient human immunodeficiency virus replication in mobile lympho-cytes. J Virol81:1000 –1012.http://dx.doi.org/10.1128/JVI.01629-06. 11. Kolodkin-Gal D, Hulot SL, Korioth-Schmitz B, Gombos RB, Zheng Y,
Owuor J, Lifton MA, Ayeni C, Najarian RM, Yeh WW, Asmal M, Zamir G, Letvin NL.2013. Efficiency of cell-free and cell-associated virus in mucosal transmission of human immunodeficiency virus type 1 and sim-ian immunodeficiency virus. J Virol87:13589 –13597.http://dx.doi.org /10.1128/JVI.03108-12.
12. Zeisel MB, Lupberger J, Fofana I, Baumert TF.2013. Host-targeting agents for prevention and treatment of chronic hepatitis C—perspectives and chal-lenges. J Hepatol58:375–384.http://dx.doi.org/10.1016/j.jhep.2012.09.022. 13. Timpe JM, Stamataki Z, Jennings A, Hu K, Farquhar MJ, Harris HJ,
Schwarz A, Desombere I, Roels GL, Balfe P, McKeating JA. 2008. Hepatitis C virus cell-cell transmission in hepatoma cells in the presence of neutralizing antibodies. Hepatology47:17–24.http://dx.doi.org/10.1002 /hep.21959.
14. Witteveldt J, Evans MJ, Bitzegeio J, Koutsoudakis G, Owsianka AM, Angus AG, Keck ZY, Foung SK, Pietschmann T, Rice CM, Patel AH.2009. CD81 is dispensable for hepatitis C virus cell-to-cell transmission in hepatoma cells. J Gen Virol90:48 –58.http://dx.doi.org/10.1099/vir.0.006700-0.
15. Xiao F, Fofana I, Heydmann L, Barth H, Soulier E, Habersetzer F, Doffoel M, Bukh J, Patel AH, Zeisel MB, Baumert TF.2014. Hepatitis C virus cell-cell transmission and resistance to direct-acting antiviral agents. PLoS Pathog10:e1004128.http://dx.doi.org/10.1371/journal.ppat .1004128.
16. Martin DN, Uprichard SL.2013. Identification of transferrin receptor 1 as a hepatitis C virus entry factor. Proc Natl Acad Sci U S A110:10777– 10782.http://dx.doi.org/10.1073/pnas.1301764110.
17. Barretto N, Uprichard SL.2015. Hepatitis C virus cell-to-cell spread assays. Bio Protoc4:e1365.
18. Perelson AS.2002. Modelling viral and immune system dynamics. Nat Rev Immunol2:28 –36.http://dx.doi.org/10.1038/nri700.
19. Canini L, Perelson AS.2014. Viral kinetic modeling: state of the art. J Phar-macokinet Pharmacodyn41:431– 443.http://dx.doi.org/10.1007/s10928-014 -9363-3.
20. Guedj J, Dahari H, Rong L, Sansone ND, Nettles RE, Cotler SJ, Layden TJ, Uprichard SL, Perelson AS.2013. Modeling shows that the NS5A inhibitor daclatasvir has two modes of action and yields a shorter estimate of the hepatitis C virus half-life. Proc Natl Acad Sci U S A110:3991–3996. http://dx.doi.org/10.1073/pnas.1203110110.
21. Nowak MA, May RM.2000. Virus dynamics: mathematical principles of immunology and virology. Oxford University Press, Oxford, United King-dom.
22. Dahari H, Shteingart S, Gafanovich I, Cotler SJ, D’Amato M, Pohl RT, Weiss G, Ashkenazi YJ, Tichler T, Goldin E, Lurie Y.2015. Sustained virological response with intravenous silibinin: individualized IFN-free therapy via real-time modelling of HCV kinetics. Liver Int35:289 –294. http://dx.doi.org/10.1111/liv.12692.
23. Neumann AU, Lam NP, Dahari H, Gretch DR, Wiley TE, Layden TJ, Perelson AS.1998. Hepatitis C viral dynamics in vivo and the antiviral efficacy of interferon-alpha therapy. Science282:103–107.http://dx.doi .org/10.1126/science.282.5386.103.
24. Dahari H, Ribeiro RM, Rice CM, Perelson AS. 2007. Mathematical modeling of subgenomic hepatitis C virus replication in Huh-7 cells. J Virol81:750 –760.http://dx.doi.org/10.1128/JVI.01304-06.
25. Dahari H, Sainz B, Jr, Perelson AS, Uprichard SL.2009. Modeling sub-genomic hepatitis C virus RNA kinetics during treatment with alpha inter-feron. J Virol83:6383– 6390.http://dx.doi.org/10.1128/JVI.02612-08. 26. Binder M, Sulaimanov N, Clausznitzer D, Schulze M, Huber CM, Lenz
SM, Schloder JP, Trippler M, Bartenschlager R, Lohmann V, Kaderali L.
2013. Replication vesicles are load- and choke-points in the hepatitis C virus lifecycle. PLoS Pathog 9:e1003561. http://dx.doi.org/10.1371/journal.ppat .1003561.
27. Padmanabhan P, Dixit NM.2012. Viral kinetics suggests a reconciliation of the disparate observations of the modulation of claudin-1 expression on cells exposed to hepatitis C virus. PLoS One7:e36107.http://dx.doi.org/10 .1371/journal.pone.0036107.
28. Culshaw RV, Ruan S, Webb G.2003. A mathematical model of cell-to-cell spread of HIV-1 that includes a time delay. J Math Biol46:425– 444. http://dx.doi.org/10.1007/s00285-002-0191-5.
29. Komarova NL, Levy DN, Wodarz D.2013. Synaptic transmission and the susceptibility of HIV infection to anti-viral drugs. Sci Rep3:2103.http: //dx.doi.org/10.1038/srep02103.
30. Dixit NM, Perelson AS.2004. Multiplicity of human immunodeficiency virus infections in lymphoid tissue. J Virol78:8942– 8945.http://dx.doi .org/10.1128/JVI.78.16.8942-8945.2004.
31. Wodarz D, Levy DN.2011. Effect of different modes of viral spread on the dynamics of multiply infected cells in human immunodeficiency virus infection. J R Soc Interface8:289 –300.http://dx.doi.org/10.1098/rsif.2010 .0266.
32. Bailey K, Kirk A, Naik S, Nace R, Steele MB, Suksanpaisan L, Li X, Federspiel MJ, Peng KW, Kirk D, Russell SJ.2013. Mathematical model for radial expansion and conflation of intratumoral infectious centers pre-dicts curative oncolytic virotherapy parameters. PLoS One8:e73759.http: //dx.doi.org/10.1371/journal.pone.0073759.
33. Zhong J, Gastaminza P, Cheng G, Kapadia S, Kato T, Burton DR, Wieland SF, Uprichard SL, Wakita T, Chisari FV.2005. Robust hepatitis C virus infection in vitro. Proc Natl Acad Sci U S A102:9294 –9299.http: //dx.doi.org/10.1073/pnas.0503596102.
34. Zhong J, Gastaminza P, Chung J, Stamataki Z, Isogawa M, Cheng G, McKeating JA, Chisari FV.2006. Persistent hepatitis C virus infection in vitro: coevolution of virus and host. J Virol80:11082–11093.http://dx.doi .org/10.1128/JVI.01307-06.
on November 7, 2019 by guest
http://jvi.asm.org/
35. Gastaminza P, Kapadia SB, Chisari FV.2006. Differential biophysical properties of infectious intracellular and secreted hepatitis C virus parti-cles. J Virol80:11074 –11081.http://dx.doi.org/10.1128/JVI.01150-06. 36. Sainz B, Jr, Barretto N, Uprichard SL.2009. Hepatitis C virus infection
in phenotypically distinct Huh7 cell lines. PLoS One4:e6561.http://dx.doi .org/10.1371/journal.pone.0006561.
37. Kato T, Date T, Miyamoto M, Furusaka A, Tokushige K, Mizokami M, Wakita T.2003. Efficient replication of the genotype 2a hepatitis C virus subgenomic replicon. Gastroenterology125:1808 –1817.http://dx.doi.org /10.1053/j.gastro.2003.09.023.
38. Kato T, Furusaka A, Miyamoto M, Date T, Yasui K, Hiramoto J, Nagayama K, Tanaka T, Wakita T.2001. Sequence analysis of hepa-titis C virus isolated from a fulminant hepahepa-titis patient. J Med Virol
64:334 –339.http://dx.doi.org/10.1002/jmv.1055.
39. Wakita T, Pietschmann T, Kato T, Date T, Miyamoto M, Zhao Z, Murthy K, Habermann A, Krausslich HG, Mizokami M, Bartenschlager R, Liang TJ.2005. Production of infectious hepatitis C virus in tissue culture from a cloned viral genome. Nat Med11:791–796.http://dx.doi .org/10.1038/nm1268.
40. Yu X, Uprichard SL.2010. Cell-based hepatitis C virus infection fluores-cence resonance energy transfer (FRET) assay for antiviral compound screening.⬎Curr Protoc Microbiol Chapter 17:Unit 17.15.http://dx.doi .org/10.1002/9780471729259.mc1705s18.
41. Si Y, Liu S, Liu X, Jacobs JL, Cheng M, Niu Y, Jin Q, Wang T, Yang W.
2012. A human claudin-1-derived peptide inhibits hepatitis C virus entry. Hepatology56:507–515.http://dx.doi.org/10.1002/hep.25685.
42. Sainz B, Jr, Barretto N, Martin DN, Hiraga N, Imamura M, Hussain S, Marsh KA, Yu X, Chayama K, Alrefai WA, Uprichard SL.2012. Iden-tification of the Niemann-Pick C1-like 1 cholesterol absorption receptor as a new hepatitis C virus entry factor. Nat Med18:281–285.http://dx.doi .org/10.1038/nm.2581.
43. Lindenbach BD, Evans MJ, Syder AJ, Wolk B, Tellinghuisen TL, Liu CC, Maruyama T, Hynes RO, Burton DR, McKeating JA, Rice CM.
2005. Complete replication of hepatitis C virus in cell culture. Science
309:623– 626.http://dx.doi.org/10.1126/science.1114016.
44. Law M, Maruyama T, Lewis J, Giang E, Tarr AW, Stamataki Z, Gasta-minza P, Chisari FV, Jones IM, Fox RI, Ball JK, McKeating JA, Knete-man NM, Burton DR. 2008. Broadly neutralizing antibodies protect against hepatitis C virus quasispecies challenge. Nat Med14:25–27.http: //dx.doi.org/10.1038/nm1698.
45. Sabahi A, Marsh KA, Dahari H, Corcoran P, Lamora JM, Yu X, Garry RF, Uprichard SL.2010. The rate of hepatitis C virus infection initiation
in vitro is directly related to particle density. Virology407:110 –119.http: //dx.doi.org/10.1016/j.virol.2010.07.026.
46. Karlin S, Taylor HM.1975. A first course in stochastic processes, 2nd ed. Academic Press, New York, NY.
47. Team RDC.2006. R: a language and environment for statistical comput-ing. R Foundation for Statistical Computing, Vienna, Austria.
48. Munakata T, Nakamura M, Liang Y, Li K, Lemon SM.2005. Down-regulation of the retinoblastoma tumor suppressor by the hepatitis C virus NS5B RNA-dependent RNA polymerase. Proc Natl Acad Sci U S A102:
18159 –18164.http://dx.doi.org/10.1073/pnas.0505605102.
49. Akaike H.1974. A new look at the statistical model identification. IEEE Trans Automat Contr19:716 –723.http://dx.doi.org/10.1109/TAC.1974 .1100705.
50. Jones CT, Catanese MT, Law LM, Khetani SR, Syder AJ, Ploss A, Oh TS, Schoggins JW, MacDonald MR, Bhatia SN, Rice CM.2010. Real-time imaging of hepatitis C virus infection using a fluorescent cell-based reporter system. Nat Biotechnol28:167–171.http://dx.doi.org/10.1038 /nbt.1604.
51. Fofana I, Xiao F, Thumann C, Turek M, Zona L, Tawar RG, Grunert F, Thompson J, Zeisel MB, Baumert TF.2013. A novel monoclonal anti-CD81 antibody produced by genetic immunization efficiently inhibits hepatitis C virus cell-cell transmission. PLoS One8:e64221.http://dx.doi .org/10.1371/journal.pone.0064221.
52. Catanese MT, Loureiro J, Jones CT, Dorner M, von Hahn T, Rice CM.
2013. Different requirements for scavenger receptor class B type I in hep-atitis C virus cell-free versus cell-to-cell transmission. J Virol87:8282– 8293.http://dx.doi.org/10.1128/JVI.01102-13.
53. Zhong P, Agosto LM, Ilinskaya A, Dorjbal B, Truong R, Derse D, Uchil PD, Heidecker G, Mothes W.2013. Cell-to-cell transmission can over-come multiple donor and target cell barriers imposed on cell-free HIV. PLoS One8:e53138.http://dx.doi.org/10.1371/journal.pone.0053138. 54. Kannan RP, Hensley LL, Evers LE, Lemon SM, McGivern DR. 2011.
Hepatitis C virus infection causes cell cycle arrest at the level of initiation of mitosis. J Virol85:7989 – 8001.http://dx.doi.org/10.1128/JVI.00280-11. 55. Yu X, Sainz B, Jr, Uprichard SL.2009. Development of a cell-based
hepatitis C virus infection fluorescent resonance energy transfer assay for high-throughput antiviral compound screening. Antimicrob Agents Che-mother53:4311– 4319.http://dx.doi.org/10.1128/AAC.00495-09. 56. Sainz B, Jr, Chisari FV.2006. Production of infectious hepatitis C virus
by well-differentiated, growth-arrested human hepatoma-derived cells. J Virol80:10253–10257.http://dx.doi.org/10.1128/JVI.01059-06.
on November 7, 2019 by guest
http://jvi.asm.org/