This is the
Accepted Version
of a paper published in the
journal Global Ecology and Biogeography:
Siqueira, Alexandre C., Oliveira-Santos, Luiz Gustavo R., Cowman,
Peter F., and Floeter, Sergio (2016)
Evolutionary processes
underlying latitudinal differences in reef fish biodiversity.
Global
Ecology and Biogeography, 25 (12). pp. 1466-1476.
http://dx.doi.org/10.1111/geb.12506
1
Evolutionary processes underlying reef fish latitudinal differences in biodiversity
1
2
Alexandre C. Siqueiraa*; Luiz Gustavo R. Oliveira-Santosb; Peter F. Cowmanc,d; Sergio R.
3
Floetere
4
5
a Departamento de Ecologia e Zoologia, Universidade Federal de Santa Catarina, Florianópolis, SC, 88040-970, 6
Brazil. Email: [email protected] 7
b Departamento de Ecologia, Universidade Federal do Mato Grosso do Sul, Campo Grande, MS, 79070-900, 8
Brazil. Email: [email protected] 9
c Department of Ecology and Evolutionary Biology, Yale University, New Haven, CT, 06511, USA. 10
d Centre of Excellence for Coral Reef Studies, James Cook University, Townsville, QLD, 4810, Australia. Email: 11
peter.cowman@ jcu.edu.au 12
e Departamento de Ecologia e Zoologia, Universidade Federal de Santa Catarina, Florianópolis, SC, 88040-970, 13
Brazil. Email: [email protected] 14
15
*Corresponding author:
16
Alexandre C. Siqueira
17
Marine Macroecology and Biogeography Lab, Departamento de Ecologia e Zoologia, Universidade
18
Federal de Santa Catarina, Florianópolis, SC, 88040-970, Brazil. Email: [email protected]
19
Phone: +55 48 3721-5521 / Fax: +55 48 3721-5156
20
Running-title: Evolution and reef fish latitudinal biodiversity
21
Keywords: diversification, speciation, extinction, dispersal, species richness, models of
22
evolution
23
Number of words in the Abstract: 245
24
Number of words in main body: 4931
25
Number of references: 48
26
2
ABSTRACT
28 29
Aim: To examine the dynamics among processes of speciation, extinction and dispersal in
30
marine environments using phylogenies to reveal the evolutionary mechanisms that promote
31
latitudinal differences in biodiversity. Using phylogenetic comparative methods we assess
32
whether tropical reef fish lineages show higher diversification rates and whether the majority
33
of extratropical reef fish lineages have originated from tropical areas.
34
Location: Shallow water tropical and extratropical reefs globally.
35
Methods: Using fossil calibrated phylogenies for four reef associated fish families
36
(Chaetodontidae, Labridae, Pomacentridae and Sparidae) we apply evolutionary models
37
(GeoSSE and HiSSE) that allow the estimation of speciation, extinction and dispersal rates
38
associated with geographic ranges and exploring potential biases from unsampled characters.
39
Results: We found that tropical lineages show higher rates of speciation and tended to have
40
lower extinction rates. Overall, we identify higher net diversification rates for tropical lineages
41
when compared to those in extratropical regions in all four families. Rates of dispersal tended
42
to be higher for lineages with tropical origins expanding into extratropical regions. Within the
43
family Labridae, two tropical lineages were found to exhibit higher net diversification rates,
44
above that expected by latitudinal differences.
45
Main conclusions: Our results offer support for the predictions of the ‘out of the tropics’ and
46
‘evolutionary speed’ models of evolution, both of which highlight the marine tropics as an
47
important evolutionary engine promoting latitudinal differences in reef fish biodiversity.
48
Moreover, we find that two tropical labrid lineages are undergoing exceptional diversification
49
associated with additional traits, possibly linked with extreme sexual dichromatism observed
50
in both clades.
51
3
INTRODUCTION
53
Although being the most widespread macroecological pattern in the world, the latitudinal
54
diversity gradient (LDG) remains poorly understood with respect to its generating processes
55
(Hillebrand, 2004). This limited understanding stems from a lack of focus on the historical and
56
evolutionary factors driving this pervasive biodiversity pattern. The uneven distribution of
57
tropical and extratropical lineages in phylogenetic trees is an evolutionary property that arises
58
from the LDG depending on the dynamics between speciation and extinction (Mittelbach et al.,
59
2007). Besides this, the phylogenetic component of the LDG depends on the process of lineage
60
dispersal between different ecological zones (Ricklefs, 2006). Thus, every evolutionary
61
hypothesis concerning the LDG must take into account at least one of these three fundamental
62
processes that alter species richness: speciation, extinction and dispersal (Dowle et al., 2013).
63
Considering these processes, there are four main hypotheses to explain the phylogenetic
64
properties arising from the LDG. (1) The ‘evolutionary time’ hypothesis (Fischer, 1960),
65
considers that tropical lineages have had more time to diversify because tropical environments
66
remained more stable throughout geological time. According to this hypothesis, evolutionary
67
rates would be equal among geographic regions, however, tropical lineages would be older than
68
extratropical ones, leading to more extant species in the tropics. (2) The ‘tropical niche
69
conservatism’ hypothesis (Wiens & Donoghue, 2004), assumes that species that share common
70
ancestry tend to share niche affinities. It proposes that most lineages would have originated in
71
the tropics because tropical areas had greater geographical extent in recent geological past and
72
that the transition to extratropical zones would be rare. In terms of evolutionary rates, speciation
73
and extinction were supposed to be equal among geographic regions and dispersal would be
74
more frequent from extratropical zones to the tropics. (3) The ‘out of the tropics’ (Jablonski et
75
al., 2006) is an explicit hypothesis about differences in all evolutionary rates. It suggests that
4
lineage origination is higher in the tropics, extinction rates are higher or equal in extratropics
77
compared to the tropics, and that tropical lineages disperse to the extratropics more frequently
78
than the reverse. (4) Finally, the ‘evolutionary speed’ hypothesis (Rohde, 1992) proposes that
79
speciation rates would be higher in tropical environments, mainly due to increased rates of
80
molecular evolution in the tropics (reviewed in Dowle et al., 2013). Thus, this hypothesis
81
considers that extinction and dispersal rates would not vary among geographic regions.
82
Recent studies are helping to disentangle these evolutionary processes by using
time-83
calibrated phylogenies to make explicit tests of speciation, extinction and dispersal rates
84
between tropical and extratropical lineages (Pyron & Wiens, 2013; Pyron, 2014; Rolland et al.,
85
2014). Their main results suggest higher speciation rates for tropical lineages in amphibians
86
and mammals (Pyron & Wiens, 2013; Rolland et al., 2014), but not in squamate reptiles (Pyron,
87
2014), while higher extinction rates have been reported for extratropical lineages in all groups.
88
As for dispersal rates, these studies showed more lineage dispersal from the extratropics to the
89
tropics in amphibians and squamate reptiles, while mammals follow the opposite pattern. These
90
results reinforce the idiosyncratic nature of evolutionary processes among taxonomical groups,
91
yet they have focused on terrestrial organisms. It is still unclear which processes have been
92
important in marine systems for generating latitudinal patterns of biodiversity.
93
Although many marine groups exhibit a strong LDG (Hillebrand, 2004), there remains a
94
gap in our knowledge of the underlying phylogenetic component, especially in diverse systems
95
like coral reefs. These environments tend to occupy tropical latitudinal bands, but peripheral
96
extratropical conditions may also permit the establishment of complex, non-coral dominated
97
reef communities (Ebeling & Hixon, 1991; Fig. 1). It is the transition from tropical coral
98
dominated reef to extratropical rocky reef and kelp forest systems that forms the latitudinal
99
diversity gradient for reef-associated organisms. Coral reef environments are recognized as
5
important promoters of lineage diversification, in particular for associated fishes, where they
101
have acted as refugia for biodiversity in periods of elevated extinction (Cowman & Bellwood,
102
2011; Pellissier et al., 2014). Reef fishes not only exhibit a marked latitudinal gradient with
103
more species in the tropics but also a striking longitudinal gradient with species richness
104
peaking in the Indo-Australian Archipelago (Mora et al., 2003). Many efforts have been
105
devoted to understand the contemporary factors that influences these patterns (e.g. Bellwood et
106
al., 2005; Tittensor et al., 2010), with geometric (reef area and costal length) and biogeographic
107
variables identified as powerful predictors for reef fish species richness (Parravicini et al.,
108
2013). However, as yet, no study has attempted to quantify the roles played by processes of
109
speciation, extinction and dispersal in large-scale patterns of reef fish richness among tropical
110
and extratropical regions.
111
Here, we employed phylogenetic comparative methods to test predictions of the
112
evolutionary hypotheses concerning reef fish latitudinal differences in biodiversity. We used
113
time-calibrated phylogenies of four families that are known to have representatives in both
114
tropical and extratropical reefs to test for differences in speciation, extinction and dispersal rates
115
among lineages. Although these three processes have not been tested for reef fishes in the
116
context of the LDG, they are recognized as important drivers of contemporary species richness
117
patterns for this system (Mora et al., 2003). Specifically, we assessed which evolutionary
118
hypothesis (‘evolutionary time’, ‘tropical niche conservatism’, ‘out of the topics’ or
119
‘evolutionary speed’) drives the formation and maintenance of higher reef fish diversity in the
120
tropics.
121
122
METHODS
123
Reef fish evolutionary relationships
6
We examined four percomorph families with high phylogenetic resolution, known to be
125
associated with both tropical and extratropical reef environments (Bellwood & Wainwright,
126
2002): Chaetodontidae, Labridae, Pomacentridae and Sparidae. The Chaetodontidae, Labridae
127
and Pomacentridae are among the most species rich families in reef environments and have a
128
good phylogenetic resolution. However, they are predominantly associated with tropical coral
129
reefs. To capture a good representativeness both in terms of species richness and variation in
130
occupation of tropical vs. extratropical environments we also included the family Sparidae,
131
which is characteristic of extratropical reefs (Bellwood & Wainwright, 2002). For our
132
phylogenetic comparative methods, we used recent published chronograms for each family.
133
The Chaetodontidae phylogeny was reconstructed with Bayesian inferences using four
134
mitochondrial genes and four nuclear genes (see Cowman & Bellwood, 2011). It was calibrated
135
using fossil data and included 96 species from all nominal genera for the family.
136
The labrid phylogeny from Cowman & Bellwood (2011) was combined with the
137
parrotfish phylogeny of Choat et al. (2012). This was accomplished by grafting the parrotfish
138
clade into the labrid tree at the appropriate node using the ‘ape’ package (Paradis et al., 2004)
139
in R (R Core Team, 2014). This larger phylogeny included 303 species from 70 genera.
140
For the Pomacentridae we employed the chronogram of Frédérich et al. (2013). This
141
represents the most recent molecular and phylogenetic analysis of the family with Bayesian
142
inferences using three nuclear and four mitochondrial genes. This chronogram also used fossil
143
data and comprised 206 species from 28 of 29 recognized genera for the family.
144
For the Sparidae, we used the most well sampled phylogeny to date (Santini et al., 2014).
145
This fossil calibrated phylogeny was built with three mitochondrial and two nuclear genes, and
146
included 91 species with representatives from all recognized genera for the family (see Santini
147
et al., 2014).
7 149
Geographic data
150
We assessed the geographic ranges of all nominal species in each family through four
151
different sources: published data in books and papers (e.g. Allen, 1991; Randall, 2005; Kuiter,
152
2010); Catalog of Fishes (Eschmeyer, 2014); IUCN’s red list (IUCN, 2014); and FishBase
153
(Froese & Pauly, 2014). The range data for each species was cross-checked between these four
154
sources to avoid any probable large-scale geographic error. We then categorized each species
155
according to the presence or absence in tropical and extratropical regions, leading to three
156
discrete geographical states: tropical, extratropical and widespread. This categorization was
157
made considering the isocryme of 20ºC (Fig. 1) - mean sea surface temperature for the coldest
158
month - as a latitudinal distribution limit for tropical marine fauna (Briggs, 1974). We also
159
calculated the proportion of species in each of the three geographical states that were present in
160
each family’s phylogeny (Table 1).
161
162
Phylogenetic Comparative methods
163
To test for differences in speciation, extinction and dispersal rates between tropical and
164
extratropical regions, we used the model of “Geographic State Speciation and Extinction”
165
(GeoSSE; Goldberg et al., 2011), implemented in the R package ‘diversitree’ (FitzJohn, 2012).
166
This is a phylogenetic comparative method that uses a similar mathematical formulation as the
167
BiSSE (“Binary State Speciation and Extinction”) model, but enables tests of evolutionary rates
168
associated with geographical states rather than with discrete character states. Recent concerns
169
have been raised about the BiSSE and related methods (Rabosky & Goldberg, 2015), regarding
170
the possibility of phylogenetic pseudoreplication and high Type I error rates associated with
171
speciation estimates. To mitigate these potential biases we employed three approaches: (1) We
8
replicate the GeoSSE models across families of varying size and tip state ratio (Table 1). (2)
173
We built models using the “Hidden State Speciation and Extinction” (HiSSE) framework
174
(Beaulieu & O’Meara, 2016), a new approach which considers that unmeasured characters
175
(‘hidden traits’) related to the ones in the model might be influencing diversification estimates.
176
(3) We run simulation models to explicitly access the Type I error rates associated with GeoSSE
177
model in our data. By assessing models across multiple reef fish families we can identify robust
178
patterns, and with the implementation of HiSSE we can explore the potential effects of
179
unsampled character traits to deal with the problem of phylogenetic pseudoreplication.
180
Simulation tests help to assure that our results are not examples of mistaken inferences by the
181
models (Rabosky & Goldberg, 2015).
182
The GeoSSE model included three speciation parameters: sTrop and sEx representing the
183
divergence of an ‘endemic’ (restricted to a tropical or an extratropical range) ancestral species
184
producing two daughters in the same geographical state, or a widespread lineage giving rise to
185
tropical or extratropical endemic lineages; and sBtw representing the divergence of a widespread
186
lineage between regions producing two daughter lineages, one in each geographical state. The
187
parameters included in the model associated with extinction are: xTrop and xEx representing
188
global lineage extinction or range contraction of a widespread lineage. The model also includes
189
the dispersal parameter dTrop representing range expansion of tropical lineages and dEx
190
representing range expansion of extratropical lineages. During model construction, all these
191
parameters can be constrained or allowed to vary freely between regions.
192
We used the four chronograms to test several models that were built according to the
193
predictions of each evolutionary hypothesis proposed to explain the LDG. First, we built
194
unconstrained (full) models in which the seven parameters were allowed to vary freely,
195
representing the notation of the ‘out of the tropics’ model of evolution that predicts differences
9
in all rates. We also built models by constraining all rates to be equal among regions,
197
representing the ‘evolutionary time’ hypothesis that predicts no difference in evolutionary rates.
198
To represent the ‘evolutionary speed’ hypothesis, we built models in which only speciation
199
rates varied geographically, constraining extinction and dispersal rates to be equal among
200
regions. Finally, we constrained speciation and extinction to fit the ‘niche conservatism’, that
201
predicts higher dispersal rates from the extratropics to the tropical regions. As it is not possible
202
to constrain the direction of parameter values when fitting our models, consistency with an
203
evolutionary hypothesis depends on a superior fit and finding the correct parameter direction.
204
From the four evolutionary models, we built four other sub-models by constraining the sBtw
205
parameter to be equal to zero to assess the effect of between-region speciation mode in each
206
family. These combinations resulted in a set of eight models varying from the fully
207
unconstrained (‘out of the tropics’) model with seven parameters to the totally constrained
208
(‘evolutionary time’) model with only three parameters (Table S1 - Appendix S1 in Supporting
209
Information).
210
For the modeling process, we implemented a searching procedure throughout the
211
parameter space with 50 different combinations of initial parameters to assure we reached the
212
maximum likelihood (global optimum). After that, we used one of these convergent results as
213
starting values to run our models. We then compared our set of models using Akaike
214
Information Criterion (AIC), choosing the best-fit model by the lowest delta AIC score
215
(ΔAIC=0). To assess the power in model selection for our original data, we also used a Monte
216
Carlo approach described by Boettiger et al. (2012). We simulated 100 phylogenies with
217
parameters estimated under GeoSSE for each model (‘out of the tropics’, ‘evolutionary speed’,
218
‘evolutionary time’ and ‘niche conservatism’), which resulted in four sets of 100 simulated
219
phylogenies. Then, we assessed the distribution of likelihood ratio statistic (δ) values for each
10
set of simulated phylogenies by re-estimating and comparing model fit for the most complex
221
model (‘out of the tropics’) against each respective simpler models (‘evolutionary speed’,
222
‘evolutionary time’ and ‘niche conservatism’).
223
After model selection, we estimated the parameters for the best-fit model in each family
224
and sampled their posterior probability distributions using Markov chain Monte Carlo (MCMC)
225
to account for estimate uncertainty. The MCMC was run for 1000 generations using exponential
226
priors from the initial likelihood function. With the resulting samples from MCMC runs we
227
calculated the net diversification rates of each family by subtracting extinction rates from
228
speciation rates. Within the GeoSSE model it is possible to account for incomplete sampling
229
by including the percentage of species from each geographical state that are present in the trees.
230
We performed the modeling procedure as described above including the percentage of sampling
231
species for each family’s phylogeny (Table 1). For a better visualization of changes through
232
time in geographical states, we also performed a simple marginal ancestral state reconstruction
233
with GeoSSE’s initial likelihood function (Figs. S1-S4 - Appendix S2 in Supporting
234
Information).
235
We compared the regular time-constant GeoSSE model to a recently modified version of
236
this model that allows the incorporation of time dependency in evolutionary rates with a
237
function developed by Rolland et al. (2014). This function was created to avoid a potential bias
238
of time variance in the estimation of evolutionary rates. We implemented the time-variable
239
model as in Rolland et al. (2014) for our four trees by assuming speciation rates to vary linearly
240
as a function of time (s(t) = s0+rt), where s0 is the speciation rate at present, r is the component
241
associated with the variation in speciation rate through time and t is the interval of time from
242
the present to the past. As we were interested in the effect of time variation in speciation rates,
243
dispersal and extinction rates were considered constant in the time-variable model. The results
11
of the best-fit time-constant model were compared with the correspondent time-variable model
245
using AIC scores to investigate the robustness of the observed patterns.
246
As the HiSSE method only deals with binary character states, we reclassified the
247
widespread species as tropical or extratropical according to the predominant geographical range
248
for each species. Since our GeoSSE models showed a higher diversification rate for tropical
249
lineages (see results), we built, for each family, a character dependent model (BiSSE
250
equivalent), and a character independent model in which we associated a “hidden” character
251
state with the tropical state using the HiSSE notation. All models also included the percentage
252
of species from each measured character state that were present in the phylogenies to deal with
253
incomplete sampling. These models were compared using AIC scores to assess if the higher
254
tropical diversification rates were indeed associated with the geographical character or if it is
255
likely that other unmeasured character could account for the differences observed. We
256
implemented these analyses in the R package ‘hisse’ (Beaulieu & O’Meara, 2016).
257
We assessed the Type I error rates associated with the GeoSSE model for our four families
258
by building models with simulated neutral traits. By using the package ‘diversitree’, we
259
simulated 100 phylogenies with initial parameters estimated from our totally constrained model
260
(‘evolutionary time’) of the empirical GeoSSE model and with respective number of tips for
261
each family. For each of these neutral trees, we estimated parameters from an unconstrained
262
GeoSSE likelihood function and accessed the posterior distribution of estimated parameters
263
using MCMC for 1000 generations. These distributions of likelihood ratios for each parameter
264
were compared to check if there were differences among regions and the Type I error rates were
265
calculated based on the proportion of neutral trees in which the estimated parameters differed
266
among geographical regions. As suggested by Rabosky & Goldberg (2015), we employed the
267
results from the simulations to adjust the critical value of significance by dividing the threshold
12
of 0.05 by the growth rate of spurious results (Type I error rates/0.05) for each parameter in the
269
four families with the empirical dataset. For those parameters in which the Type I error rates
270
were below the threshold of 0.05, we kept this value as the critical significance level.
271
272
RESULTS
273
The families Chaetodontidae, Labridae and Pomacentridae contain predominantly
274
tropical species, while the Sparidae has more extratropical than tropical species (Table 1). The
275
set of best supported GeoSSE models showed that tropical lineages have higher speciation rates
276
in all families (Fig. 2; Table 2). However, the results for extinction and dispersal rates varied
277
among families.
278
For Chaetodontidae, the best supported model was the ‘out of the tropics’ model that
279
prohibits between-region speciation (Table 2). Within this model, extinction rate was higher for
280
extratropical lineages (Fig. 2A; Table 2). Dispersal rate was higher for tropical lineages
281
expanding ranges into extratropical regions rather than the reverse (Fig. 2A; Table 2).
282
Considering that speciation rate was higher in the tropics, we found that net diversification rate
283
was negative for extratropical lineages (-0.446 lineages Myr-1) and positive for tropical lineages
284
(0.132 lineages Myr-1; Fig. 2A).
285
The best-fit model for Labridae was also the ‘out of the tropics’ model prohibiting
286
between-region speciation (Table 2). The estimate for extinction rate in this model was higher
287
for extratropical lineages (Fig. 2B; Table 2), and the dispersal rate was found to be higher for
288
tropical lineages expanding ranges into the extratropics (Fig. 2B; Table 2). Based on speciation
289
and extinction estimates, we found positive diversification rates for both tropical (0.123
290
lineages Myr-1) and extratropical lineages (0.026 lineages Myr-1), although tropical net
291
diversification was almost five times higher (Fig. 2B).
13
For Pomacentridae the best-fit model was the ‘evolutionary speed’ model permitting
293
between-region speciation (Fig. 2C; Table 2). The estimated value for the between-region
294
speciation was similar to that estimated for extratropical speciation. Extinction rate was low for
295
both tropical and extratropical lineages, causing the difference found for speciation rates to be
296
the major influence in the observed difference in diversification rate among regions. We found
297
a higher tropical net diversification rate (0.108 lineages Myr-1) compared with the extratropics
298
(0.029 lineages Myr-1; Fig. 2C).
299
Within the Sparidae, the best supported model was also the ‘out of the tropics’ model, but
300
permitting between-region speciation (Fig. 2D; Table 2). The estimated between-region
301
speciation was lower than extratropical and tropical speciation rates in this model. Dispersal
302
rate was higher for tropical lineages expanding ranges into the extratropics rather than in the
303
opposite direction (Fig. 2D; Table 2). As in the Pomacentridae, the estimated extinction rate for
304
Sparidae was low for both regions, which resulted in a higher tropical net diversification rate
305
(0.062 lineages Myr-1) compared with the extratropics (0.033 lineages Myr-1; Fig. 2D).
306
Although the AIC results supported the ‘out of the tropics’ as the best model for
307
Chaetodontidae, Labridae and Sparidae (Table 2), our simulations for model selection showed
308
that given the available phylogenetic data, it is not possible to discriminate this model from the
309
‘evolutionary speed’ in all four families (Figure S5). Therefore, we can consider that these two
310
models equally fit our data. These results do not change the overall picture since the speciation
311
rates estimated under the ‘evolutionary speed’ model were still higher for tropical lineages in
312
all families, however it limits our inferences about the roles of extinction and dispersal.
313
When we considered time variation in evolutionary rates, the models received little
314
support compared to time-constant models in Pomacentridae and Sparidae (Table S2),
315
indicating little variation in rates through time. For Chaetodontidae and Labridae, the
14
variable model received support against the time-constant model, indicating that evolutionary
317
rates varied through time in these families. However, the differences among tropical and
318
extratropical rates showed the same pattern as in the time-constant models (Table S2), which
319
highlights the robustness of the predicted differences among regions in the these models.
320
The comparison of character dependent (BiSSE equivalent) and character independent
321
(HiSSE) models showed that for the Chaetodontidae, Pomacentridae and Sparidae, the presence
322
of unmeasured characters could not account for rate differences, since the character dependent
323
model received more support (Table S3). The pattern of higher tropical diversification rates
324
was maintained in the character dependent model for these families, which is consistent with
325
GeoSSE results. However, for Labridae, the character independent model received more
326
support (Table S3), indicating that some unmeasured character might be driving the pattern of
327
higher tropical diversification. When we plotted the net diversification along the labrid
328
phylogeny, we detected higher rates associated with the tropical clade that includes the genus
329
Thalassoma + Gomphosus and the tropical clade including the genus Scarus + Chlorurus (Fig.
330
3). These results does not invalidate the GeoSSE results as extratropical lineages were still
331
associated with lower net diversification rates, however, they show that most tropical lineages
332
had intermediate diversification rates, while two tropical clades displayed exceptionally higher
333
net diversification (Fig. 3; Table S3).
334
The simulation results showed that the Type I error rates of the GeoSSE model are
335
moderate to low. For speciation rates, the maximum error rates were 0.1 in Chaetodontidae,
336
while for net diversification we detected an error rate of 0.11 in the Labridae (Table S4). For
337
all other parameters, the GeoSSE model performed well in all families and we found Type I
338
error rates around 0.06 and 0.09 with some remaining below the 0.05 threshold. By using these
15
values to adjust the critical significance value for the empirical dataset, we found no differences
340
in results of parameter comparisons among geographical regions (Fig. 2).
341
342
DISCUSSION
343
We found marked differences in tropical and extratropical evolutionary rates with tropical
344
lineages showing higher diversification, mainly driven by more speciation in the tropics. In
345
addition, we report a tendency of higher dispersal rates for tropical lineages expanding ranges
346
into the extratropics. This suggests that the majority of extratropical lineages have arisen from
347
tropical ones. These results support the predictions of the ‘out of the tropics’ model of evolution
348
(Jablonski et al., 2006), although we also found support for the ‘evolutionary speed’ hypothesis
349
(Rohde, 1992). Our results confirm the tropics as an important evolutionary engine for marine
350
environments (Briggs, 2003), and highlight the complementarity of the predictions concerning
351
the evolutionary dynamics behind latitudinal differences in biodiversity for reef fishes.
352
Moreover, we find that two tropical Labridae lineages exhibit exceptionally higher
353
diversification than that expected by latitudinal differences alone.
354
Most reef fishes depend on available coral reef habitats, so geological climatic changes
355
that affected these environments might have also had a negative influence in their persistence
356
(Cowman & Bellwood, 2011; Pellissier et al., 2014). The areas in which coral reef habitats
357
remained stable over geological times served as refugia from extinction during periods of
358
drastic climatic fluctuations, such as the Pleistocene glacial cycles (Pellissier et al., 2014). Even
359
though habitat loss resulting from climatic oscillations and tectonic activity are likely to have
360
caused extinctions in tropical fish and other reef associated lineages in the past (Renema et al.,
361
2008), fracturing and isolation of refugia may have also increased potential for speciation in
362
some tropical regions (Pellissier et al., 2014). Our results show that this effect might be less
16
pronounced for extratropical lineages, with the lack of fragmented or stable extratropical
364
refugia resulting in lower rates of speciation. Peripheral extratropical reefs may have
365
historically acted as reef fish biodiversity sinks. In particular for Chaetodontidae, the estimated
366
negative net diversification indicates that the extratropics might be a recipient of lineages
367
through speciation and dispersal from the tropics with little subsequent speciation to counteract
368
the extratropical higher rate of extinction.
369
Patterns of diversification have previously been examined for several reef fish groups,
370
with reef association linked to higher clade diversity (Alfaro et al., 2007; Cowman & Bellwood,
371
2011). Here, we show that reef fish diversification patterns also follow a clear geographical
372
trend of higher diversification rates for tropical lineages compared to extratropical ones. Our
373
estimated values for tropical net diversification in Chaetodontidae, Labridae and Pomacentridae
374
are very similar to whole family estimates calculated by Cowman & Bellwood (2011),
375
reflecting the predominance of tropical species within these families. As for Sparidae, our
376
finding of a higher tropical lineage diversification is a surprising result considering that most
377
of the contemporary species within this family are associated with extratropical environments.
378
This suggests that the actual species richness distribution within this family might be greatly
379
influenced by lineage dispersal. By comparing our results to other works that used a similar
380
approach but different taxa (Pyron & Wiens, 2013; Pyron, 2014; Rolland et al., 2014), it is
381
possible to infer that higher tropical net diversification might be a general pattern for vertebrates
382
across different phylogenetic scales and in both terrestrial and marine environments.
383
In addition to the geographical results, we show that exceptionally high rates of lineage
384
diversification are associated with two predominantly tropical clades in the family Labridae.
385
Similar rate shifts in the Labridae have been reported previously (Alfaro et al., 2009), associated
386
with the tribe Julidines and a clade containing Scarus + Chlorurus. Here, we show that the rate
17
shifts previously reported to be associated with the Julidines might represent a trickle-down
388
effect driven by the sub-clade including Thalassoma + Gomphosus (Fig. 3). In the case of
389
Scarus + Chlorurus, the previously identified shift in diversification rate was associated with
390
their pronounced dichromatism and other social and behavioral characters related to sexual
391
selection (Alfaro et al., 2009; Kazancioglu et al., 2009). It is possible that this same trait might
392
also explain an elevated diversification rate in the clade Thalassoma + Gomphosus, since
393
species within this group also display extreme sexual dichromatism (Kuiter, 2010). If true, then
394
these two tropical clades might have undergone a sequential pattern of diversification
395
(Streelman & Danley, 2003) driven by the development of complex mating behaviors and
396
phenotype throughout sexual selection. But, a number of other factors could also be involved.
397
Both clades also have a complex longitudinal biogeographic history (Cowman & Bellwood,
398
2013). Both clades have pantropical distributions (Choat et al., 2012; Bernardi et al., 2004),
399
and in the case of Thalassoma, speciation and rapid range overlap have already been identified
400
(Quenouille et al., 2011). Other functional traits such as diet have also been shown to play an
401
important role in diversification rate differences (Lobato et al., 2014). Further research is
402
needed to tease apart the geographic and ecological components of speciation in these clades.
403
Although some caution has been raised recently about the SSE methods (Davis et al.,
404
2013; Rabosky & Goldberg, 2015), the differences in rate estimates we observe in the present
405
study are consistent across families in the modeling procedure and robust when accounting for
406
time variation. Moreover, our simulation results show that the Type I error rates from the
407
GeoSSE model might be well below those found for the BiSSE model (Rabosky & Goldberg,
408
2015), which reinforces the robustness of the differences found among geographical regions.
409
With the Monte Carlo method, we also assessed the power of our analysis to detect real
410
differences between models, which has been considered a major issue in phylogenetic
18
comparative methods (Boettiger et al., 2012). The results from this model selection framework
412
showed that both the ‘out of the tropics’ and the ‘evolutionary speed’ models equally fit our
413
data and the direction of parameters estimated by these models were consistent with each
414
evolutionary hypothesis. This highlights that differential rates of speciation have played a major
415
and consistent role in the latitudinal differences in biodiversity for reef associated fishes,
416
although we cannot discard extinction and dispersal as possible drivers of this pattern.
417
Our results emphasize a climatic component influencing the biodiversity pattern for reef
418
fishes, however we do not rule out the influence of other processes that are also known to have
419
generated and maintained reef fish diversity through time. Processes such as tectonic activity,
420
changes in sea level, oceanographic conditions and geomorphological configuration are also
421
recognized as important drivers of extant patterns of reef fish diversity (Renema et al., 2008;
422
Bellwood et al., 2012). While these processes have been associated with the marked
423
longitudinal diversity gradient presented by reef fishes and other reef associated organisms,
424
their influence on the latitudinal gradient has yet to be fully determined. A better understanding
425
of how these processes influenced the evolution of reef fishes by altering rates of speciation,
426
extinction and dispersal is needed. This will allow us to disentangle the historical,
427
biogeographic and environmental factors and how they have interacted to shape global reef fish
428
diversity patterns.
429
430
CONCLUSIONS
431
Our study suggests that the tropics enhance lineage origination and may have reduced
432
lineage extinction rates in reef fishes while being a fountain of evolutionary lineages to
433
extratropical environments. We also highlight two tropical lineages in the family Labridae
434
which have undergone sequential diversification potentially associated with extreme sexual
19
dichromatism. Alternatively, higher diversification in these clades might have been driven by
436
longitudinal biogeography across the marine tropics. Hence, our study proposes that speciation,
437
extinction and dispersal are key processes that generate and maintain higher tropical reef fish
438
species richness. To our knowledge, this is the first time that these processes have been
439
examined across multiple reef fish groups to reveal the mechanisms that promote latitudinal
440
differences in biodiversity. We suggest that further studies should explore how these
441
macroevolutionary dynamics influence other patterns in marine biodiversity.
442
443
ACKNOWLEDGEMENTS
444
We would like to thank B. Frédérich, F. Santini and S. Klanten for making their
445
phylogenies available. For comments and discussions on earlier drafts we also thank R.A.
446
Morais, E.L.H. Giehl, M.R. Pie, A. Lindner and three anonymous reviewers. This work was
447
financially supported by the Brazilian agenciesCAPES (A.C.S. master’s grant), CNPq (S.R.F.
448
grant - 309472/2011-3), FUNDECT (L.G.R.O.S. grant - 31445.448.13799.18082014), and by
449
the Yale Institute for Biospheric Studies - YIBS (P.F.C. Gaylord Donnelley Postdoctoral
450
Environmental Fellowship).
20
REFERENCES
452
Alfaro, M.E., Brock, C.D., Banbury, B.L. & Wainwright, P.C. (2009) Does evolutionary
453
innovation in pharyngeal jaws lead to rapid lineage diversification in labrid fishes? BMC
454
evolutionary biology, 9, 255.
455
Alfaro, M.E., Santini, F. & Brock, C.D. (2007) Do reefs drive diversification in marine
456
teleosts? Evidence from the pufferfish and their allies (Order Tetraodontiformes).
457
Evolution, 61, 2104–2126.
458
Allen, G.R. (1991) Damselfishes of the world, MERGUS Publishers, Melle.
459
Beaulieu, J.M. & O’Meara, B.C. (2016) Detecting hidden diversification shifts in models of
460
trait-dependent speciation and extinction. Systematic Biology, doi:
461
10.1093/sysbio/syw022.
462
Bellwood, D.R., Hughes, T.P., Connolly, S.R. & Tanner, J. (2005) Environmental and
463
geometric constraints on Indo-Pacific coral reef biodiversity. Ecology Letters, 8, 643–
464
651.
465
Bellwood, D.R., Renema, W. & Rosen, B.R. (2012) Biodiversity hotspots, evolution and coral
466
reef biogeography. Biotic Evolution and Environmental Change in Southeast Asia (ed.
467
by D.J. Gower, K. Johnson, J. Richardson, B. Rosen, L. Rüber, and S. Williams), pp. 2–
468
32. Cambridge University Press, Cambridge.
469
Bellwood, D.R. & Wainwright, P.C. (2002) The history and biogeography of fishes on coral
470
reefs. Coral reef fishes: dynamics and diversity on a complex ecosystem (ed. by P. Sale),
471
pp. 5–32. Academic Press, San Diego.
472
Bernardi, G., Bucciarelli, G., Costagliola, D., Robertson, D.R. & Heiser, J.B. (2004)
473
Evolution of coral reef fish Thalassoma spp. (Labridae). 1. Molecular phylogeny and
474
biogeography. Marine Biology, 144, 369–375.
475
Boettiger, C., Coop, G., Ralph, P. (2012) Is your phylogeny informative? Measuring the
476
power of comparative methods. Evolution, 66, 2240–2251.
477
Briggs, J.C. (2003) Marine centres of origin as evolutionary engines. Journal of
478
Biogeography, 30, 1–18.
479
Briggs, J.C. (1974) Marine zoogeography, McGraw-Hill, New York.
480
Choat, J.H., Klanten, O.S., Van Herwerden, L., Robertson, R.D. & Clements, K.D. (2012)
481
Patterns and processes in the evolutionary history of parrotfishes (Family Labridae).
482
Biological Journal of the Linnean Society, 107, 529–557.
21
Cowman, P.F. & Bellwood, D.R. (2011) Coral reefs as drivers of cladogenesis: expanding
484
coral reefs, cryptic extinction events, and the development of biodiversity hotspots.
485
Journal of Evolutionary Biology, 24, 2543–2562.
486
Cowman, P.F. & Bellwood, D.R. (2013) The historical biogeography of coral reef fishes:
487
global patterns of origination and dispersal. Journal of Biogeography, 40, 209–224.
488
Davis, M.P., Midford, P.E. & Maddison, W. (2013) Exploring power and parameter
489
estimation of the BiSSE method for analyzing species diversification. BMC Evolutionary
490
Biology, 13, 38.
491
Dowle, E.J., Morgan-Richards, M. & Trewick, S.A. (2013) Molecular evolution and the
492
latitudinal biodiversity gradient. Heredity, 110, 501–510.
493
Ebeling, A.W. & Hixon, M.A. (1991) Tropical and temperate reef fishes: comparison of
494
community structures. The Ecology of Fishes on Coral Reefs (ed. by P.F. Sale), pp. 509–
495
563. Academic Press, San Diego.
496
Eschmeyer, W.N. (2014) Catalog of Fishes. Version 2014.8,
497
http://research.calacademy.org/research/ichthyology/catalog/fishcatmain.asp.
498
Fischer, A.G. (1960) Latitudinal variations in organic diversity. Evolution, 14, 64–81.
499
FitzJohn, R.G. (2012) Diversitree: comparative phylogenetic analyses of diversification in R.
500
Methods in Ecology and Evolution, 3, 1084–1092.
501
Frédérich, B., Sorenson, L., Santini, F., Slater, G.J. & Alfaro, M.E. (2013) Iterative ecological
502
radiation and convergence during the evolutionary history of damselfishes
503
(Pomacentridae). The American Naturalist, 181, 94–113.
504
Froese, R. & Pauly, D. (2014) FishBase. Version 2014.8, www.fishbase.org.
505
Goldberg, E.E., Lancaster, L.T. & Ree, R.H. (2011) Phylogenetic inference of reciprocal
506
effects between geographic range evolution and diversification. Systematic Biology, 60,
507
451–465.
508
Hillebrand, H. (2004) On the generality of the latitudinal diversity gradient. The American
509
Naturalist, 163, 192–211.
510
IUCN (2014) IUCN Red List of Threatened Species. Version 2014.2, www.iucnredlist.org.
511
Jablonski, D., Roy, K. & Valentine, J.W. (2006) Out of the tropics: evolutionary dynamics of
512
the latitudinal diversity gradient. Science, 314, 102–106.
513
Kazancioglu, E., Near, T.J., Hanel, R. & Wainwright, P.C. (2009) Influence of sexual
514
selection and feeding functional morphology on diversification rate of parrotfishes
515
(Scaridae). Proceedings of the Royal Society B: Biological Sciences, 276, 3439–3446.
22
Kuiter, R.H. (2010) Labridae fishes: Wrasses, Aquatic Photographics, Seaford.
517
Lobato, F.L., Barneche, D.R., Siqueira, A.C., Liedke, A.M.R., Lindner, A., Pie, M.R.,
518
Bellwood, D.R. & Floeter, S.R. (2014) Diet and diversification in the evolution of coral
519
reef fishes. PLoS ONE, 9, e102094.
520
Mittelbach, G.G., Schemske, D.W., Cornell, H. V, Allen, A.P., Brown, J.M., Bush, M.B.,
521
Harrison, S.P., Hurlbert, A.H., Knowlton, N., Lessios, H.A., McCain, C.M., McCune,
522
A.R., McDade, L.A., McPeek, M.A., Near, T.J., Price, T.D., Ricklefs, R.E., Roy, K.,
523
Sax, D.F., Schluter, D., Sobel, J.M. & Turelli, M. (2007) Evolution and the latitudinal
524
diversity gradient: speciation, extinction and biogeography. Ecology Letters, 10, 315–
525
331.
526
Mora, C., Chittaro, P.M., Sale, P.F., Kritzer, J.P. & Ludsin, S.A. (2003) Patterns and
527
processes in reef fish diversity. Nature, 421, 933–936.
528
Paradis, E., Claude, J. & Strimmer, K. (2004) APE: Analyses of Phylogenetics and Evolution
529
in R language. Bioinformatics, 20, 289–290.
530
Parravicini, V., Kulbicki, M., Bellwood, D.R., Friedlander, A.M., Arias-Gonzalez, J.E.,
531
Chabanet, P., Floeter, S.R., Myers, R., Vigliola, L., D’Agata, S. & Mouillot, D. (2013)
532
Global patterns and predictors of tropical reef fish species richness. Ecography, 36,
533
1254–1262.
534
Pellissier, L., Leprieur, F., Parravicini, V., Cowman, P.F., Kulbicki, M., Litsios, G., Olsen,
535
S.M., Wisz, M.S., Bellwood, D.R. & Mouillot, D. (2014) Quaternary coral reef refugia
536
preserved fish diversity. Science, 344, 1016–1019.
537
Pyron, R.A. (2014) Temperate extinction in squamate reptiles and the roots of latitudinal
538
diversity gradients. Global Ecology and Biogeography, 23, 1126–1134.
539
Pyron, R.A. & Wiens, J.J. (2013) Large-scale phylogenetic analyses reveal the causes of high
540
tropical amphibian diversity. Proceedings of the Royal Society B: Biological Sciences,
541
280, 20131622.
542
Quenouille, B., Hubert, N., Bermingham, E. & Planes, S. (2011) Speciation in tropical seas:
543
allopatry followed by range change. Molecular Phylogenetics and Evolution, 58, 546–
544
552.
545
R Core Team (2014) R: A Language and Environment for Statistical Computing. R
546
Foundation for Statistical Computing, http://www.r–project.org.
547
Rabosky, D.L. & Goldberg, E.E. (2015) Model inadequacy and mistaken inferences of
trait-548
dependent speciation. Systematic Biology, 64, 340–355.
549
Randall, J.E. (2005) Reef and shore fishes of the South Pacific, University of Hawaii Press,
550
Honolulu.
23
Renema, W., Bellwood, D.R. & Braga, J.C. (2008) Hopping hotspots: global shifts in marine
552
biodiversity. Science, 321, 654–657.
553
Ricklefs, R.E. (2006) Evolutionary diversification and the origin of the diversity-environment
554
relationship. Ecology, 87, S3–13.
555
Rohde, K. (1992) Latitudinal gradients in species diversity: the search for the primary cause.
556
Oikos, 65, 514–527.
557
Rolland, J., Condamine, F.L., Jiguet, F. & Morlon, H. (2014) Faster speciation and reduced
558
extinction in the tropics contribute to the Mammalian latitudinal diversity gradient. PLoS
559
Biology, 12, e1001775.
560
Santini, F., Carnevale, G. & Sorenson, L. (2014) First multi-locus timetree of seabreams and
561
porgies (Percomorpha: Sparidae). Italian Journal of Zoology, 81, 55–71.
562
Streelman, J.T. & Danley, P.D. (2003) The stages of vertebrate evolutionary radiation. Trends
563
in Ecology and Evolution, 18, 126–131.
564
Tittensor, D.P., Mora, C., Jetz, W., Lotze, H.K., Ricard, D., Berghe, E. Vanden & Worm, B.
565
(2010) Global patterns and predictors of marine biodiversity across taxa. Nature, 466,
566
1098–1101.
567
Wiens, J.J. & Donoghue, M.J. (2004) Evolutionary diversification and the origin of the
568
diversity-environment relationship. Trends in Ecology & Evolution, 19, 639–644.
569
570
BIOSKETCH
571
A.C. Siqueira obtained his MSc at the Universidade Federal de Santa Catarina, being supervised
572
by S.R. Floeter in the Marine Macroecology and Biogeography Lab. His main research interests
573
lies in historical, evolutionary and ecological processes that determine contemporary patterns
574
in species distributions.
575
576
24
TABLES
[image:25.595.74.526.176.236.2]578
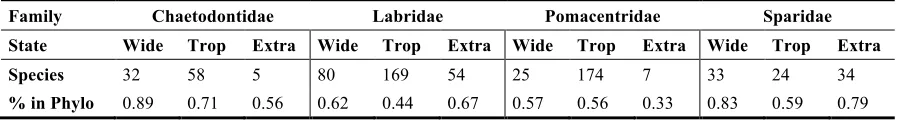
Table 1. Absolute number of species represented in phylogenies and the respective proportion in relation
579
to all recognized species by family in each character state: widespread (Wide), tropical (Trop),
580
extratropical (Extra).
581
Family Chaetodontidae Labridae Pomacentridae Sparidae State Wide Trop Extra Wide Trop Extra Wide Trop Extra Wide Trop Extra Species 32 58 5 80 169 54 25 174 7 33 24 34
% in Phylo 0.89 0.71 0.56 0.62 0.44 0.67 0.57 0.56 0.33 0.83 0.59 0.79 582
25 Table 2. Comparison between models constructed underGeoSSE for each family ordered by Delta AIC
584
(ΔAIC), with respective degrees of freedom (d.f.), log-likelihood (lnL) and Akaike Information Criterion
585
(AIC). Parameter estimates are: tropical speciation (sTrop), extratropical speciation (sEx), between regions
586
speciation (sBtw), tropical extinction (xTrop), extratropical extinction (xEx), dispersal from the tropics
587
(dTrop), dispersal from the extratropics (dEx).
588
589
590 591
Models d.f. lnL AIC ΔAIC sTrop sEx sBtw xTrop xEx dTrop dEx
Chaetodontidae
Out of the tropics(sBtw=0) 6 -332.9 677.9 0 2.7 e-01 3.6 e-02 - 1.4 e-01 4.8 e-01 3.2 e-01 3.9 e-08 Out of the tropics 7 -332.9 679.9 2.0 2.7 e-01 3.5 e-02 2.4 e-10 1.4 e-01 4.8 e-01 3.2 e-01 2.3 e-08
Evolutionary speed (sBtw=0) 4 -336.0 680.1 2.2 2.8 e-01 3.5 e-02 - 1.5 e-01 - 1.5 e-01 - Evolutionary speed 5 -336.0 682.1 4.2 2.8 e-01 3.5 e-02 1.5 e-08 1.5 e-01 - 1.5 e-01 -
Niche conservatism 5 -336.3 682.7 4.8 1.2 e-01 - 5.3 e-01 2.9 e-01 - 1.7 e-01 3.0
Niche conservatism (sBtw=0) 4 -337.4 682.9 5.0 2.4 e-01 - - 2.9 e-01 - 1.0 e-01 1.6 Evolutionary time (sBtw=0) 3 -347.1 700.3 22.4 1.9 e-01 - - 7.0 e-02 - 9.5 e-02 - Evolutionary time 4 -347.1 702.3 24.4 1.9 e-01 - 8.4 e-09 7.0 e-02 - 9.5 e-02 - Labridae
Out of the tropics(sBtw=0) 6 -1279.6 2571.2 0 1.2 e-01 6.1 e-02 - 5.6 e-07 3.5 e-02 4.9 e-02 8.2 e-03 Out of the tropics 7 -1279.6 2573.4 2.2 1.2 e-01 5.9 e-02 3.3 e-06 3.8 e-07 4.2 e-02 5.2 e-02 4.5 e-06
Evolutionary speed (sBtw=0) 4 -1284.7 2577.4 6.2 1.3 e-01 2.3 e-02 - 7.1 e-03 - 3.3 e-02 - Evolutionary speed 5 -1284.7 2579.4 8.2 1.3 e-01 5.3 e-02 6.3 e-09 7.1 e-03 - 3.3 e-02 -
Evolutionary time (sBtw=0) 3 -1306.5 2619.0 48.2 1.0 e-01 - - 9.2 e-03 - 3.0 e-02 - Niche conservatism (sBtw=0) 4 -1305.7 2619.4 48.6 1.0 e-01 - - 8.1 e-03 - 3.3 e-02 7.4 e-07 Evolutionary time 4 -1306.5 2621.0 50.2 1.0 e-01 - 8.1 e-07 9.1 e-03 - 3.0 e-02 -
Niche conservatism 5 -1305.7 2621.4 50.6 1.0 e-01 - 1.2 e-06 8.2 e-03 - 3.3 e-02 6.2 e-06 Pomacentridae
Evolutionary speed 5 -813.7 1637.5 0 1.0 e-01 2.9 e-02 1.7 e-02 5.8 e-09 - 1.5 e-02 -
Evolutionary speed (sBtw=0) 4 -815.7 1639.5 2 1.1 e-01 3.7 e-02 - 8.9 e-03 - 1.5 e-02 - Out of the tropics 7 -813.6 1641.2 3.7 1.0 e-01 3.6 e-02 1.7 e-02 5.2 e-10 2.0 e-02 1.8 e-02 1.0 e-02
Out of the tropics (sBtw=0) 6 -815.0 1642.1 4.6 1.0 e-01 5.5 e-02 - 3.6 e-07 4.9 e-02 2.1 e-02 7.9 e-03 Niche conservatism (sBtw=0) 4 -821.1 1650.2 12.7 1.0 e-01 - - 9.4 e-03 - 1.1 e-02 6.6 e-02 Niche conservatism 5 -820.1 1650.3 12.8 1.0 e-01 - 1.7 e-02 3.9 e-03 - 1.1 e-02 7.7 e-02
Evolutionary time (sBtw=0) 3 -822.3 1650.7 13.2 1.0 e-01 - - 4.8 e-03 - 1.3 e-02 - Evolutionary time 4 -821.6 1651.3 13.8 1.0 e-01 - 1.0 e-02 1.8 e-03 - 1.3 e-02 - Sparidae
Out of the tropics 7 -429.3 872.7 0 6.2 e-02 3.3 e-02 1.6 e-02 2.3 e-07 2.4 e-07 6.7 e-02 7.1 e-03
Evolutionary speed 5 -433.5 877.0 4.3 1.6 e-02 2.8 e-07 2.2 e-01 2.8 e-03 - 1.2 e-01 -
Out of the tropics (sBtw=0) 6 -432.5 877.1 4.4 6.6 e-02 4.2 e-02 - 4.5 e-03 1.4 e-02 7.6 e-02 5.4 e-03 Evolutionary time (sBtw=0) 4 -435.3 878.6 5.9 8.4 e-03 - 2.2 e-01 4.1 e-03 - 1.2 e-01 - Niche conservatism (sBtw=0) 4 -435.4 878.8 6.1 5.4 e-02 - - 8.1 e-03 - 6.0 e-02 1.9 e-02 Evolutionary time 3 -436.8 879.7 7.0 5.5 e-02 - - 1.0 e-02 - 4.0 e-02 -
Niche conservatism 5 -435.2 880.4 7.7 8.8 e-03 - 2.1 e-01 3.6 e-03 - 1.3 e-01 1.1 e-01
26 FIGURE LEGENDS
592
Figure 1. Map showing tropical (red) and extratropical (blue) reef locations around the world defined
593
by the isocrym of 20°C, which is considered the latitudinal distribution limit for tropical marine fauna
594
(Briggs, 1974).
595
596
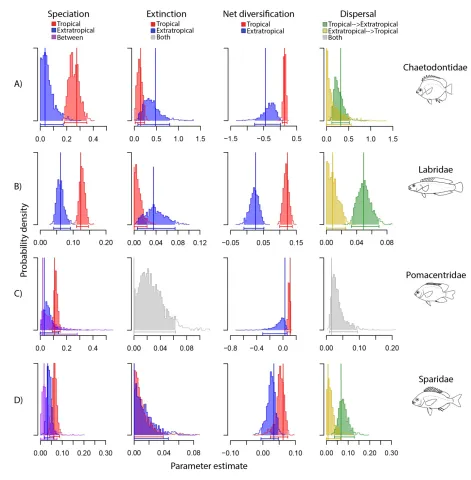
Figure 2. Rates of speciation, extinction and net diversification (speciation minus extinction) for tropical
597
(red) and extratropical (blue) lineages of four reef fish families. Dispersal rates are also shown with
598
tropical lineages expanding ranges into extratropical environments (green) and extratropical lineages
599
expanding ranges into the tropics (yellow). Probability density plots are based on 1000 Markov Chain
600
Monte Carlo samples of the best-fit model for each family under GeoSSE. Vertical lines represent
601
parameter estimates based on Maximum Likelihood of the best-fit GeoSSE model for each family.
602
Credibility intervals were adjusted by the Type I error rates calculated for each parameter using the
603
results from GeoSSE simulations in each family. For Pomacentridae and Sparidae the best-fit model
604
permitted the between regions speciation parameter (purple) to be > 0. For Pomacentridae, dispersal and
605
extinction were found to be equal for both tropical and extratropical lineages (shown in grey).
606
607
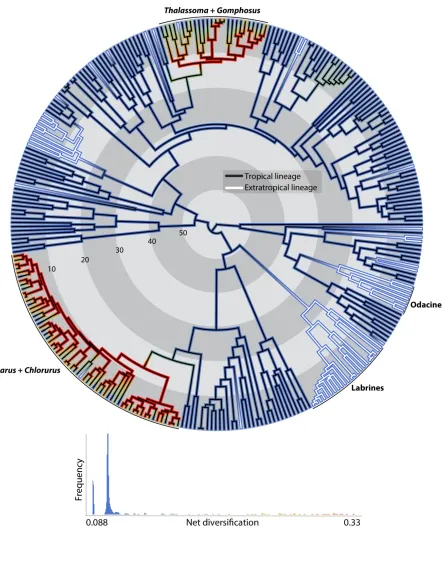
Figure 3. Labridae phylogeny built under HiSSE notation, showing tropical lineages (black branches)
608
and extratropical lineages (white branches), with respective net diversification rates (color gradient from
609
blue – lower diversification – to red – higher diversification). Four clades are highlighted, being two
610
tropical clades with high net diversification rates (Scarus + Chlorurus and Thalassoma + Gomphosus),
611
and two extratropical clades with low net diversification rates (Labrines and Odacines). The graph shows
612
the frequency of net diversification rates on the tips of the phylogeny, highlighting that there are few
613
lineages with high rates and more lineages with lower to intermediate rates.
614
615
27
FIGURES
617
Figure 1. 618
28 Figure 2.
621
29 Figure 3.
624
[image:30.595.81.523.91.654.2]