envelope genes. This hypothesis was tested by characterizing quasispecies in specimens collected every six months from a cohort of acutely HCV-infected subjects (mean duration of specimen collection, 72 months after seroconversion). We evaluated 5 individuals who spontaneously cleared viremia and 10 individuals with persistent viremia by cloning 33 1-kb amplicons that spanned E1 and the 5*half of E2, including hypervariable region 1 (HVR1). To assess the quasispecies complexity and to detect variants for sequencing, the first PCR-positive sample was examined by using a previously described method that combines heteroduplex analysis and analysis of single-stranded conformational polymorphisms. The ratio of nonsynonymous to synonymous substitutions (dN/dS) within each sample was evaluated as an indicator of relative selective
pressure. Amino acid sequences were analyzed for signature patterns, glycosylation signals, and charge. Quasispecies complexity was higher and E1dN/dSratios (selective pressure) were lower in those with persistent
viremia; the association with persistence was strengthened by the presence of a combination of both charac-teristics. In contrast, a trend toward higher HVR1 dN/dS ratios was detected among those with persistent
viremia. We did not detect any such association for factors that may affect complexity such as serum HCV RNA concentration. HVR1 had a lower positive charge in subjects with persistent viremia, although no consistent motifs were detected. Our data suggest that HCV persistence is associated with a complex quasispecies and immune response to HVR1.
An estimated 170 million people worldwide are infected with hepatitis C virus (HCV) (3), which may cause cirrhosis and hepatocellular carcinoma (2, 24, 35, 53). Viral persistence is central to HCV pathogenesis. Even though HCV-specific humoral and cellular immune responses are evident within months of exposure (7, 30, 37, 55), HCV RNA remains detect-able for more than 20 years in the blood and livers of up to 85% of infected people.
It is plausible that HCV persistence relates to viral diversity during acute infection. Mathematical models of viral kinetics estimate that more than 1012virions are produced each day in an infected person (39). Rapid replication and the absence of RNA polymerase proofreading result in accumulation of mu-tations at a rate of 0.431023to 1.231023base substitutions per site per year (1, 41, 42, 49). Consequently, many distinct but highly related variants coexist in the blood and liver of an individual, indicating that HCV exists as a quasispecies (23, 34, 51). Mutations may change an encoded amino acid (nonsyn-onymous) or result in the same amino acid (syn(nonsyn-onymous). Assuming that nonsynonymous mutations may allow immuno-logic escape (13, 59) and synonymous mutations have no di-rect immunological impact, the ratio of nonsynonymous to synonymous mutations may reflect the relative immune pres-sure at a locus (6, 47).
HCV diversity is greatest in the putative envelope genes, especially in a 27-amino-acid segment at the amino terminus of E2, designated hypervariable region 1 (HVR1) (21, 22, 28, 54).
We hypothesized that individuals who clear viremia have an immune response directed against more conserved regions and that people who develop persistent infection have a more com-plex initial quasispecies. Hypotheses regarding acute HCV in-fection are difficult to test because acute HCV inin-fection in humans is difficult to detect (patients are usually asymptom-atic) and because experimental infection of chimpanzees, the only animal model, infrequently results in persistent viremia (4). In addition, the traditional method of examining viral complexity, namely, sequencing of viral clones, is too cumber-some to be applied to large numbers of individuals.
Two recent developments enabled us to test this hypothesis. First, we identified and characterized the long-term virologic outcomes for 43 individuals with acute HCV infection (55). Second, we developed a method for efficiently and accurately characterizing the HCV quasispecies (58). In this study, these resources were used to examine viral complexity and distor-tions in amino acid sequences of subjects with persistent vire-mia versus those with self-limited virevire-mia. We also accounted for duration of infection and controlled for other factors (hu-man immunodeficiency virus [HIV] infection, race, age, and frequency of drug use) that may affect HCV clearance.
MATERIALS AND METHODS
Study subjects.Since 1988, approximately 3,000 former and current injection drug users, including 50 subjects who acquired HCV infection during follow-up, have been monitored in Baltimore, Md. In the principal cohort (ALIVE) (57), 43 HCV seroconverters were identified (56). In a second related cohort (REACH) (16), there were seven seroconverters. After a median of more than 6 years of semiannual follow-up subsequent to seroconversion, two distinct patterns of viremia were noted. For seven subjects HCV RNA was undetectable for a minimum of 2 years in at least four serum samples from each person. In contrast, for 43 subjects HCV RNA remained detectable in the last specimen tested. The viral load trajectories and temporal sequence of HCV RNA and levels of
anti-* Corresponding author. Mailing address: Division of Infectious Diseases, 720 Rutland Ave., Ross 1159, Baltimore, MD 21205. Phone: (410) 955-0349. Fax: (410) 614-9775. E-mail: dthomas@welchlink .welch.jhu.edu.
2938
on November 9, 2019 by guest
body detected for the 43 subjects from the ALIVE cohort are described else-where (55).
Of the seven subjects with self-limited viremia, HCV RNA was never recov-ered from one subject and was not amplified in E1 from a second, leaving five case subjects for further virologic study. HCV RNA characterizations for these 5 case subjects were compared with those for 10 control subjects chosen from 29 subjects exhibiting HCV seroconversion and having persistent viremia for at least 6 years (eight subjects did not have sufficient follow-up to be classified as per-sistently viremic). Case subjects and controls were matched for HIV-1 serostatus, race, age, and active versus inactive drug use, in that hierarchical order, based on the theoretical and empirically recognized effects of these factors on viral per-sistence. They are herein designated by letters of the alphabet.
Storage of serum and testing for anti-HCV.All serum samples were centri-fuged on site, stored for less than 1 week at220°C, and subsequently stored at 270°C. They were tested for antibodies to HCV (HCV EIA 2.0; Ortho Diag-nostics, Raritan, N.J.) and, if these results were positive, by a strip immunoblot assay (RIBA HCV 2.0; Chiron Corporation, Emeryville, Calif.), as previously described (56).
Generic detection of HCV RNA.For all HCV seroconverters, we evaluated the presence of HCV RNA in sera collected 6 months before seroconversion, at seroconversion, and at a median of eight additional semiannual visits (55). HCV RNA was initially detected by a quantitative reverse transcriptase PCR (RT-PCR) assay (AMPLICOR HCV MONITOR; Roche Diagnostic Systems, Branchburg, N.J.), the linear range of which was determined to be 500 to 500,000 copies per ml of serum by our and other laboratories (18, 45). Results below the linear range of the quantitative assay were assigned a value of 250 copies per ml and, when additional sample was available, were tested again with one of two qualitative RT-PCR assays: an assay using an AMPLICOR HCV detection kit (Roche Diagnostic Systems) and an in-house nested-PCR assay using primers representing conserved sequences of the 59noncoding region (52). With the latter assays, the limit for detecting a subtype 1a reference strain (Hutchinson) (41) was approximately 100 copies per ml. In this study, data were analyzed for the first serum sample from which HCV cDNA was amplified.
Envelope region amplification.An HCV RNA characterization for each of 15 subjects was based on examination of 33 1,026-nucleotide cloned cDNAs span-ning the region thought to encode envelope protein E1 and a segment of the E2 region, including HVR1 (Fig. 1). RNA was extracted from 100ml of plasma or serum by using acid guanidinium thiocyanate (58). The RNA pellet was washed with 75% (vol/vol) ethanol, briefly air dried, and then redissolved in 50ml of diethyl pyrocarbonate-treated water with 10 mM dithiothreitol (Promega, Mad-ison, Wis.) and 5 U of RNasin ribonuclease inhibitor (Promega). After incuba-tion at 65°C for 5 min, 5ml of purified RNA was used to generate cDNA in a 20-ml reaction mixture at 37°C for 1 h with 20 U of Moloney murine leukemia virus RT (Perkin-Elmer, Foster City, Calif.) and the first-round PCR reverse primer. The entire 20-ml cDNA synthesis reaction mixture was used for the first-round PCR in a 25-ml reaction mixture containing 0.625 U ofTaq polymer-ase (Life Technologies), 1.5 mM MgCl2, 0.2 mM deoxynucleoside triphosphates,
and 0.4mM primers. The primers (and positions relative to the HCV-1 genome 59terminus [12]) were as follows: outer forward (positions 493 to 518), 59-GC AACAGGGAACCTTCCTGGTTGCTC-39; outer reverse (positions 1745 to 1723), 59-GGGCAGDBCARRGTGTTGTTGCC-39; inner forward (positions 502 to 527), 59-AACCTTCCTGGTTGCTCTTTCTCTAT-39; and inner reverse (positions 1527 to 1507), 59-GAAGCAATAYTGYGGRCCACA-39. Degenerate bases are indicated with standard codes of the International Union of Pure and Applied Chemistry. The forward primers are based on the work of Bukh et al. (8). Ten microliters of the first reaction product was used as the template for the inner nested PCR. Thermal-cycling conditions for both the inner and outer
reactions were 10 cycles at 94°C for 10 s, 65°C for 30 s, and 72°C for 60 s, followed by 25 cycles at 94°C for 10 s, 65°C for 30 s, and 72°C for 90 s.
Cloning of cDNA and complexity analysis of 33 cloned cDNAs by gel shift analysis.The 1-kb HCV cDNA product was ligated into the vector pCR 2.1 and used to transform I F9cells (TA cloning kit; Invitrogen, Carlsbad, Calif.). Trans-formants were detected according to the manufacturer’s protocol, and cloning efficiency was.90%.
For each subject, the gel shift patterns of 33 cloned cDNAs were examined by amplifying a 452-bp region spanning HVR1 and by using a nonradioactive method that detects distinct variants within a sample by a combination of het-eroduplex analysis (HDA) and single-stranded conformational polymorphism analysis (SSCP) in a single gel (HDA1SSCP) (58). Clonotypes are defined as cloned cDNAs with indistinguishable patterns of electrophoretic migration by HDA1SSCP. In our earlier study, the mean (6standard deviation) genetic diversity of cloned cDNAs belonging to the same clonotype (intraclonotype diversity) was 0.6% (60.9%), with 98.7% differing by less than 2%. The com-plexity of the quasispecies was characterized with the clonotype ratio, calculated as the number of clonotypes divided by 33, the number of cloned cDNAs examined. The clonotype ratio therefore varies from 0.03 (homogeneous) to 1 (highly complex).
Sequencing and signature pattern analysis.To examine each subject’s quasi-species for signature sequences (motifs uniquely shared by a group of sequences) and for distortions in the ratio of nonsynonymous to synonymous substitutions (dN/dS), a subset of cloned cDNAs was identified for sequencing. For each subject, at least three cloned cDNAs were selected for sequencing based on gel shift patterns: two from the majority clonotype, one from each clonotype con-sisting of more than 10% of the 33 cloned cDNAs examined, and the cloned cDNA with the largest heteroduplex gel shift. Plasmid DNA was isolated from a 3.5-ml broth culture (High Pure plasmid isolation kit; Boehringer Mannheim) according to the manufacturer’s protocol. Sequences from this DNA and the forward and reverse primers were determined by using a PRISM version 2.1.1 automated sequencer (Applied Biosystems Inc., Foster City, Calif.). Sequences were assembled and edited with Sequencher (Gene Codes, Ann Arbor, Mich.) by a technician who was unaware of our hypotheses. Primer sequences were re-moved prior to analysis. Signature pattern analysis was performed with the Viral Envelope Signature Pattern Analysis (VESPA) program (26).
Variability analysis.A software program (VarPlot for Windows) was devel-oped by S. C. Ray to calculate values fordN,dS, or thedN/dSratio in a “sliding window” of nucleotide sequence. A segment of defined length, in this case 60 bp (the window size), was used to determine the genetic distance, or number of mutations per site. This process was then repeated for an overlapping segment of 60 bp, which was shifted by 3 bp (the step size), and continued across the alignment. At each step all pairwise comparisons (up to 45) for a subject were performed and values were averaged. The mean values for all subjects were then averaged, ensuring that each subject was given equal weight. The method of Nei and Gojobori (38) was used to calculate the nonsynonymous genetic distance (number of nonsynonymous changes per nonsynonymous site) and the synony-mous genetic distance. The Jukes-Cantor correction was used to correct for underestimation of distance due to multiple substitutions at the same site (20). To determine thedN/dSratio, values fordNanddS, thedN/dSratio for nonzero values ofdS, and then the meandN/dSratio were calculated for each subject. In a similar mannerdNminusdSwas also determined, except that the calculation did not require discarding values whendNminusdSwas equal to 0. VarPlot is available from S. C. Ray on request ([email protected]).
Phylogenetic analysis.The sequence alignment was randomly permuted 100 times by using the SEQBOOT program from the PHYLIP package, version 3.572c (14, 15). DNA distance matrices were calculated by using the DNADIST FIG. 1. Diagram depicting the studied portion of the HCV genome and locations of the PCR primers (arrowheads) used in this study. Positions are based on the work of Choo et al. (12). 59NCR and 39NCR, 59and 39noncoding region, respectively.
on November 9, 2019 by guest
http://jvi.asm.org/
program, maximum-likelihood model, with a transition-to-transversion ratio of 4.25 (50). Permuted trees were generated by using the NEIGHBOR program with random addition, and bootstrap values were obtained by using CONSENSE. The indicated subtype reference sequences used for phylogenetic analysis had the following GenBank accession numbers: 1a, AF009606 and M62321; 1b, D90208; 1c, D14853; 2a, D00944; 2b, D10988; 3a, D17763; 4a, Y11604; 5a, Y13184; 6a, Y12083; “7a,” D84263; “8a,” D84264; “9a,” D84265; “10a,” D63821; and “11a,” D63822. Proposed subtype designations are in quotes.
Statistical analysis.After examination of the distribution of data, statistical inference was made by using the nonparametric Mann-Whitney test of medians. APvalue less than 0.05 was considered significant.
Nucleotide sequence accession numbers.The sequences were submitted to GenBank and were assigned accession no. AF118570 through AF118632.
RESULTS
Subjects and initial sequence analysis. No difference was detected between case and control subjects in the matching criteria (HIV status, race, age, and drug use activity) or the levels of HCV RNA in serum (Table 1).
From 15 serum samples, representing the first specimen
Phylogenetic analysis revealed that twelve subjects’ se-quences clustered with subtype 1a, while those of the other three (D, AW, and BF) (Table 2) clustered with subtype 1b (data not shown). Both groups (subjects exhibiting clearance and those exhibiting persistence) had a 4:1 ratio of subtypes 1a and 1b. For all 15 pairs of sequences representing each major-ity clonotype, intraclonotype diversmajor-ity was less than 1%, un-derscoring the sensitivity of the HDA1SSCP method.
Analysis of virologic determinants of viremia.Because viral envelope proteins are important determinants of tropism and immunogenicity, we assessed the physicochemical properties of the protein sequences deduced from the amplified se-quences by using a majority representative sequence for each subject (Fig. 2). HVR1 sequences from the subjects who cleared their viremia were significantly more positively charged than those who did not (median,13 versus11.5;P,0.03).
There were 10 potential N-linked glycosylation sites (NXS or NXT) present in the amplified region based on the HCV-1 and Hutchinson sequences. These were highly conserved in all subtype 1a sequences (Fig. 2). Subtype 1b sequences (from subjects F, AW, and BF, as well as reference strain HCV-J) shared 9 of the 10 sites of HCV-1, with loss of the site at position 476 and addition of a site at position 250. Sequences from subject BF also carried an additional site at position 478. N-linked glycosylation sites were 100% conserved among the sequenced cloned cDNAs from each individual. Viremia
per-cNumber of months from HCV seroconversion to HCV RNA detection. Negative values indicate RNA detected prior to seroconversion; median (range). dSelf-reported drug use in episodes during the year following HCV serocon-version; median (range).
[image:3.612.53.293.92.199.2]e[HCV RNA], HCV RNA copies per milliliter of serum, at the time of sampling for this study; median (range).
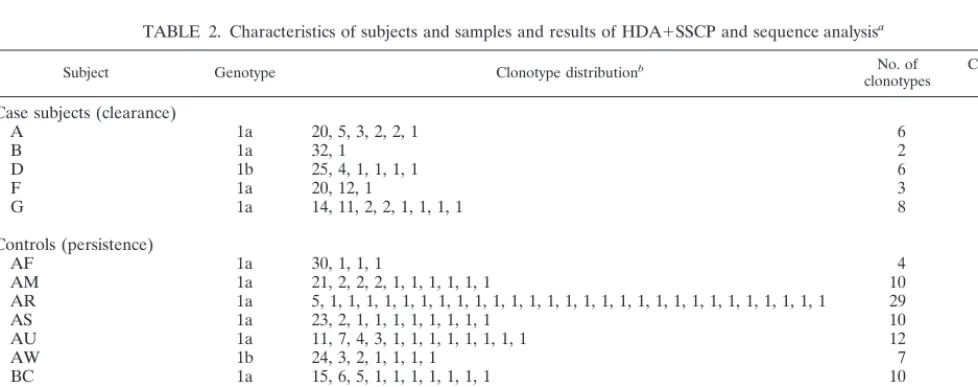
TABLE 2. Characteristics of subjects and samples and results of HDA1SSCP and sequence analysisa
Subject Genotype Clonotype distributionb No. of
clonotypes Clonotyperatio
Case subjects (clearance)
A 1a 20, 5, 3, 2, 2, 1 6 0.18
B 1a 32, 1 2 0.06
D 1b 25, 4, 1, 1, 1, 1 6 0.18
F 1a 20, 12, 1 3 0.09
G 1a 14, 11, 2, 2, 1, 1, 1, 1 8 0.24
Controls (persistence)
AF 1a 30, 1, 1, 1 4 0.12
AM 1a 21, 2, 2, 2, 1, 1, 1, 1, 1, 1 10 0.30
AR 1a 5, 1, 1, 1, 1, 1, 1, 1, 1, 1, 1, 1, 1, 1, 1, 1, 1, 1, 1, 1, 1, 1, 1, 1, 1, 1, 1, 1, 1 29 0.88
AS 1a 23, 2, 1, 1, 1, 1, 1, 1, 1, 1 10 0.30
AU 1a 11, 7, 4, 3, 1, 1, 1, 1, 1, 1, 1, 1 12 0.36
AW 1b 24, 3, 2, 1, 1, 1, 1 7 0.21
BC 1a 15, 6, 5, 1, 1, 1, 1, 1, 1, 1 10 0.30
BE 1a 8, 5, 5, 2, 1, 1, 1, 1, 1, 1, 1, 1, 1, 1, 1, 1, 1 17 0.52
BF 1b 32, 1 2 0.06
BH 1a 6, 2, 2, 2, 2, 2, 1, 1, 1, 1, 1, 1, 1, 1, 1, 1, 1, 1, 1, 1, 1, 1, 1 23 0.70
aClonotype, a group of electrophoretically indistinguishable cloned cDNAs; clonotype ratio, the number of clonotypes divided by 33, the number of clones examined. bEach number represents a clonotype; the value indicates the number of cloned cDNAs assigned to that clonotype by the HDA1SSCP method.
on November 9, 2019 by guest
[image:3.612.59.548.518.711.2]sistence did not correlate with predicted N-linked glycosyla-tion. Likewise, there were 14 cysteine residues in the amplified region, and all 14 were conserved in 61 of 63 sequences; the two isolated exceptions were consistent with sporadic substitu-tion.
To test the hypothesis that a signature sequence within the amplified region is linked to clearance or persistence of vire-mia, signature pattern analysis was applied. One representative sequence was chosen for each sample. In all cases, one of the majority clonotype sequences also represented the consensus sequence at each amino acid position for that sample. Signa-ture pattern analysis identified eight amino acid positions at which the majority amino acid differed between case and con-trol subject sequences (Fig. 3). However, at none of these positions was a residue uniquely present in either outcome group and, in all but one case, the amino acids found in the 15 HCV seroconverters were well represented among 58 other HCV sequences from GenBank. The one exception was posi-tion 431, which contained alanine in 7 of our 15 sequences. The GenBank sequences uniformly had an acidic residue (aspartate or glutamate) at position 431; hence, none had an alanine at this position. This residue may be a feature of the regional (Baltimore) epidemic from which the subjects were enrolled; however, the proportions of samples containing this alanine were not different between the two outcome groups.
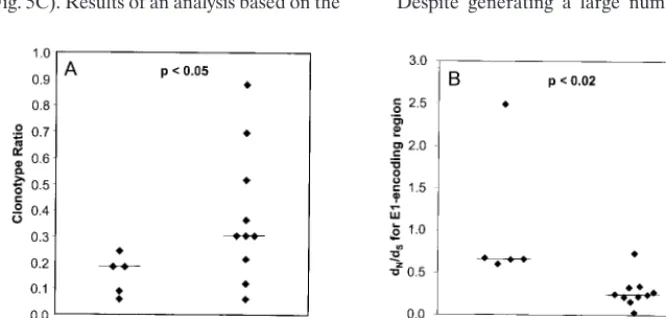
Quasispecies complexity and the outcome of acute infection. As hypothesized, case subjects (who cleared viremia) had lower median quasispecies complexity as measured by clono-type ratio than controls (whose viremia persisted) (P,0.05) (Fig. 4A). While no one who cleared viremia had a quasispe-cies complexity value greater than 0.3, 3 of the 10 controls had levels of complexity as low as those of the five case subjects. Therefore, low quasispecies complexity may be necessary, but not sufficient, for clearance of hepatitis C viremia, suggesting that other factors may be important.
dN/dSratios and outcome of acute infection.Case subjects
had significantly higherdN/dSratios for E1 than controls (P, 0.02) (Fig. 4B). This difference was decreased when the E2 segment was added to the analysis (data not shown), suggesting that the patterns of nonsynonymous substitutions differed in the E1 and E2 regions.
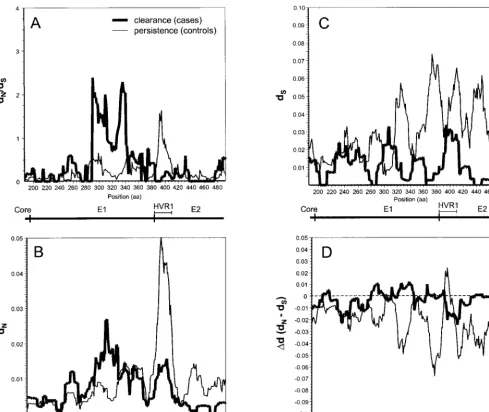
Segmental differences indN/dSratios.To test the hypothesis
that the regions under the greatest selective pressure differed between case and control subjects, we performed a high-reso-lution analysis of differences indN/dSratios by using VarPlot. We found generally low dN/dSratios as previously observed (50), with values of less than 1.0 throughout the envelope region studied. Two notable distortions in thedN/dSplots were observed: that in an E1 segment centered on amino acid 310 in sequences of the case subjects and that in a segment
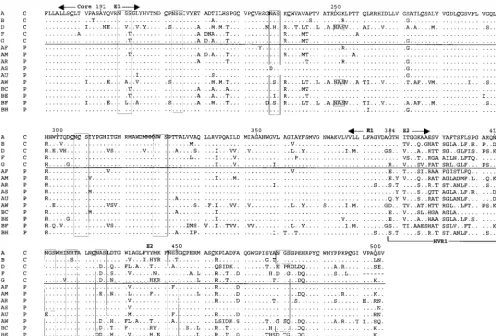
corre-FIG. 2. Alignment of inferred amino acid sequences for the majority sequences from each subject. In the first column, an alphabetical label is given for each subject, while in the second column, C indicates clearance of viremia and P indicates persistence. Periods indicate identity to the amino acid at that position in the first sequence. Positions of the Core and E1 and E2 regions are indicated above the alignment, whereas that of HVR1 is indicated below the alignment at the N terminus of E2. Boxes indicate predicted N-linked glycosylation sites. Cysteine residues in the first sequence are underlined.
on November 9, 2019 by guest
http://jvi.asm.org/
[image:4.612.57.553.75.410.2]sponding to HVR1 in sequences of the control subjects (Fig. 5A). These high-dN/dS-ratio segments corresponded to seg-ments of highdNvalues (Fig. 5B) and were not due to differ-ences indSvalues (Fig. 5C). Results of an analysis based on the
mous change in E1 was complemented by a similar correlation between persistence and nonsynonymous change in HVR1 (in E2), suggesting that HVR1 may act as an immunologic decoy during acute infection.
During acute infection, each individual develops a quasispe-cies, or swarm of highly related viral sequences. While this may involve random mutation with certain functional constraints, current evidence suggests a more directed process. In a longi-tudinal study of three subjects, HVR1 variation during the first 12 months of infection did not reveal a common pattern of increasing diversity within each sample, though later sequences did diverge from earlier ones, indicating the action of selective forces (33). The direction of these changes does not appear to be programmed by the viral sequence, because in a cohort of persons infected from the same homogeneous source, each developed a distinct quasispecies (36). While diversification may be dependent on the characteristics of the virus, selection is a function of the environment in which the virus replicates. Diversification does not ensure evolution. The genetic se-quences of HCV variants are very heterogeneous, varying by more than 30% across the entire genome among the six major genotypes, 20% among subtypes, and up to 10% within a subtype (50). Within a single infected individual, the diversity of viral variants varies greatly, depending on the stage of dis-ease and the genomic region assessed, but even in acute infec-tion it may be as high as 6% (58). This profound variability is generally attributed to the combination of three factors: an error-prone RNA-directed RNA polymerase, a high rate of viral replication, and persistent infection.
[image:5.612.136.469.540.699.2]Despite generating a large number of diverse progeny, a
FIG. 3. Comparison of the frequencies of amino acids in consensus se-quences for the 5 case subjects (group showing clearance) and the 10 control subjects (group showing persistence of viremia). A subscript indicates the num-ber of sequences having that residue at that position. Sites identified by using signature pattern analysis are displayed; for sites not shown, the most frequently observed amino acids (aa) did not differ between case subjects and control subjects. Positions are based on the work of Choo et al. (12). Also shown are the amino acids in these positions for 58 GenBank sequences spanning the same region.
FIG. 4. Virologic correlates of outcome. (A) Clonotype ratio, calculated as the ratio of the number of clonotypes detected to the number of cloned DNAs examined (Table 2), versus outcome. (B) E1dN/dSratio versus outcome. For each subject, all pairwise nonsynonymous and synonymous distances were calculated for the
E1-coding region. These distances were averaged, and thedN/dSratio was then calculated. Horizontal lines represent medians.
on November 9, 2019 by guest
quasispecies in a constant environment may not appear to evolve over time (51). This predicted equilibrium has been demonstrated in HCV-infected chimpanzees, in which ex-tremely limited change in the quasispecies was observed (5, 9, 32); the lack of genetic drift appears to correlate with weak immune responses in chimpanzees (54). Reduced evolution of the quasispecies has also been observed in immunocompro-mised humans (27, 40). Thus, the progressive change of the distribution of variants in a quasispecies requires an additional factor: selective pressure.
Sequence variation as a result of selection.We attempted to reduce the number of variables, particularly those that would lead to a bias suggesting selective pressure. We did this by controlling for duration of infection and for the genomic re-gion assessed and by separately examiningdNanddSvalues. Case and control subjects had similar durations of infection and concentrations of HCV RNA in sera (Table 1). Because sequence analysis was restricted to intrasample comparisons of the E1-E2 region, differential effects of RNA secondary
struc-ture (ondNand dS) and protein function (ondN) were mini-mized.
In addition, because results based ondN, thedN/dSratio, and
Dd(dNminus dS) led to the same conclusions, we have ad-dressed concerns regarding which indicator should have been used to indicate selective pressure. While many researchers have used the dN/dS ratio or Dd as surrogate indicators for immune pressure on RNA viruses (for example, see references 6, 43, and 60), there is disagreement over which calculation should be used and how to interpret the results (44). In pro-tein-coding regions, multiple forces affect the balance between fixation of silent (synonymous) mutations versus those that alter amino acid sequence (nonsynonymous). Synonymous changes are often thought to represent a “molecular clock,” independent of external pressures and expected to occur at a rate proportional to the organism’s reproductive rate, whereas nonsynonymous changes are selected by immune pressure. It may be difficult to interpret comparisons of values ofdN/dSor
Ddfor different genomic regions, due to unrecognized
differ-FIG. 5. Variability plots of the envelope region. For each subject, the intrasampledN/dSratio (A),dNvalue (B),dSvalue (C), orDdvalue (dN2dS) (D) was
calculated for overlapping windows of 20 amino acids (aa; 60 nucleotides), sliding in increments of 1 amino acid across E1 and the first 119 amino acids of E2. The mean values for each group (clearance or persistence) were then plotted. Positions are based on the work of Choo et al. (12).
on November 9, 2019 by guest
http://jvi.asm.org/
[image:6.612.62.551.72.484.2]ences in RNA secondary structures (restrictingdS) or protein functions (restricting dN). We controlled for these effects by comparing the same regions in different groups of individuals and by demonstrating the same findings for both the dN/dS ratio andDd.
Had we demonstrated a correlation between clearance of viremia and higherdN/dSratios for the entire region (E1 and 59 segment of E2) that we analyzed, we might simply have con-cluded that stronger antienvelope immune pressure was ad-vantageous for preventing persistent viremia. However,dN/dS ratios were similar among case subjects (those exhibiting clear-ance) and controls (those exhibiting persistence of viremia).
While we found that case subjects had higherdN/dSratios for E1 alone (Fig. 4A and 5A), controls exhibited a trend toward higher HVR1dN/dSratios (Fig. 5A). These reciprocal findings are compelling and may indicate segmental differences in the effects of selective pressure. The latter finding suggests that HVR1 can function as an immunologic decoy, stimulating a strong immune response that is ineffective for clearing viremia. A curious result shown in Fig. 5C is the trend, most pro-nounced in the control group, toward lowerdSvalues in the 59 portion of E1 than in a 39segment of E1 (just preceding E2) and E2. This trend has also been observed with a cohort of women who received HCV-contaminated anti-D immunoglob-ulin (36) and by cross-sectional analysis of complete genome sequences (50). LowerdSvalues may indicate that the 59 por-tion of E1 has some constraints on synonymous variapor-tion, such as RNA secondary structure or binding sites for factors that regulate replication or translation.
Potential limitations.The strength of our conclusions may be limited by the small size and heterogeneity of the cohort, by restricting our focus to a segment comprising approximately 10% of the viral genome, and by current methods for assessing HCV replication. However, we performed careful matching and followed up our subjects for a long period to ensure that clearance was durable. Although our results may not apply to all genotypes of HCV, because every subject in this study was
infected with genotype 1, heterogeneity among infecting vi-ruses may make our results more generally applicable than those from a single inoculum (36). We cannot exclude the possibility that our findings were due to interactions between mutations that we characterized and those that occurred in another genomic region.
By matching our case subjects and controls for similar du-rations of infection and finding similar concentdu-rations of HCV RNA in sera, we hoped to have limited differences between the two groups in viral replicative cycles. Figure 5C shows, how-ever, a trend toward higherdSvalues in E2 and a 39segment of E1 in the control (persistence) group. There is evidence to suggest that this trend (P.0.05) indicates that more replica-tive cycles occurred in the control group, namely, our finding of greater quasispecies complexity among controls and, from our study of a larger portion of the same cohort, an association between higher levels of HCV RNA in sera and persistent viremia (55). Therefore, despite early sampling (median, 3 months after seroconversion), the persistence group may al-ready have experienced more replicative cycles than the clear-ance group. If so, our conclusions would not have been af-fected, because of the reciprocal nature of our findings (as discussed in the preceding section): each group had highdN/dS ratios in different genome segments.
Artifactual substitutions and template resampling.Sequences generated from a quasispecies after PCR amplification may include errors due to nucleotide misincorporation as well as template resampling. Nucleotide misincorporation was esti-mated by calculating the rate of sporadic nonsynonymous sub-stitutions, which was remarkably similar to those of previous reports (36) and predictions (48). It is unlikely that nucleotide misincorporation substantially affected the results of this in-vestigation, since the rates of sporadic nonsynonymous substi-tutions were similar for case subjects and controls, who were examined by the same methods. In addition, the use of the sporadic substitution rate as an index of nucleotide misincor-poration overestimates this error because it also includes
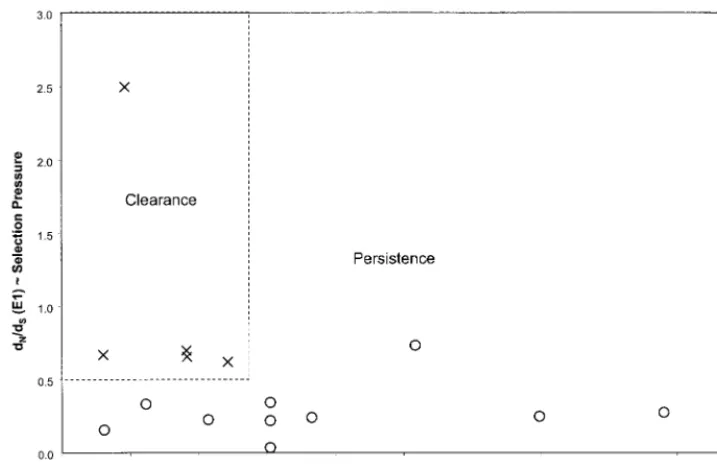
mu-FIG. 6. Ratio of nonsynonymous to synonymous distances versus clonotype ratio. Values from Fig. 4A and B were plotted on the same graph, and a box (dotted line) is drawn around the points representing values for the case subjects (with clearance of viremia).
on November 9, 2019 by guest
[image:7.612.124.483.72.305.2]tations genuinely present in the quasispecies but observed only once.
Template resampling may result in underestimation of qua-sispecies complexity when a small number of distinct genome templates is used in a PCR to generate sequence data. To evaluate the likelihood of resampling, the average number of distinct clones amongrsampled clones can be estimated by the equationN[12(121/N)r], whereNis the number of molecules used as PCR templates (31). The average and smallest num-bers of templates (N) in our study were 1,000 and 5, respec-tively, and the number of sampled clones (r) was 33. The estimated number of distinct templates among the 33 cloned cDNAs we examined was therefore 32 in the average sample and as low as 5 in the specimens with the lowest concentrations of RNA. Because we used our HDA1SSCP method to identify three to five distinct cloned cDNAs for sequencing, it is un-likely that the sequences analyzed were affected by resampling. In addition, because this source of error relates directly to the template numbers, which were similar between the two groups, the comparisons on which our conclusions were based were not affected. Our finding that there was no relationship between complexity and HCV RNA concentration supported these the-oretical considerations (data not shown).
Lack of power to detect differences in levels of viremia.The finding that the level of early viremia did not predict later clearance was probably due to the small number of subjects. As noted above, a larger study of the same cohort did demonstrate such a correlation (55). In cross-sectional studies, high-level viremia has also correlated with advanced liver disease (17) and failure of interferon therapy (29). Importantly, our current and previous findings (55) suggest that there is not a threshold of viremia above which persistent infection is a certainty.
Implications.Our results offer some new insights into the elusive mechanisms and parameters of HCV persistence. While previous studies have linked HCV diversity with persis-tent infection, the question of whether this diversity was the cause or the result of persistent infection could not be ad-dressed. In our cohort, higher quasispecies complexity was apparent within months of infection in those who developed persistent viremia. If abundant early replication is a major contributor to this higher complexity, then it may be possible to prevent persistence by using early measures to limit replication such as antiviral medications. In contrast, if segmental target-ing of the immune response is a major determinant of persis-tence, this may offer hope for an effective vaccine, because a vaccine that reduces replication may be more achievable for HCV than one that provides sterilizing immunity. A similar argument could be applied to occupational exposures and other situations of known acute HCV infection, such that ther-apy directed toward shifting immune specificity or limiting replication might not prevent infection but might alter its nat-ural history.
The proposed role of HVR1 as an immunologic decoy is not easily reconciled with prior evidence of an association between self-limited viremia and early expression of antibodies directed against HVR1 (25, 61). High-titer antibodies to HVR1 have been demonstrated to prevent HCV infection after in vitro neutralization, but protection was incomplete, possibly be-cause of a minor population of neutralization escape mutants (13). The role of a highly variable domain as a major immu-nologic target and neutralization determinant would be advan-tageous for HCV, like the putative role of the HIV-1 hyper-variable domains. The V1, V2, and V3 hyperhyper-variable loops of HIV-1 Env, which contain neutralization epitopes, may protect other more conserved neutralization epitopes (10) and deter-minants of coreceptor usage (19).
An additional finding was a higher positive charge in HVR1 among case subjects (who cleared viremia). While provocative, there is not sufficient information about an HCV receptor to place this finding in proper perspective. An association be-tween pathogenetic outcome and HVR1 charge is reminiscent of the link between positive charge in the HIV-1 V3 loop and disease progression (46). Because too little is known to suggest a biologically plausible role for HVR1 charge, this finding should be confirmed with a similar, independent cohort.
Using a well-characterized cohort, analysis of a large num-ber of HCV variants, and high-resolution analysis of nonsyn-onymous and synnonsyn-onymous substitutions, we were unable to identify an envelope sequence motif that predicts clearance or persistence of viremia. We did find differences between the two outcomes in quasispecies complexity and in the segmental pat-terns of selection pressure.
ACKNOWLEDGMENTS
This study was supported in part by National Institutes of Health grant IU19 AI-40035.
We thank the participants in the ALIVE and REACH cohorts for contributing the samples used in this study. J.R.T. thanks his Micro-biology Branch (DCLD, ODE, CDRH, FDA) colleagues for their support.
REFERENCES
1.Abe, K., G. Inchauspe, and K. Fujisawa.1992. Genomic characterization and mutation rate of hepatitis C virus isolated from a patient who contracted hepatitis during an epidemic of non-A, non-B hepatitis in Japan. J. Gen. Virol.73:2725–2729.
2.Alter, M. J., H. S. Margolis, K. Krawczynski, F. N. Judson, A. Mares, W. J. Alexander, P. Y. Hu, J. K. Miller, M. A. Gerber, R. E. Sampliner, E. Meeks, and M. J. Beach.1992. The natural history of community acquired hepatitis C in the United States. N. Engl. J. Med.327:1899–1905.
3.Anonymous.1997. Hepatitis C: global prevalence. Weekly Epidemiol. Rec. 72:341–348.
4.Bassett, S. E., K. M. Brasky, and R. E. Lanford.1998. Analysis of hepatitis C virus-inoculated chimpanzees reveals unexpected clinical profiles. J. Virol. 72:2589–2599.
5.Bassett, S. E., D. L. Thomas, K. M. Brasky, and R. E. Lanford.1999. Viral persistence, antibody to E1 and E2, and hypervariable region 1 sequence stability in hepatitis C virus-inoculated chimpanzees. J. Virol.73:1118–1126. 6.Bonhoeffer, S., E. C. Holmes, and M. A. Nowak.1995. Causes of HIV
diversity. Nature376:125.
7.Bradley, D. W., K. Krawczynski, J. W. Ebert, K. A. McCaustland, Q. L. Choo, M. A. Houghton, and G. Kuo.1990. Parenterally transmitted non-A, non-B hepatitis: virus-specific antibody response patterns in hepatitis C vi-rus-infected chimpanzees. Gastroenterology99:1054–1060.
8.Bukh, J., R. H. Purcell, and R. H. Miller.1993. At least 12 genotypes of hepatitis C virus predicted by sequence analysis of the putative E1 gene of isolates collected worldwide. Proc. Natl. Acad. Sci. USA90:8234–8238. 9.Bukh, J., M. Yanagi, S. U. Emerson, and R. H. Purcell.1998. Course of
infection and evolution of monoclonal hepatitis C virus (HCV) in chimpan-zees transfected with a cDNA clone of genotype 1a, abstr. 131. Presented at the Fifth International Meeting on Hepatitis C Virus and Related Viruses: Molecular Virology and Pathogenesis, 25–28 June 1998, Venice, Italy. 10. Cao, J., N. Sullivan, E. Desjardin, C. Parolin, J. Robinson, R. Wyatt, and J.
Sodroski.1997. Replication and neutralization of human immunodeficiency virus type 1 lacking the V1 and V2 variable loops of the gp120 envelope glycoprotein. J. Virol.71:9808–9812.
11. Reference deleted.
12. Choo, Q. L., K. H. Richman, J. H. Han, K. Berger, C. Lee, C. Dong, C. Gallegos, D. Coit, A. Medina-Selby, P. J. Barr, A. J. Weiner, D. W. Bradley, G. Kuo, and M. Houghton.1991. Genetic organization and diversity of the hepatitis C virus. Proc. Natl. Acad. Sci. USA88:2451–2455.
13. Farci, P., A. Shimoda, D. Wong, T. Cabezon, D. De Gioannis, A. Strazzera, Y. Shimizu, M. Shapiro, H. J. Alter, and R. H. Purcell.1996. Prevention of hepatitis C virus infection in chimpanzees by hyperimmune serum against the hypervariable region 1 of the envelope 2 protein. Proc. Natl. Acad. Sci. USA93:15394–15399.
14. Felsenstein, J.1985. Confidence limits on phylogenies: an approach using the bootstrap. Evolution39:783–791.
15. Felsenstein, J.1989. PHYLIP-phylogeny inference package (version 3.2). Cladistics5:164–166.
16. Garfein, R. S., M. C. Doherty, D. Brown, D. L. Thomas, S. A. Villano, E. Monterroso, and D. Vlahov.1998. Hepatitis C virus infection among short-term injection drug users. J. Acquired Immune Defic. Syndr.18:S11–S19.
on November 9, 2019 by guest
http://jvi.asm.org/
23. Kato, N., Y. Ootsuyama, T. Tanaka, M. Nakagawa, T. Nakazawa, K. Mu-raiso, S. Ohkoshi, M. Hijikata, and K. Shimotohno.1992. Marked sequence diversity in the putative envelope proteins of hepatitis C viruses. Virus Res. 22:107–123.
24. Kiyosawa, K., T. Sodeyama, E. Tanaka, Y. Gibo, K. Yoshizawa, Y. Nakano, S. Furuta, Y. Akahane, K. Nishioka, and R. H. Purcell.1990. Interrelation-ship of blood transfusion, non-A, non-B hepatitis and hepatocellular carci-noma: analysis by detection of antibody to hepatitis C virus. Hepatology 12:671–675.
25. Kobayashi, M., E. Tanaka, A. Matsumoto, T. Ichijo, and K. Kiyosawa.1997. Antibody response to E2/NS1 hepatitis C virus protein in patients with acute hepatitis C. J. Gastroenterol. Hepatol.12:73–76.
26. Korber, B., and G. Myers.1992. Signature pattern analysis: a method for assessing viral sequence relatedness. AIDS Res. Hum. Retroviruses8:1549– 1560.
27. Kumar, U., J. Monjardino, and H. C. Thomas.1994. Hypervariable region of hepatitis C virus envelope glycoprotein (E2/NS1) in an agammaglobulinemic patient. Gastroenterology106:1072–1075.
28. Kurosaki, M., N. Enomoto, F. Marumo, and C. Sato.1993. Rapid sequence variation in the hypervariable region of hepatitis C virus during the course of chronic infection. Hepatology18:1293–1299.
29. Lau, J. Y., G. L. Davis, J. Kniffen, K. P. Qian, M. S. Urdea, C. S. Chan, M. Mizokami, P. D. Neuwald, and J. C. Wilber.1993. Significance of serum hepatitis C virus RNA levels in chronic hepatitis C. Lancet341:1501–1504. 30. Lechmann, M., H. G. Ihlenfeldt, I. Braunschweiger, G. Giers, G. Jung, B. Matz, R. Kaiser, T. Sauerbruch, and U. Spengler.1996. T- and B-cell responses to different hepatitis C virus antigens in patients with chronic hepatitis C infection and in healthy anti-hepatitis C virus-positive blood donors without viremia. Hepatology24:790–795.
31. Liu, S. L., A. G. Rodrigo, R. Shankarappa, G. H. Learn, L. Hsu, O. Davidov, L. P. Zhao, and J. I. Mullins.1996. HIV quasispecies and resampling. Science273:415–416.
32. Major, M. E., K. Mihalik, A. A. Kolykhalov, D. Kleiner, C. M. Rice, and S. M. Feinstone.1998. Long term follow-up of chimpanzees inoculated with the first HCV infectious clone: immune responses, disease progression, and sequence evolution, abstr. 27. Presented at the Fifth International Meeting on Hepatitis C Virus and Related Viruses: Molecular Virology and Patho-genesis, 25–28 June 1998, Venice, Italy.
33. Manzin, A., L. Solforosi, E. Petrelli, G. Macarri, G. Tosone, M. Piazza, and M. Clementi.1998. Evolution of hypervariable region 1 of hepatitis C virus in primary infection. J. Virol.72:6271–6276.
34. Martell, M., J. I. Esteban, J. Quer, J. Genesca, A. Weiner, R. Esteban, J. Guardia, and J. Gomez.1992. Hepatitis C virus (HCV) circulates as a population of different but closely related genomes: quasispecies nature of HCV genome distribution. J. Virol.66:3225–3229.
35. Mattsson, L., A. Sonnerborg, and O. Weiland.1993. Outcome of acute symptomatic non-A, non-B hepatitis: a 13-year follow-up study of hepatitis C virus markers. Liver13:274–278.
36. McAllister, J., C. Casino, F. Davidson, J. Power, E. Lawlor, P. L. Yap, P. Simmonds, and D. B. Smith.1998. Long-term evolution of the hypervariable region of hepatitis C virus in a common-source-infected cohort. J. Virol. 72:4893–4905.
37. Missale, G., R. Bertoni, V. Lamonaca, A. Valli, M. Massari, C. Mori, M. G. Rumi, M. Houghton, F. Fiaccadori, and C. Ferrari.1996. Different clinical behaviors of acute hepatitis C virus infection are associated with different vigor of the anti-viral cell-mediated immune response. J. Clin. Investig. 98:706–714.
38. Nei, M., and T. Gojobori.1986. Simple methods for estimating the numbers of synonymous and nonsynonymous nucleotide substitutions. Mol. Biol. Evol.3:418–426.
roviruses12:1681–1685.
45. Roth, W. K., J. H. Lee, B. Ru¨ster, and S. Zeuzem.1996. Comparison of two quantitative hepatitis C virus reverse transcriptase PCR assays. J. Clin. Mi-crobiol.34:261–264.
46. Shankarappa, R., P. Gupta, G. H. J. Learn, A. G. Rodrigo, C. R. J. Rinaldo, M. C. Gorry, J. I. Mullins, P. L. Nara, and G. D. Ehrlich.1998. Evolution of human immunodeficiency virus type 1 envelope sequences in infected indi-viduals with differing disease progression profiles. Virology241:251–259. 47. Simmonds, P., P. Balfe, C. A. Ludlam, J. O. Bishop, and A. J. Brown.1990.
Analysis of sequence diversity in hypervariable regions of the external gly-coprotein of human immunodeficiency virus type 1. J. Virol.64:5840–5850. 48. Smith, D. B., J. McAllister, C. Casino, and P. Simmonds. 1997. Virus ‘quasispecies’: making a mountain out of a molehill? J. Gen. Virol.78:1511– 1519.
49. Smith, D. B., S. Pathirana, F. Davidson, E. Lawlor, J. Power, P. L. Yap, and P. Simmonds.1997. The origin of hepatitis C virus genotypes. J. Gen. Virol. 78:321–328.
50. Smith, D. B., and P. Simmonds.1997. Characteristics of nucleotide substi-tution in the hepatitis C virus genome: constraints on sequence change in coding regions at both ends of the genome. J. Mol. Evol.45:238–246. 51. Steinhauer, D. A., and J. J. Holland.1987. Rapid evolution of RNA viruses.
Annu. Rev. Microbiol.41:409–433.
52. Thomas, D. L., J. Z. Zenilman, H. J. Alter, J. W. Shih, N. Galai, and T. C. Quinn.1995. Sexual transmission of hepatitis C virus among patients attend-ing Baltimore sexually transmitted diseases clinics—an analysis of 309 sexual partnerships. J. Infect. Dis.171:768–775.
53. Tong, M. J., N. S. El-Farra, A. R. Reikes, and R. L. Co.1995. Clinical outcomes after transfusion-associated hepatitis C. N. Engl. J. Med.332: 1463–1466.
54. van Doorn, L. J., I. Capriles, G. Maertens, R. DeLeys, K. Murray, T. Kos, H. Schellekens, and W. Quint.1995. Sequence evolution of the hypervariable region in the putative envelope region E2/NS1 of hepatitis C virus is corre-lated with specific humoral immune responses. J. Virol.69:773–778. 55. Villano, S. A., D. Vlahov, K. E. Nelson, S. Cohn, and D. L. Thomas.1999.
Persistence of viremia and the importance of long-term follow-up after acute hepatitis C infection. Hepatology29:908–914.
56. Villano, S. A., D. Vlahov, K. E. Nelson, C. M. Lyles, S. Cohn, and D. L. Thomas.1997. Incidence and risk factors for hepatitis C among injection drug users in Baltimore, Maryland. J. Clin. Microbiol.35:3274–3277. 57. Vlahov, D., J. C. Anthony, A. Mun˜oz, J. Margolik, D. D. Celentano, L.
Solomon, and B. F. Polk.1991. The ALIVE Study: a longitudinal study of HIV-1 infection in intravenous drug users: description of methods. J. Drug Issues21:759–776.
58. Wang, Y., S. C. Ray, O. Laeyendecker, J. R. Ticehurst, and D. L. Thomas. 1998. Assessment of hepatitis C virus sequence complexity by the electro-phoretic mobility of both single- and double-stranded DNA. J. Clin. Micro-biol.36:2982–2989.
59. Weiner, A. J., H. M. Geysen, C. Christopherson, J. E. Hall, T. J. Mason, G. Saracco, F. Bonino, K. Crawford, C. D. Marion, K. A. Crawford, et al.1992. Evidence for immune selection of hepatitis C virus (HCV) putative envelope glycoprotein variants: potential role in chronic HCV infections. Proc. Natl. Acad. Sci. USA89:3468–3472.
60. Zhang, L., R. S. Diaz, D. D. Ho, J. W. Mosley, M. P. Busch, and A. Mayer. 1997. Host-specific driving force in human immunodeficiency virus type 1 evolution in vivo. J. Virol.71:2555–2561.
61. Zibert, A., H. Meisel, W. Kraas, A. Schulz, G. Jung, and M. Roggendorf. 1997. Early antibody response against hypervariable region 1 is associated with acute self-limiting infections of hepatitis C virus. Hepatology25:1245– 1249.