“
ANALYSIS OF DEVELOPMENT OF INDEX LEFT
VENTRICULAR SYSTOLIC DYSFUNCTION AFTER
REVASCULARIZATION IN ACUTE ST ELEVATION
MYOCARDIAL INFARCTION
”
DISSERTATION SUBMITTED IN PARTIAL FULFILLMENT OF THE
REGULATIONS FOR THE
AWARD OF DM IN CARDIOLOGY
DEPARTMENT OF CARDIOLOGY
PSG INSTITIUTE OF MEDICAL SCIENCES AND RESEASRCH
THE TAMILNADU Dr. M.G.R MEDICAL UNIVERSITY, CHENNAI
AUGUST 2014
CERTIFICATE
PSG Institute of Medical Sciences & Research
Coimbatore
This is to certify that
Dr. PRANAV KUMAR K.V
has prepared this dissertation
entitled
“ANALYSIS
OF
DEVELOPMENT
OF
INDEX
LEFT
VENTRICULAR
SYSTOLIC
DYSFUNCTION
AFTER
REVASCULARIZATION IN ACUTE ST ELEVATION MYOCARDIAL
INFARCTION”
, under my overall supervision and guidance in PSG Institute of
Medical Science and Research, Coimbatore in partial fulfillment of the regulations
of The Tamil Nadu Dr. M.G.R Medical University for the award of DM
Cardiology.
DR.G.RAJENDIRAN MD, DM.,
DR.S. RAMALINGAM MD.,
Professor and Head of the Department
Principal
Department of Cardiology
PSG IMS & R
PSG IMS & R
Place: Coimbatore
DECLARATION
I hereby declare that dissertation entitled
“ANALYSIS OF DEVELOPMENT
OF INDEX LEFT VENTRICULAR SYSTOLIC DYSFUNCTION AFTER
REVASCULARIZATION IN ACUTE ST ELEVATION MYOCARDIAL
INFARCTION”
was prepared by me under the guidance and supervision of
Dr.
G.Rajendiran MD, DM,
PSG IMS&R, Coimbatore. The dissertation is submitted
to The Tamil Nadu Dr. M.G.R. Medical University, Chennai in partial fulfillment
of the University Regulations for the award of DM degree in Cardiology. This
ACKNOWLEDGEMENT
With deep sense of gratitude, I sincerely express my thanks to Dr. G.Rajendiran, Professor and
Head, Department of Cardiology, PSG Institute of Medical Sciences & Research, Coimbatore,
for his valuable guidance and encouragement given at every stage of this project. I would also
express my sincere thanks to Dr.J.S.Bhuvaneswaran, Dr.P.Arun Kumar, Dr.R.Shanmuga
Sundharam, Dr.P.Ramasamy, Dr.K.Tamilarasu and Dr.M.Lawrence Jesuraj for guiding me
in this study.
I am extremely thankful to all the staff who have spent their time for the collection of data and
have also helped me in successful completion of this project.
I especially thank Mrs. Lakshmi who extensively helped me in collecting and recording the
data.
1 thanks my beloved parents and my wife for the confidence and encouragement given by them
in doing this project. I thank all my friends for all the help they extended to me during my work
for the project.
Lastly, I thank God for the wonderful team who helped me in completion of my project.
CONTENTS
S.NO CONTENTS PAGE NO
1 INTRODUCTION 1
2 AIMS AND OBJECTIVES 4
3 REVIEW OF LITERATURE 5
4 MATERIALS AND METHODS 28
5 RESULTS 34
6 DISCUSSION 44
7 LIMITATIONS 49
8 CONCLUSION 50
9 BIBLIOGRAPHY 52
10 ANNEXURE I 57
ABSTRACT
Introduction
Myocardial infarction is the most cause of heart failure. The incidence of heart failure
after MI has been reported as high as 23% in various studies. Characteristics of patients in India
who develop heart failure after a myocardial infarction are less well studied. Though presence of
higher incidence of reduced LV function with delay in revascularization time is established, rates
of reduced LV function after different modes of revascularization and correlation with coronary
artery lesion is not well established.
Aim and Objectives
To study the incidence of left ventricular dysfunction after the initial episode of
myocardial infarction and to determine the difference in rates of development of LV dysfunction
depending on time to perform revascularization and based on mode of revascularization and to
correlate the development of LV dysfunction with the coronary artery lesion as determined by
coronary angiogram.
Methodology
93 patients admitted in PSG Hospital from 1st March 2013 to 31st December 2013 with a
diagnosis of Acute ST Elevation Myocardial Infarction and undergoing reperfusion therapy with
either streptokinase or by percutaneous coronary intervention were included. Window period and
door to needle/door to balloon time are recorded. Left ventricular ejection fraction, as determined
by volumetric method, is measured within first 24 hours and on day 5 by a single person to avoid
interpersonal variation. Development of heart failure based on Framingham criteria is noted. Use
Results
Out of 93 patients included in the study, 32 underwent primary PCI and 61 underwent
thrombolysis. Patients with longer reperfusion time showed a significant reduction in LV
ejection fraction. Patients retaining a normal ejection fraction when reperfusion times are
between 0-3, 3-6, 6-12 and more than 12 were 70%, 59%, 32% and 0 respectively. Patients who
underwent primary PCI had more chance of a preserved LVEF compared to those who
underwent thrombolysis (82% Vs 44%. p=0.013). Patients with anterior wall STEMI had less
number of patients with normal LVEF when reperfusion times were between 3 to 6 hours (41%
Vs 93%. p=0.001) compared to non-anterior wall STEMI patients. No significant associations
were found between age, presence of diabetes and the number of vessels involved to LVEF.
Conclusion
Longer reperfusion times are associated with significant reduction in LVEF. Primary PCI
leads to better outcome in patients presenting between 3-6 hours when compared with
thrombolysis. AW STEMI patients develop significant reduction in LVEF at 3-6 hours compared
INTRODUCTION
Coronary artery disease (CAD) is a major cause of death and disability in developed and
developing countries. As of 2012, CAD is the most common cause of death in the world [1] and
also the major cause of hospital admissions [2]. Though high-income countries are seeing a fall in
the incidence of CAD, low- and middle-income countries are seeing a very alarming increase in
the rates of CAD, and this change is accelerating. In 2001, 75% of all global deaths and 82% of
total DALYs (Disability Adjusted Life Years) lost due coronary artery disease occurred in low-
and middle-income countries [3].
Mortality from coronary artery disease is expected to increase in developing countries
(including India, China, Middle East, sub-Saharan Africa and Latin America), from an estimated
9 million in the year 1990 to a projected 19 million by the year 2020 [4]. It is thought that this
projected increase is a consequence of social and economic changes in non-Western countries,
which has led to an increased life expectancy, physical inactivity, changing/westernized diets,
and an increase in cigarette smoking in these countries [5].
Coronary artery disease affects people at a much younger age in low- and middle-income
countries compared to high-income countries. This leads to a greater economic impact on low-
and middle-income countries. Effective screening, evaluation, and management strategies for
coronary artery disease are well established in developed countries, but these strategies have not
been fully implemented in developing countries like India.
Heart failure is the most common complication of coronary artery disease including ST
elevation myocardial infarction (STEMI). Coronary artery disease accounts for 50% to 70% of
heart failure. Overall Population Attributable Risk was 62 percent with 68 percent in men and 56
percent in women.
The increasing prevalence of heart failure in the world is in part due to the improved
survival after myocardial infarction, successful prevention of sudden cardiac deaths and the
ageing population. In the Framingham Heart Study, the prevalence of HF in men was 8 per 1000
at age 50 to 59 years and increased to 66 per 1000 at ages 80 to 89 years. There are an estimated
23 million people with HF worldwide [9]. Heart failure is a major cause of sick leaves, early
retirement, hospitalizations and rising health care costs throughout the world.
Despite improvements in therapy of heart failure, the mortality and morbidity rates in
patients with HF has remained unacceptably high. Continued efforts are therefore necessary to
reduce the incidence of HF. One of the most important variables involved in the incidence of
heart failure after a myocardial infarction is the time to reperfusion. Reducing the time to
reperfusion, which is assessed by door-to-balloon or door-to-needle time and
symptom-to-balloon or symptom-to-needle time is therefore crucial in improving myocardial salvage and
preventing heart failure.
Door-to-balloon or door-to-needle time is mostly determined by organizational factors
including presentation within regular working hours, rapid diagnosis, activation of
catheterization laboratory both during working hours and non-working hours.
Symptom-to-balloon or symptom-to-needle time is mainly dependent on patient factors. Current 2013 ACC
guidelines give a value of 30 minutes for door-to-needle time and 90 minutes for door-to-balloon
However, the times given in guidelines are most often impossible to achieve in the
current Indian hospital setting due to many factors including poor awareness among the
population about the symptoms of myocardial infarction, lack of rapid transportation/ambulance
facilities, shortage of trained staff in hospitals and lack of catheterization laboratories except in
tertiary care centers.
Reduction in the time to reperfusion has not only shown to reduce the mortality due to
myocardial infarction but several studies have also shown that it can reduce the incidence of
heart failure after myocardial infarction. The difference in incidence of heart failure among
patients who undergo percutaneous intervention and those who undergo thrombolysis is less well
established. Also, the relationship of other variables like age, sex and presence of risk factors and
their association with the incidence of reduced LVEF and heart failure after myocardial
AIMS AND OBJECTIVES
To determine the incidence of reduced left ventricular ejection fraction after acute
STEMI in patients undergoing reperfusion.
To analyze the characteristics of patients developing reduced left ventricular ejection
fraction and heart failure with respect to time from onset of symptoms to start of therapy,
presence of risk factors and number of coronary vessels involved.
To analyze if there is any difference in incidence of reduced left ventricular function
REVIEW OF LITERATURE
History of Coronary Artery Disease
Death from coronary artery disease was relatively rare before 1900. The industrial
revolution and the present day modern comfort are believed to have contributed significantly to
the rise of coronary artery disease. Leonardo da Vinci is among the earliest scientists
documented to have studied coronary arteries and their purpose. In 1628, an English doctor,
William Harvey, described the circulation of blood. In the 1700s, cardiologist Friedrich
Hoffmann established the link between coronary artery disease and decreased blood flow
through the coronary arteries.
In 1768, William Heberden, an English physician, published his observations about the
relationship of ischemic heart disease and coronary vascular anatomy. Since then, up to 19th
century the disease was called the „Heberden‟s disease‟. In 1879, Ludwig Hekben, by his studies
concluded that myocardial infarction was due to coronary obstruction which was secondary to
thrombosis.William Osler played a large role studying angina and giving an accurate description
of the coronary vessels. James Herrick is credited with coining the phrase "heart attack."
According to Cournand, the first catheterization was done by Claude Bernard in 1844 in a
horse. In 1929, Werner Forssmann conducted the first coronary heart catheterization on himself.
Forssmann, a urologist, while working on his experiments introduced a catheter into his jugular
vein and took an X-ray and found it to be inside the right atrium. This groundbreaking work
sparked other advances in this field and by the 1950s physicians were developing angiography,
In 1941, André Cournand and Dickinson Richards successfully repeated the trial of
Forssmann. With their repeated attempts and experiments, they were finally able to push the
catheter into right ventricle and take right ventricular angiograms. In 1950‟s the forthcoming
experiments by them were a milestone in history towards the present day cardiac interventions.
Coronary arteriography and ventriculography became the gold standard for studying the
cardiac and vessel anatomy and left ventricular pump function. They gave valuable information
which made the way for surgical treatment for coronary revascularizations. Dotter, Judkins and
Andreas Gruntzig conducted many experiments which led to the advances in invasive
cardiology.
The first coronary bypass surgery was done in Cleveland Clinic in 1967. Dr. Rene
Favaloro was the pioneer of the open-heart techniques, which involved the removal of a vein
from one part of a patient‟s body and using it to connect the aorta and coronary arteries, creating
a "bypass" around blocked coronary arteries. Dr. Andreas Gruentzig performed the first coronary
angioplasty in 1977 in Switzerland. Dr. Gruentzig inserted a catheter into a coronary artery that
was blocked and inflated a tiny balloon made at his kitchen table and compressed the buildup of
plaque against the walls of the artery according to The Society for Cardiovascular Angiography
and Interventions.
1986 saw the development of tiny metal stents that serve to prop open the artery and keep
it from closing again after balloon angioplasty. Need for invasive, higher-risk surgeries was
reduced due to the usage of stents which became commonplace. By 2002, more than 2 million
coronary angioplasties were performed annually across the globe and drug eluting stents were
Definition of Myocardial Infarction
The definition of myocardial infarction is given by ESC/ACCF/AHA/WHF Task Force
Classification of Myocardial Infarction
This is also given by ESC/ACCF/AHA/WHF Task Force for the Universal Definition of
Myocardial Infarction.
Epidemiology
Global Trends in Cardiovascular Disease
85% of the world‟s population lives in low and middle-income countries. Cerebro
vascular disease (CVD) incidence rates in these countries largely accounts for global rates of
CVD. Though CVD rates are falling in high-income countries, CVD rates worldwide are
phases of the epidemiologic transition, featured by rising CVD rates. CVD will be the dominant
factor in economic impact of chronic diseases. Countries such as China, India, and Russia would
be spending between $200 and $550 billion in national income as a result of heart disease,
stroke, and diabetes [9].
In 1990, CVD accounted for 28% of the 50.4 million deaths worldwide and 9.8% of the
1.4 billion lost DALYs. By 2030, WHO predicts that worldwide, CVD will be responsible for
nearly 24 million deaths. Of these CAD will cause 14.9% deaths in men and 13.1% deaths in
women and stroke will be the cause of 10.4% of deaths in men and 11.8% of deaths in women.
Prevalence of CAD in India
In India, coronary artery disease rates have increased during the last 30 years in contrast
to declining trends that have been noticed in developed Western countries. The high prevalence
of CAD in Indians came to light after the detection of increased incidence of CAD and MI in
Indians living abroad. More than 20 million Indians live abroad and nearly 1.7 million of them in
the USA. The Kaiser study [10] showed a prevalence of CAD in Indians in the US to be nearly 3
to 4 times than that of the American population, 6 times higher than Chinese population [17] and
20 times higher than the Japanese [16]. Indians develop heart disease 10 years earlier than other
populations.
The prevalence of CAD in North India has increased from 1% in 1960 to 10.5% in
1998[12] and that in south India is 11% to 14.3% [13], slightly more than in north India and in
Indians in the US. A study from Calicut Medical College in Kerala [15] showed that first heart
According to the WHO, in 1990 nearly 1.2 million died from heart disease and by 2020,
100 million Indians will have CAD (nearly 25% of world‟s CAD patients). Hence India is set to
become the „CAD capital of the world‟ as well, in addition to Diabetes and sooner still the
Hypertension capital of the world as 1 in 5 people in Chennai have been found to be
hypertensive.
CAD occurs equally in both vegetarians and non-vegetarians. The prevalence of CAD in
urban population is twice that in rural population though smoking is more prevalent in the rural
Special Features of CAD in Indians
Many studies came upon some salient features of coronary artery disease epidemic
among Indians [15] [18] [19] [20]
India led the world with 1,531,534 cardiovascular disease related deaths in 2002
Median age of first heart attack is 53 years in Indians compared to 63 in other groups
Incidence of CAD in young Indians is about 12%–16%, which is the highest among any
other ethnic group
About 5%–10% of heart attacks occur in Indian men and women younger than 40 years
Left main and triple vessel disease is twice as common than in whites not only in males
but also in females
Pre-hospital cardiac arrest is more common than in other ethnic groups.
Risk Factors for CAD in Indians
Indians have a higher prevalence of CAD in presence of low cardiac risk factors like
obesity, smoking, cholesterol and hypertension as was seen in the CADI study. This feature has
been called the Indian paradox. Other factors like DM, physical inactivity, low HDL levels are
more prevalent in Indians. A number of other risk factors like lipoprotein (a), metabolic
syndrome, homocysteine, fibrinogen, C-reactive protein (CRP) are also more common in the
Indians [28].
If any three of the conventional risk factors are present the risk of CAD increases 13 fold,
genetically inherited and makes Indians more susceptible to heart disease at a young age. It
amplifies the effect of high LDL and low HDL cholesterol, and hastens atherosclerosis.
High homocysteine levels occur with improper diet and cooking methods. High levels of
CRP are associated with abdominal obesity and sedentary life. Diabetes is 2-4 times more
common among Indians than other ethnic groups [24]. Incidence of diabetes mellitus has doubled
in the rural population and tripled in urban population over the past three decades. Indians
develop diabetes mellitus earlier (10- 15 years) and at a lower body weight (9.1 to 13.6 kg) than
other ethnic groups.
Between 2000 and 2030, diabetic population in India is projected to go up from 32
million to 79 million. Diabetes mellitus and CAD are inextricably intertwined [24]; one causes the
other within 10 to 20 yrs. The incidence of CAD among diabetics is 14-times higher in those
below 45 years and 2-3 times more in those older.
Use of stricter Asia Pacific Criteria for abdominal obesity resulted in a 50% increase in
prevalence of metabolic syndrome from 22% to 32% in Indian men and from 20% to 29% in
Indian women in Singapore [23]. Metabolic syndrome is typically associated with atherogenic
phenotype B characterized by hypertriglyceridemia, low HDL-C, high small dense LDL, high
apolipoprotein B and low apolipoprotein A-1. This explains the very high risk of CAD in
metabolic syndrome.
About 20% of diabetics do not have metabolic syndrome and have a greatly reduced risk
of CAD. Conversely, people with metabolic syndrome have a substantially increased risk of
CURES study by Mohan et al [21] clearly shows every fifth individual is hypertensive in
Chennai which is equal to or greater than the incidence of diabetes. Prevalence of hypertension
in the study population was 20%, (23.2% in men and 17.1% in women). Even in the young
(20-29 years), the incidence of hypertension was 3.8% in men and 3.1% in women. At the age of >60
years the incidence was 50.8% in men and 51% in women. The number of people with
hypertension may overtake diabetics in our subcontinent.
INTERHEART study [20] was done by Yusuf et al in 2004 showed that the risk factors
among Indians to be slightly different from other ethnic groups. It showed hypertension (OR
2.89), diabetes (OR 2.48) and abdominal obesity (OR 2.43) had more severe effects in South
Asia, whereas psychosocial factors had a lesser OR of 2.15, compared with 2.67 worldwide. It
also showed hypertension and diabetes were more important risk factors in younger women than
men in India. Factors peculiar to the South Asian population such as truncal obesity, high TGL
and low HDL-C were also found.
North Indians manifest coronary artery disease at lower levels of total cholesterol than
South Indians. Lower HDL-C and higher TGL levels in both younger and older coronary artery
disease patients appear to be a hallmark of the Indian population. There was also a greater
association of smoking with CAD in younger individuals especially young men than young
women. Prevalence of smoking in South Indian males (44.6%) and the prevalence of passive
smoking in South Indian females (45.3%) has been found out to be significantly higher than in
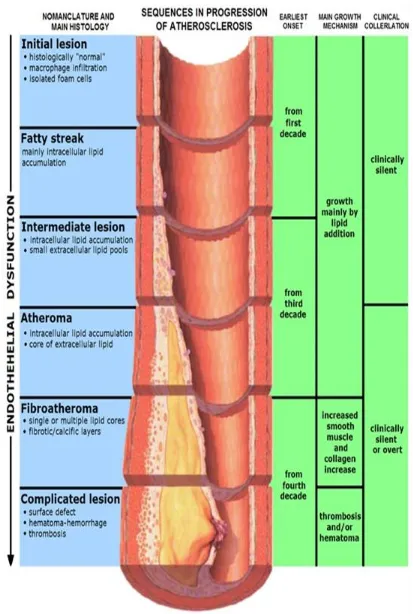
Process of Atherosclerosis
Atherosclerosis is a process that starts soon after birth as soon as the infant starts feeding
diet that contains fat. Low-density lipoprotein (LDL) particles begin adhering to the vessel wall
and accumulating in the intima. These get oxidized and become oxidized LDL. These oxidized
lipoprotein particles releases cytokines which attracts the monocytes. The next process starts
with the adherence of circulating blood monocytes to the endothelium. This is favored by the
expression of molecules like vascular cell adhesion molecule 1 (VCAM-1), intercellular
adhesion molecule 1 (ICAM-1) and selectins (includes both E-Selectin and P-Selectin).
These monocytes then start to migrate to the subendothelial space and start accumulating.
This process is mediated by the action of protein molecules known as chemoattractant cytokines
or chemokines like monocyte chemoattractant protein 1 (MCP-1), Interleukin-8 (CXCL8),
Interferon-γ, etc. These monocytes take up the lipids present in the intima and become a foam
cell or lipid-laden macrophage. These foam cells start to replicate due to the presence of
macrophage colony-stimulating factor (M-CSF).
The macrophage foam cells which are present in the artery wall serve not only as a
reservoir for excess lipid but also as a source of proinflammatory mediators like cytokines and
chemokines and various eicosanoids and lipids such as platelet-activating factor. They also serve
as a source of large quantities of oxidant species. These processes constitute the innate immunity
which is an amplification of inflammation without the presence of an antigen. Dendritic cells in
atherosclerotic lesions can present antigens to the T cells. These antigens include modified
Figure 1: Pathogenesis of atherosclerosis
[image:24.612.105.512.447.684.2]The next process involves the smooth muscle cells (SMCs). These smooth muscle cells
migrate from the tunica media to the tunica intima. This process is facilitated by the presence of
factors like platelet derived growth factor (PDGF). There is proliferation of smooth muscle cells
in the intima. These SMCs in the atherosclerotic intima also exhibit a less mature phenotype than
the quiescent SMCs in the normal arterial medial layer. This SMC replication causes the
formation of a fibrous capsule covering the fatty streak.
Extracellular matrix itself makes up much of the volume of an advanced atherosclerotic
plaque. The majority of extracellular matrix macromolecules that accumulate in atheroma
include interstitial collagen type I, collagen type III, proteoglycans such as versican, biglycan,
aggrecan, decorin and elastins. These macromolecules are broken down by matrix
metalloproteinases (MMPs). Dissolution of extracellular matrix macromolecules will lead to
migration of SMCs as they migrate into the tunica intima from the media through a dense
extracellular matrix and the internal elastic lamina. Overexpression of proteinase inhibitors
(known as tissue inhibitors of metalloproteinases, or TIMPs) can delay SMC accumulation in the
intima of a plaque [26].
Atheroscerotic plaques develop their own microcirculation which is mediated by vascular
endothelial growth factor (VEGF) and placental growth factor (PlGF). The abundant
microvessels in plaques will lead to a relatively large surface area through which leukocytes will
migrate into the plaque. Some plaques can become calcified due to deposition of calcium.
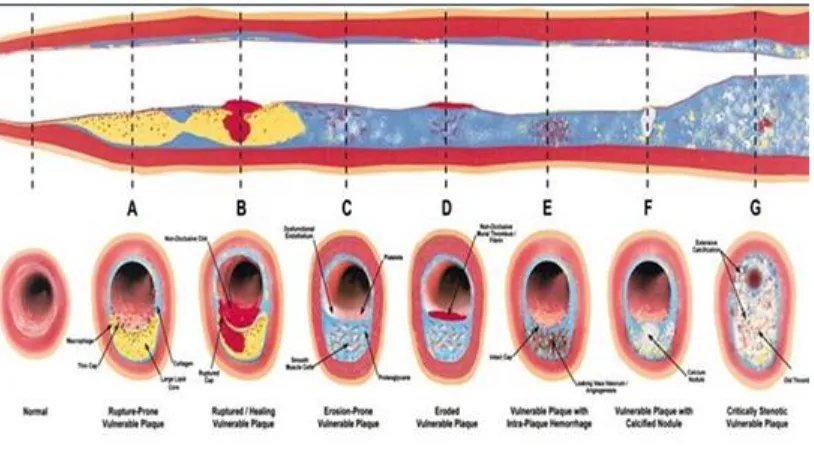
As time goes on, enzymatic degradation can cause erosion of the fibrous cap. The
endothelial cap separating the plaque and blood flow becomes thin and fragile. Rupture of the
by the smooth muscle cells leading to rupture of the cap. This causes spilling of highly
atherogenic plaque contents into blood stream which triggers the formation of thrombus.
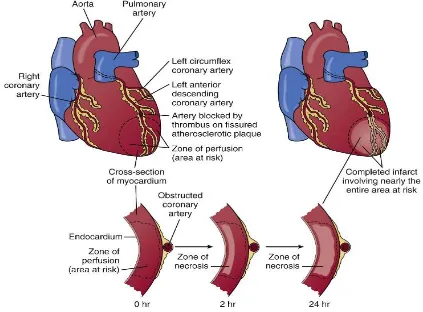
Pathophysiology of Myocardial Infarction
Plaque disruption leads to exposure of highly atherogenic plaque content to blood stream which
leads to formation of a thrombus. Occlusion of the entire vessel will lead to ST elevation
myocardial infarction. This transmural injury and infarction leads to change in the sequence of
depolarization producing the characteristic ECG changes. Size of the infarct depends largely on
the magnitude of coronary collateral flow which if present may minimize the area of infarction.
[image:27.612.91.514.401.713.2]The location of infarct depends on the vessel that is involved.
As time progresses, certain characteristic changes take place in the infarcted zone of the
heart. The various gross changes and histological changes are given below
Time Gross Examination Histopathology
0 - 0.5 hours None None
0.5 – 4 hours None Glycogen Depletion, as seen with a PAS
Stain
Possibly waviness of fibers at border
4 – 12 hours Sometimes dark mottling Initiation of coagulation necrosis
Edema Hemorrhage
12 – 24 hours Dark mottling Ongoing coagulation necrosis
Karyopyknosis
Hypereosinophilia of myocytes Contraction band necrosis in margins Beginning of neutrophil infiltration
1 – 3 days Infarct center becomes yellow-tan Continued coagulation necrosis
Loss of nuclei and striations
Increased infiltration of neutrophils to interstitium
3 – 7 days Hyperemia at border
Softening yellow-tan center
Beginning of disintegration of dead muscle fibers
Necrosis of neutrophils
Beginning of macrophage removal of dead cells at border
7 – 10 days Maximally soft and yellow-tan
Red-tan margins
Increased phagocytosis of dead cells at border
Beginning of granulation tissue formation at margins
10 – 34 days Red-gray and depressed borders Mature granulation tissue with type I
collagen
2 – 8 weeks Gray-white granulation tissue Increased collagen deposition
Decreased cellularity
More than 2 months Completed scarring Dense collagenous scar formed
Pathophysiology of Myocardial Infarction
LV Function
Interruption of antegrade flow in a coronary vessel leads to abnormal or loss of
contractile function in the myocardium that is supplied by that vessel. Four abnormal patterns of
the affected myocardium and surrounding myocardium. Hypokinesis is reduction in the length of
shortening. Akinesis is cessation of shortening. Dyskinesis causes paradoxical expansion and
bulging. There is hyperkinesis of the surrounding myocardium to maintain the cardiac output but
it subsides within two weeks.
If a large portion of the left ventricular myocardium is involved, LV pump action
becomes decreased leading to low cardiac output and stroke volume, reduced blood pressure and
elevated end systolic volume. Initially, the LV dilates as necrotic myocytes slip past each other.
The infarct zone thins and elongates leading to infarct expansion. Later fibrous tissue is formed
which leads to increased stiffness of the myocardium.
Left ventricular function is reduced when more than 15% of the myocardium is involved.
Clinical signs of heart failure develop at 25% and cardiogenic shock occurs at 40%. Diastolic
dysfunction also occurs in MI as a result of decrease in the peak rate of decline in LV pressure,
an increase in the time for the fall in LV pressure, and an initial rise in LV end-diastolic pressure.
LV Remodeling
As a consequence of myocardial infarction, certain changes take place in the size, shape
and thickness of the infarcted and the non-infarcted myocardium. These are called Ventricular
Remodeling. Other than the size of infarct, there are two other major factors which determine the
process of remodeling. First is the elevated ventricular pressure which leads to increased wall
stress and infarct expansion. Other is the patency of the infarct artery which can accelerate scar
formation and prevent remodeling.
Infarct expansion is defined as “acute dilation and thinning of the area of infarction not
explained by additional myocardial necrosis.” [27]
slippage of muscle bundles, disruption of normal cardiac cells and due to tissue loss within the
infarct zone. The apex is the thinnest region and is especially prone for infarct expansion. Infarct
expansion is associated with increased incidence of heart failure, aneurysm formation and
increased mortality.
Dilatation of the non-infarcted zone of the myocardium occurs as a result of a
compensatory mechanism to maintain the normal cardiac output. Also the increased pressure
load on the non-infarcted myocardium leads to hypertrophy of those areas which helps maintain
a normal cardiac output.
Ventricular remodeling after an acute myocardial infarction can be modified by a number
of therapeutic interventions. Acute reperfusion restricts the area of myocardial infarction and
prevents dilatation of the left ventricle. Treatment with angiotensin II inhibitors provides cardiac
protection by reducing the endothelial dysfunction and reducing ventricular remodeling in
addition to its direct antiatherogenic effects. Aldosterone inhibition also reduces collagen
deposition and decreases the development of ventricular arrhythmias.
Incidence of Heart Failure after Myocardial Infarction
There are several studies that have studied the relationship between door to balloon time
and symptom to balloon time. Several of these studies found that prolongation in these times lead
to a reduced index left ventricular function. These studies include the Harmonizing Outcomes
with Revascularization and Stents in Acute Myocardial Infarction (HORIZONS-AMI) trial that
included 2639 patients and found that left ventricular ejection fraction was inversely associated
Ng and el [30] found that after myocardial infarction, LVEF was significantly highera
mong patients with shorter symptom to balloon time when compared with those who had longer
times (n=2,529, P=.029). Also a study done on 1723 Polish patients [31] showed a significant
difference in the mean LV ejection fraction among patients with the shortest symptom to balloon
time (<1.5hours, 48% ± 13.4%) compared to those with the longest reperfusion time (>6hours,
31.4% ± 11.3%, P=.05).
Some studies such as Controlled Abciximab and Device Investigation to Lower Late
Angioplasty Complications (CADILLAC) trial [32], Stent Primary Angioplasty in Myocardial
Infarction (PAMI) trial [33], Enhanced Myocardial Efficacy and Removal by Aspiration of
Liberated Debris (EMERALD) trial [34] and a few more studies found no association between
reduced LV ejection fraction and the symptom to balloon time. The explanation offered was that
the early reduced LV ejection fraction could possibly be due to myocardial stunning or due to
hibernating myocardium rather than denoting the size of the infarct. This could also be explained
by the improvement in the LV ejection fraction on follow up.
Most of the trials which included LV ejection fraction at follow up as a parameter
reported a significant improvement in LVEF on follow up compared to the index LVEF in
patients who had shorter reperfusion times. One randomized study [35] found that longer
reperfusion time was an independent predictor of worsening of LV function in 43% of the
subjects at 6 months (HR 1.43, 95% CI 1.06-1.94). The PAMI trial noted an improvement in
LVEF of 12% on follow up in patients with reperfusion time of < 2 hours as compared to an
improvement of 4% in patients with reperfusion time of > 2 hours. The final LVEF at 6 months
A total of 12 studies were done to establish a relationship between reperfusion time and
index heart failure. 11 of these studies showed significant association between these 2 variables.
The largest trial by American College of Cardiology National Cardiovascular Data Registry [37]
showed an absolute increase in heart failure by 5.3% in patients with door to balloon time of
>120 minutes compared to a time of <60 minutes. The largest study done by Ng S et al [30]
showed that for every 1 hour increase in reperfusion time, there was an increase in incidence of
heart failure by 4%.
Many trials including Danish Acute Myocardial Infarction 2 (DANAMI-2) study have
shown that primary angioplasty has better outcome compared to intra venous thrombolysis in
terms of 30 days mortality. Another trial done by Henriques et al [38] has established that primary
angioplasty has better outcome in terms of LVEF in patients who have anterior wall myocardial
MATERIALS AND METHODS
Source of Data
This study was done in PSG Hospitals which is affiliated to PSG Institute of Medical
Sciences and research in Coimbatore, Tamil Nadu. All patients presenting to the hospital with
acute STEMI and undergoing thrombolysis or primary PCI were included in the study between
the period of March to December 2013. A total of 93 patients were included out of which 32
underwent primary PCI and 61 underwent thrombolysis with streptokinase. 40 of 61 patients
who were thrombolysed underwent coronary angiogram for risk stratification and further
management.
Methodology
A total of 93 consecutive patients with STEMI undergoing either primary PCI or
thrombolysis were included in the study after obtaining proper consent from the patients. Age,
sex, time of onset of chest pain and the time of start of thrombolysis or time of balloon dilatation
were noted. Presence or absence of diabetes mellitus, hypertension and smoking history were
recorded. The left ventricular ejection fraction within 24 hours of admission and before discharge
were recorded by a single operator to avoid inter observer variability using Simpson‟s Method.
Presence of heart failure was monitored during the hospital stay based on the Framingham
Criteria for Heart Failure. Number of vessels with 50% or more stenosis was noted either during
primary PCI or during elective coronary angiogram. Statistical analysis was done using
Inclusion Criteria
All patients presenting to PSG hospitals with diagnosis of acute STEMI, who underwent reperfusion with either thrombolysis or primary PCI during the time period of March
2013 and December 2013.
Exclusion Criteria
Patients with previous history of coronary artery disease were excluded.
Patients with previous history of heart failure were excluded.
Protocol of the Study
Entry Point
Patients presenting with acute STEMI who are undergoing revascularization
History
Time of onset of chest pain
Past history of diabetes, hypertension, smoking
Past history of CAD, heart failure, structural heart disease
Management
Patient undergoes either thrombolysis or primary PCI
Time from onset of chest pain to start of thrombolysis or start of balloon dilation is noted
Follow Up
Patient followed up for signs of heart failure
LV ejection fraction by echocardiography using Simpson‟s method is determined during the first 24 hours and on discharge
Definitions
Definition of MI
(ESC/ACCF/AHA/WHF Task Force for the Universal Definition of Myocardial Infarction)[6]
Detection of a rise and/or fall of cardiac biomarker values [preferably cardiac troponin(cTn)]
with at least one value above the 99th percentile upper reference limit (URL) and with at least
one of the following:
Symptoms of ischemia
New or presumed new significant ST segment and T wave (ST–T) changes or new left
bundle branch block(LBBB)
Development of pathological Q waves in the ECG
Imaging evidence of new loss of viable myocardium or new regional wall motion
abnormality
Identification of an intracoronary thrombus by angiography or autopsy
ECG Criteria for STEMI
(ESC/ACCF/AHA/WHF Task Force for the Universal Definition of Myocardial Infarction)[6]
New ST segment elevation at the J point in two contiguous leads with elevation >0.1 mV
in all leads other than leads V2-V3
For leads V2-V3, ST elevation should be ≥0.2 mV in men ≥40 years, ≥0.25 mV in men
Diagnostic criteria for heart failure [7]
The Framingham criteria requires the simultaneous presence of at least 2 major criteria or 1
major criteria and two minor criteria. Minor criteria are accepted only if they cannot be attributed
to another cause (e.g. pulmonary hypertension, nephrotic syndrome, chronic lung disease,
cirrhosis, etc.).
Classification of severity of LV dysfunction based on LVEF
( From Feigenbaum‟s Echocardiography, 7th
Edition)
Normal LVEF >55%
Mild LVD 45 – 54%
Moderate LVD 30 – 44%
FLOW CHART OF THE STUDY
Patient presenting with acute STEMI without any exclusion criteria and planned
for reperfusion
Time of onset of symptoms noted Presence of DM, HTN, smoking noted
Undergoing Thrombolysis Undergoing PCI
Door to needle time noted Door to balloon time noted
EF and signs of HF noted within 24 hours of admission
Followed up for signs of HF
Coronary lesions noted during PPCI/elective CAG
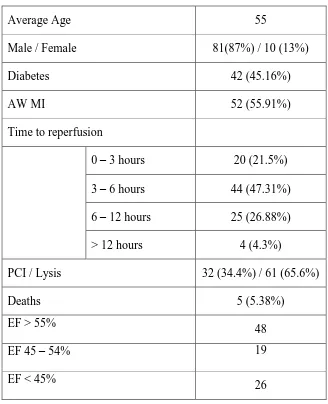
RESULTS
Total of 93 patients were included in the study of which 32 underwent primary PCI and
[image:43.612.142.470.219.623.2]61 underwent thrombolysis with streptokinase.
Table 1: General Characteristics of the study group
Average Age 55
Male / Female 81(87%) / 10 (13%)
Diabetes 42 (45.16%)
AW MI 52 (55.91%)
Time to reperfusion
0 – 3 hours 20 (21.5%)
3 – 6 hours 44 (47.31%)
6 – 12 hours 25 (26.88%)
> 12 hours 4 (4.3%)
PCI / Lysis 32 (34.4%) / 61 (65.6%)
Deaths 5 (5.38%)
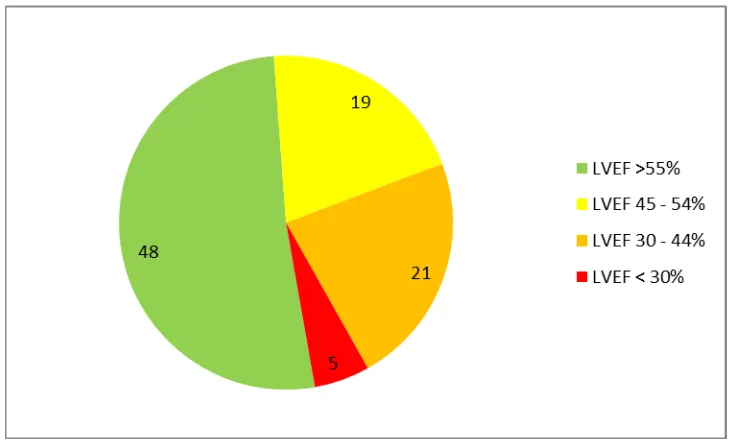
EF > 55%
48
EF 45 – 54% 19
EF < 45%
Figure 5: Graphic representation of LVEF in study group
Table 2: Characteristics based on time to reperfusion
Time to reperfusion <3 hours 3 to 6 6 to 12 > 12 p value
Mean Age 53.7±12.135 52.72±12.79 58.6±8.61 64±10.39 0.087
Male 19(95.0) 35(79.54) 23(92.0) 4(100.0) 0.215
Diabetes 11(55.0) 16(36.36) 12(48.0) 3(75.0) 0.299
Anterior MI 6(30.0) 29(65.9) 15(60.0) 2(50.0) 0.059
Heart failure symptoms 3(15.0) 10(22.72) 4(16.0) 3(75.0) 0.050
Normal LV function 14(70.0) 26(59.09) 8(32.0) 0(0.0) 0.008
LVEF < 45% 4(20.0) 7(15.9) 11(44.0) 4(100.0) 0.001
Death 1(5) 1(2.27) 2(8.0) 1(25.0) 0.24
Significant association was noted between time to reperfusion and patients developing
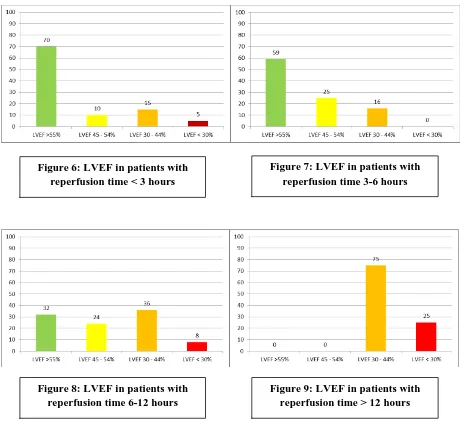
[image:44.612.45.576.429.573.2]Graphic representation of LVEF based on time to reperfusion
These graphs show that as time to reperfusion gets longer, less number of patients retain a
normal left ventricular function and more patients start developing moderate and severe left
ventricular systolic dysfunction. Figure 6: LVEF in patients with
[image:45.612.71.538.119.547.2]reperfusion time < 3 hours
Figure 7: LVEF in patients with reperfusion time 3-6 hours
Figure 8: LVEF in patients with reperfusion time 6-12 hours
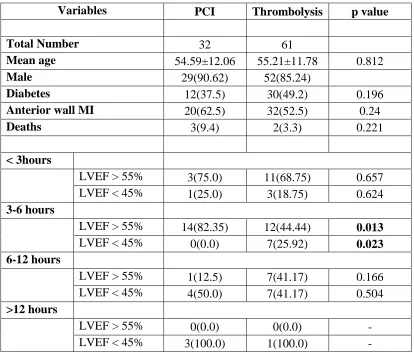
Table 3: Characteristics based on PCI or thrombolysis
Variables PCI Thrombolysis p value
Total Number 32 61
Mean age 54.59±12.06 55.21±11.78 0.812
Male 29(90.62) 52(85.24)
Diabetes 12(37.5) 30(49.2) 0.196
Anterior wall MI 20(62.5) 32(52.5) 0.24
Deaths 3(9.4) 2(3.3) 0.221
< 3hours
LVEF > 55% 3(75.0) 11(68.75) 0.657 LVEF < 45% 1(25.0) 3(18.75) 0.624
3-6 hours
LVEF > 55% 14(82.35) 12(44.44) 0.013
LVEF < 45% 0(0.0) 7(25.92) 0.023 6-12 hours
LVEF > 55% 1(12.5) 7(41.17) 0.166 LVEF < 45% 4(50.0) 7(41.17) 0.504
>12 hours
LVEF > 55% 0(0.0) 0(0.0) - LVEF < 45% 3(100.0) 1(100.0) -
This table shows that there are no significant differences between the general
characteristics of the patients undergoing either thrombolysis or PCI.
Significant differences are noted between PCI group and thrombolysis group only in the
group of patients who undergo reperfusion between 3 and 6 hours. In this group, patients who
undergo PCI have a significantly better LVEF than those who undergo thrombolysis. Patients
who undergo reperfusion after 12 hours, irrespective of undergoing PCI or thrombolysis, have an
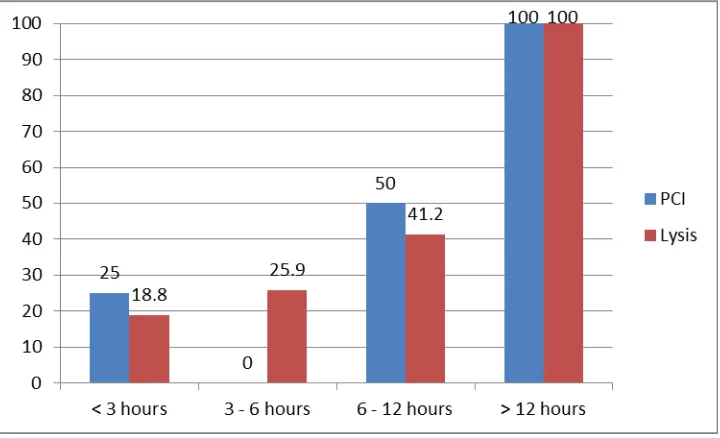
Figure 10: Normal LVEF based on time to reperfusion in PCI and thrombolysis groups
[image:47.612.127.487.426.645.2]Table 4: Characteristics based on age
Age < 30 30-40 40-50 50-60 60-70 >70 p value
N value 3 8 20 30 24 8
Diabetes 1(33.33) 2(25.0) 10(50.0) 13(43.33) 10(41.67) 6(75.0) 0.453
AW MI 2(66.67) 5(62.5) 11(55.0) 15(50.0) 13(54.17) 6(75.0) 0.859
Death 0(0.0) 0(0.0) 1(5.0) 2(6.67) 1(4.17) 1(12.5) 0.902
< 3 hours
LVEF > 55% 0(0.0) 1(100.0) 4(57.14) 7(100.0) 1(50.0) 1(50.0) 0.215
LVEF < 45% 1(100.0) 0(0.0) 1(14.28) 0(0.0) 1(50.0) 1(50.0) 0.136
3 - 6 hours
LVEF > 55% 2(100.0) 4(66.67) 8(72.72) 6(60.0) 6(46.15) 0(0.0) 0.29
LVEF < 45% 0(0.0) 1(16.67) 0(0.0) 3(30.0) 2(15.38) 1(50.0) 0.338
6 – 12 hours
LVEF > 55% 0(0.0) 0(0.0) 1(50.0) 2(18.18) 4(44.44) 0(0.0) 0.29
LVEF < 45% 0(0.0) 0(0.0) 1(50.0) 4(36.37) 4(44.44) 2(100.0) 0.46
>12 hours
LVEF > 55% 0(0.0) 0(0.0) 0(0.0) 2(100.0) 0(0.0) 2(100.0) -
LVEF < 45% 0(0.0) 0(0.0) 0(0.0) 2(100.0) 0(0.0) 2(100.0) -
From this table, age has no significant effect on the left ventricular ejection fraction and
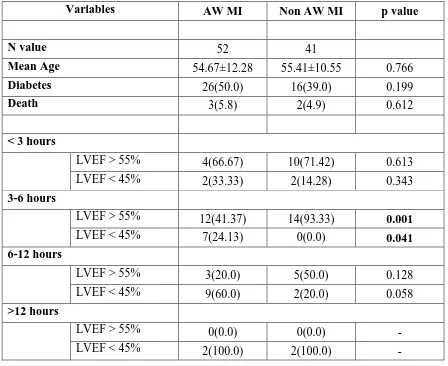
Table 5: Characteristics based on anterior wall or non-anterior wall MI
Variables AW MI Non AW MI p value
N value 52 41
Mean Age 54.67±12.28 55.41±10.55 0.766
Diabetes 26(50.0) 16(39.0) 0.199
Death 3(5.8) 2(4.9) 0.612
< 3 hours
LVEF > 55% 4(66.67) 10(71.42) 0.613 LVEF < 45% 2(33.33) 2(14.28) 0.343
3-6 hours
LVEF > 55% 12(41.37) 14(93.33) 0.001 LVEF < 45% 7(24.13) 0(0.0) 0.041
6-12 hours
LVEF > 55% 3(20.0) 5(50.0) 0.128 LVEF < 45% 9(60.0) 2(20.0) 0.058
>12 hours
LVEF > 55% 0(0.0) 0(0.0) - LVEF < 45% 2(100.0) 2(100.0) -
Patients with anterior wall myocardial infarction have a more reduced left ventricular
ejection fraction than those with non-anterior wall myocardial infarctions. There is significant
difference between anterior and non-anterior wall myocardial infarction in the group with a
reperfusion time of 3 to 6 hours. After 6 hours, the rate of reduction in LVEF increases in the
non-anterior wall myocardial infarction. Therefore, patients with AWMI develop reduced LVEF
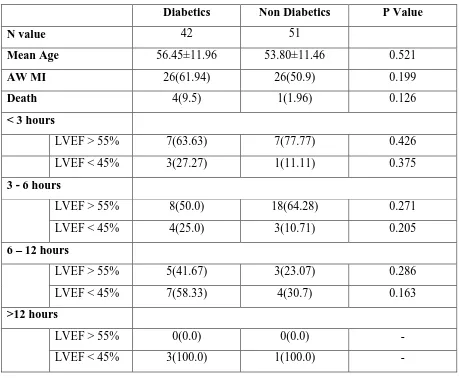
Table 6: Characteristics based on presence of diabetes mellitus
Diabetics Non Diabetics P Value
N value 42 51
Mean Age 56.45±11.96 53.80±11.46 0.521
AW MI 26(61.94) 26(50.9) 0.199
Death 4(9.5) 1(1.96) 0.126
< 3 hours
LVEF > 55% 7(63.63) 7(77.77) 0.426 LVEF < 45% 3(27.27) 1(11.11) 0.375
3 - 6 hours
LVEF > 55% 8(50.0) 18(64.28) 0.271 LVEF < 45% 4(25.0) 3(10.71) 0.205
6 – 12 hours
LVEF > 55% 5(41.67) 3(23.07) 0.286 LVEF < 45% 7(58.33) 4(30.7) 0.163
>12 hours
LVEF > 55% 0(0.0) 0(0.0) - LVEF < 45% 3(100.0) 1(100.0) -
There was no significant relationship between the presence or absence of diabetes
mellitus and left ventricular ejection fraction after ST elevation myocardial infarction based on
Table 7: Characteristics based on number of vessels involved
1 vessel 2 vessel 3 vessel p value
N Value 34 16 20
Mean age 51.44±11.33 55.60±9.78 59.95±11.37 0.079
Diabetes 10(29.41) 11(68.75) 8(40.0) 0.038
AW MI 23(67.64) 9(56.25) 45(20.0) 0.324
Death 2(5.9) 1(6.2) 1(5.0) 0.992
< 3 hours
LVEF > 55% 1(50.0) 5(62.5) 4(100.0) 0.505 LVEF < 45% 1(50.0) 1(12.5) 0(0.0) 0.381
3 - 6 hours
LVEF > 55% 11(61.11) 1(25.0) 8(80.0) 0.243 LVEF < 45% 2(11.11) 1(25.0) 0(0.0) 0.16
6 – 12 hours
LVEF > 55% 3(23.07) 1(33.33) 3(75.0) 0.24 LVEF < 45% 5(38.46) 2(66.67) 1(25.0) 0.595
>12 hours
LVEF > 55% 0(0.0) 0(0.0) 0(0.0) - LVEF < 45% 1(100.0) 1(100.0) 2(100.0) -
This study also showed no significant relationship between left ventricular ejection
fraction after myocardial infarction and the number of vessels involved with more than 50%
Table 8: Multiple Regression Analysis
Model
Unstandardized Coefficients
Standardized Coefficients
t Sig.
R2 Overall
p-value B Std. Error Beta
(Constant) .882 .330 2.676 .009
Age .003 .003 .088 .903 .369
Gender -.048 .122 -.039 -.394 .694
Time period .000 .012 -.005 -.046 .964
DM .073 .077 .089 .946 .347
SHT .047 .079 .055 .587 .559 0.313 0.000
Smoking -.073 .084 -.088 -.872 .386
No. of
vessels .023 .036 .061 .651 .517
LVEF -.017 .004 -.468 -4.494 .000
a. Predictors: (Constant), EF, SHT, vessels, Gender, DM, Age, Time period, Smoking
b. Dependent Variable: HF
This table shows that though all the factors together contribute to heart failure by 31.3%,
DISCUSSION
A total of 93 patients were included in this study. All patients presented to the emergency
department with acute onset of chest pain and were diagnosed as ST elevation myocardial
infarction. Out of 93, 32 patients underwent primary angioplasty and 61 underwent intra venous
thrombolysis with streptokinase. All patients were given the option of both thrombolysis and
primary PCI. The decision to do thrombolysis or primary PCI was made by the patients and
family considering the costs involved.
Age and sex distribution
In this study, the mean age was 57.25. Subjects below 40 years of age constituted 11.8%
(N=11) and subjects over 70 years of age constituted 8.6% (N=8). The youngest age encountered
was 27 and the oldest age was 77. Males constituted 89.25% (N=83) and females 10.75%
(N=10) which again shows that males are more prone to coronary artery disease than females.
The sex ratio in this trial was 8.3:1. The lowest age among females was 47 which again shows
that coronary artery disease occurs later in age among females.
Time to reperfusion
The reperfusion time depends on two factors. The initial period is the symptom onset to
presentation time which depends on the patient and his awareness of symptoms of coronary
artery disease and the availability of quick transportation to reach the hospital. The later part is
the door to needle time which depends on the availability of trained staff and a fully operational
Various studies have shown that the shorter the reperfusion time, the better is the left
ventricular function and lower the mortality. The Fibrinolytic Therapy Trialists Collaborative
Group did a meta-analysis on 9 randomized trials which included over 58,000 patients and found
a significant relationship between mortality benefit and time to reperfusion up to 12 hours. The
Global Utilization of Streptokinase and Tissue Plasminogen Activator for Occluded Coronary
Arteries (GUSTO) Trial has shown that there is mortality benefit up to a period of 12 hours with
thrombolysis (5.3% at 2h, 5.9% at 2 to 4h, 8.5% at 4 to 6h and 8.9% at 6h).
The average time to reperfusion, which is the time from the onset of chest pain to start of
thrombolysis or balloon dilatation was 5 hours and 30 minutes. Similar to GUSTO and other
trials, this study has shown that maximum benefit occurred up to 6 hours after which some
benefit was noted up to 12 hours but all patients who had a reperfusion time of more than 12
hours had an LVEF of < 45%.
Most of the patients in this study had a reperfusion time of 3 to 12 hours (N=69, 74.19%).
This study shows that time to reperfusion has a significant association with LVEF. As time to
reperfusion increases, the LVEF is significantly reduced. LVEF was < 45% in 17.18% of
patients who had a reperfusion time of less than 6 hours (N=11, p = .001), 44% of patients with
reperfusion time between 6 and 12 (N=11) and 100% of patients with reperfusion time of more
than 12 hours (N=4).
Difference between PCI and Thrombolysis
Of the 93 patients in this study, 32 underwent primary PCI and 61 underwent
thrombolysis. In patients with reperfusion time of less than 3 hours, 75% in PCI group had
0.657). In reperfusion time of 3 to 6 hours, 82.35% in PCI group had normal LVEF compared to
44.4% in thrombolysis group showing statistically significant difference (p=0.013).
When reperfusion time was 6 to 12 and more than 12 hours, 12.5% and 0% in PCI group
and 41.17% and 0% in thrombolysis group respectively had normal LVEF with no statistical
significance between the groups (p=0.166). This shows that maximum benefit of primary PCI
over thrombolysis is obtained in those who have a reperfusion time of 3 to 6 hours. Similar
results were obtained in the study done by Brodie et al which showed no significant difference
between PCI and thrombolysis groups up to 6 hours but showed better outcome in PCI group
from 6 to 12 hours. This was attributed to limitation of thrombolysis to first 6 hours previously
when the trial was done.
The reason for presence of reduced LVEF as time to reperfusion increases may be due to
the larger area of myocardium that is involved as the time of vessel non patency increases and
also because of the fact that infarction zone expands as the previously stunned myocardium also
begins to undergo necrosis as the duration of ischemia increases.
Difference between AW STEMI and non-AW STEMI
52 of the 93 patients who presented with STEMI had AW STEMI while the remaining 41
patients had lateral wall, inferior wall or posterior wall STEMI. When reperfusion time was less
than 3 hours, 66.67% of AW STEMI patients and 71.42% of non-AW STEMI patients had
normal LVEF showing no statistical significance (p=0.613). In those with reperfusion time of 3
to 6 hours, only 41.37% of patients with AW STEMI had normal LVEF compared to 93.3% of
patients in non-AW STEMI group who had normal LVEF and was statistically significant
When the reperfusion time was 6 to 12 hours, only 20% of AW STEMI and 50% of
non-AW STEMI had normal LVEF and there was no statistical difference (p=0.128). None of the
patients who presented after 12 hours in both groups had normal LVEF. This shows that AW
STEMI patients develop reduced LVEF faster than non-AW STEMI patients and this difference
is observed up to 6 hours. After 6 hours, non-AW STEMI patients also start developing reduced
LVEF and as time progresses, have no statistical difference from those who have AW STEMI.
The reason for higher incidence of reduced LVEF in AW STEMI may be due to the fact that AW
STEMI puts a larger area of myocardium at risk.
Effect of Age on LVEF
53.76% of the patients in this study (N=50) were in the age group of 40 to 60 years.
Subjects below 40 years of age constituted 11.8% (N=11) and subjects over 60 years of age
constituted 34.4% (N=32). There was no statistical difference between various age groups and
the development of LVEF. However, it was noted that older individuals had longer reperfusion
times. All 4 of the patients who were above 70 years of age had a reperfusion time of over 12
hours. The reasons for this delay need to be evaluated.
Role of Diabetes in LVEF
Of the 93 patients enrolled in this study, 42 patients (45.16%) had diabetes mellitus
which is higher than the 30% described in other trials. Statistical analysis of the data showed that
there was no significant association between the presence of diabetes mellitus and the presence
of normal LVEF or development of reduced LVEF. A study done by Alegria et al [39] showed
than non-diabetics. Diabetics are known to do poorly even after reperfusion with higher mortality
compared to non-diabetics. The increased mortality among diabetics could not be explained by
these moderate changes after MI in diabetics.
Symptomatic Heart Failure
Though 45 of the 93 patients (48.38%) had reduction in LVEF, only 20 of the 93 patients
(21.5%) developed signs of heart failure based on the Framingham‟s criteria. To find out the
reasons for development of signs and symptoms of heart failure in some but not all patients with
reduced LVEF, a multiple regression analysis of the data was done.
Multiple regression analysis showed that factors such as age, sex, diabetes, hypertension,
smoking, reperfusion time, number of vessels involved and LVEF were all together contributing
to the development of signs and symptoms of heart failure. Among these, LVEF had the
strongest correlation with the development of symptoms of heart failure. Some studies[40] have
shown that time to reperfusion does not correlate strongly with development of heart failure
since a significant part of the myocardium may only be stunned and not necrosed during the
LIMITATIONS
Number of subjects enrolled in the study was small. Larger number may have shown
statistical significance among the variables.
The study did not include follow up left ventricular ejection fraction assessment even
though it has been shown that LVEF improves at 6 months.
Left ventricular ejection fraction assessment by echocardiography, though assessed by a
single observer to avoid bias, is still not a very accurate method.
Exact time of onset of chest pain is difficult to obtain from history. Incorrect data can
CONCLUSION
1. LVEF strongly depends on the reperfusion time. Longer reperfusion times lead to a
significant reduction in LVEF
2. Primary PCI is superior to thrombolysis with streptokinase in terms of retaining a normal
LVEF. This is very significant in those undergoing reperfusion between 3 and 6 hours of
symptom onset.
3. Patients with reperfusion times of over 12 hours, irrespective of mode of
revascularization or any other variables, have a significant reduction in LVEF.
4. AW STEMI patients tend to have higher incidence of reduced LVEF compared to
non-AW STEMI. The percentage of patients with non-AWMI who had reduced LVEF was
significantly higher than non AW STEMI group when time to reperfusion was between 3
and 6 hours.
5. Non-AW STEMI had better maintained LVEF compared to AW STEMI patients but this
difference becomes insignificant when time to reperfusion exceeds 6 hours.
6. Even though older patients showed higher incidence of reduced LVEF, this was not
significant.
7. Reason for longer reperfusion times in older individuals needs to be studied.
8. Presence or absence of diabetes had no significant relationship to the development of
reduced LVEF after acute STEMI.
9. The number of vessels with more than 50% stenosis as seen during angiogram had no
10.Not all patients with moderate to severe reduction in LVEF developed signs of heart
failure. Multiple regression analysis showed that there was significant association
between developing signs of heart failure and other variables like age, sex, diabetes,
hypertension, smoking, family history and number of vessels involved with the most
significant variable being LVEF.
11.This study stresses the need for creating patient awareness about coronary heart disease
to reduce symptom to door time and the need for hospitals with PCI facilities and a
well-organized staff to reduce the door to balloon time thereby reducing the overall symptom
to balloon time and preventing the development of reduced LVEF which is the most
BIBLIOGRAPHY
1. Finegold, JA; Asaria, P; Francis, DP (4 December 2012). "Mortality from ischaemic
heart disease by country, region, and age: Statistics from World Health Organisation and
United Nations". International journal of cardiology 168 (2): 934–45.
doi:10.1016/j.ijcard.2012.10.046. PMID 23218570.
2. World Health Organization Department of Health Statistics and Informatics in the
Information, Evidence and Research Cluster (2004). The global burden of disease 2004
update. Geneva: WHO. ISBN 92-4-156371-0.
3. Lopez AD Mathers CD Ezzati M et al. Global Burden of Disease and Risk Factors. 2006
World Bank Group New York 552.
4. Reddy KS. Cardiovascular disease in non-Western countries. N Engl J Med 2004;
350:2438.
5. Critchley J, Liu J, Zhao D, et al. Explaining the increase in coronary heart disease
mortality in Beijing between 1984 and 1999. Circulation 2004; 110:1236.
6. Thygesen K, Alpert JS, White HD, et al: Universal definition of myocardial infarction.
Circulation 116:2634, 2007.
7. Modified from Ho KK, Pinsky JL, Kannel WB et al: The epidemiology of heart failure:
The Framingham Study. J Am Coll Cardiol 22:6A, 1993; and Schocken DD, Arrieta MI,
Leaverton PE, et al: Prevalence and mortality rate of congestive heart failure in the
United States. J Am Coll Cardiol 20:301, 1992.
8. McMurray JJ, Petrie MC, Murdoch DR, Davie AP. Clinical epidemiology of heart
9. World Health Organization: Preventing Chronic Diseases: A Vital Investment. 2005
World Health Organization Geneva.
10.Klatsky AL, Tekawa I, Armstrong MA, Sidney S: The risk of hospitalization for ischemic
heart disease among Asian Americans in northern California. Am J Public Health 1994;
84: 1672-5.
11.Enas EA, Yusuf S, Mehta J: Prevalence of coronary artery disease in Asian Indians. Am J
Cardiol 1992; 70: 945-9.
12.Chadha SL, Radhakrishnan S, Ramachandran K, Kaul U, Gopinath N: Epidemiological
study of coronary heart disease in urban population of Delhi. Indian J Med Res 1990; 92:
424-30.
13.Mohan V, Deepa R, Shanti Rani S, Premlatha G: Prevalence of coronary artery disease
and its relationship to lipids in a selected population in South India: the Chennai Urban
Population Study (CUPS No 5). J Am Coll Cardiol 2001; 38: 682-7.
14.Kutty VR, Balakrishnan KG, Jayasree AK, Thomas J : Prevalence of coronary heart
disease in the rural population of Thiruvanthapuram district, Kerala, India. Int J Cardiol
1993; 39: 59-70.
15.Manmi MV, Pavithran K, Abdu Rahiman P, Pishrarody R, Sugathan K: Acute
myocardial infarction in north Kerala: a 20 year hospital based study. Indian Heart J
1991; 43: 93- 6.
16.Ghaffar A, Reddy KS, Singhi M. 2004. Burden of non-communicable diseases in South
Asia. BMJ, 328:807–10.
17.Enas EA, Yusuf S. 1999. Third Meeting of the International Working Group on Coronary
18.Negus BH, Williard JE, Glamann DB, et al. 1994. Coronary anatomy and prognosis of
young asymptomatic survivors of myocardial infarction. Am J Med, 96:354–8
19.Mackay J, Mensah G. 2004. The atlas of heart disease and stroke. World Health
Organization, Centers for Disease Control and Prevention.
20.Yusuf S, Hawken S, Ôunpuu S, et al. 2004. Effect of potentially modifiable risk factors
associated with myocardial infarction in 52 countries (the INTERHEART study):
case-control study. Lancet, 364:937–52.
21.Mohan V, Deepa M, Farooq S, Datta M, Deepa R: Prevalence, awareness and control of
hypertension in Chennai “ : the Chennai Urban Rural Epidemiology Study (CURES-52).
J Assoc Physicians Indian 2007; 55: 326-52.
22.Alexander CM, Landsman PB, Teutsch SM: NCEP-defined metabolic syndrome,
diabetes and prevalence of coronary heart disease among NHANES III participants aged
50 years and older. Diabetes 2003; 52: 1210-4.
23.Deurenberg-Yap M, Chew SK, Deurenberg P: Elevated body fat percentage and
cardiovascular risks at low body mass index levels among Singaporean, Chinese, Malays
and Indians. Obes Rev 2002; 3: 209-15.
24.Coutinho M, Gerstein HC, Wang Y, Yusuf S: The relationship between glucose and
incident cardiovascular events: a metaregression analysis of published data from 20
studies of 95, 783 individuals followed for 12.4 years. Diabetes Care 1999; 22: 233-40.
25.Enas EA, Dhawan J, Petkar: Coronary artery disease in Asian Indians: lessons learned so
far and the role of Lp(a).
26.Dollery CM, Libby P: Atherosclerosis and proteinase activation. Cardiovasc Res. 69:625
27.Weisman HF, Bush DE, Mannisi JA, et al.: Cellular mechanisms of myocardial infarct
expansion. Circulation. 78:186 1988. PMID: 2968197.
28.Enas EA: Coronary artery disease epidemic in Indians: a cause for alarm and call for
action. J Indian Med Assoc 2000; 98: 694-702.
29.BlankenshipJC, SkeldingKA, ScottTD, et al. Predictors of reperfusion delay in patients
with acute myocardial infarction undergoing primary percutaneous coronary intervention
from the HORIZONS-AMI trial. Am J Cardiol 2010; 106(11):1527-33.
30.Ng S, Ottervanger JP, van't Hof AW, et al. Impact of ischemic time on postinfarction left
ventricular function in ST-elevation myocardial infarction treated with primary
percutaneous coronary intervention. Int J Cardiol 2011.
31.TrzosE, KurpesaM, BednarkiewiczZ, et al. Impact of the time to reperfusion on early
outcomes in patients with acute myocardial infarction u