SURROUNDING CORTICAL/CANCELLOUS BONE-
A THREE DIMENSIONAL FINITE ELEMENT ANALYSIS
Dissertation Submitted to
THE TAMILNADU DR. M.G.R. MEDICAL UNIVERSITY
For partial fulfillment of the requirements for the degree of
MASTER OF DENTAL SURGERY
BRANCH – V
ORTHODONTICS AND DENTOFACIAL ORTHOPAEDICS
THE TAMILNADU DR. M.G.R MEDICAL UNIVERSITY
CHENNAI – 600 032
This is to certify that Dr. G.J. ARUNCHANDER, Post graduate student (2012 – 2015)
in the Department of Orthodontics and Dentofacial orthopaedics branch V, Tamil Nadu Government Dental College and Hospital, Chennai – 600 003 has done this dissertation titled“EVALUATION OF VARIABLES AFFECTING DISTRIBUTION OF STRESSES IN
ORTHODONTIC MINISCREWS AND IN SURROUNDING CORTICAL/CANCELLOUS
BONE – A THREE DIMENSIONAL FINITE ELEMENT ANALYSIS” under my direct
guidance and supervision for partial fulfillment of the M.D.S degree examination in April 2015 as per the regulations laid down by The Tamil Nadu Dr. M.G.R. Medical University, Chennai -600 032 for M.D.S., Orthodontics and Dentofacial orthopaedics (Branch – V) degree examination.
Guided By
Dr. G.VIMALA M.D.S.,
Professor and Head,
Dept. of Orthodontics & Dentofacial Orthopaedics, Tamil Nadu Govt. Dental College & Hospital,
Chennai - 600 003
Dr. SRIDHAR PREMKUMAR, M.D.S.,
Principal,
I, Dr. G.J. ARUNCHANDER, do hereby declare that the dissertation titled
“EVALUATION OF VARIABLES AFFECTING DISTRIBUTION OF STRESSES IN
ORTHODONTIC MINISCREWS AND IN SURROUNDING CORTICAL/CANCELLOUS
BONE – A THREE DIMENSIONAL FINITE ELEMENT ANALYSIS” was done in the Department of Orthodontics, Tamil Nadu Government Dental College & Hospital, Chennai 600 003. I have utilized the facilities provided in the Government Dental College for the study in partial fulfillment of the requirements for the degree of Master of Dental Surgery in the speciality of Orthodontics and Dentofacial Orthopaedics (Branch V) during the course period 2012-2015 under the conceptualization and guidance of my dissertation guide, Professor Dr. G. VIMALA MDS.,
I declare that no part of the dissertation will be utilized for gaining financial assistance for research or other promotions without obtaining prior permission from The Tamil Nadu Government Dental College & Hospital.
I also declare that no part of this work will be published either in the print or electronic media except with those who have been actively involved in this dissertation work and I firmly affirm that the right to preserve or publish this work rests solely with the prior permission of the Principal, Tamil Nadu Government Dental College & Hospital, Chennai 600 003, but with the vested right that I shall be cited as the author(s).
Signature of the PG student Signature of the HOD
My sincere and heartfelt thanks to Dr. SRIDHAR PREMKUMAR, M.D.S., our Principal and Professor of Orthodontics, Tamil Nadu Government Dental College and Hospital, Chennai – 3,for his continuous and enormous support in allowing me to conduct this study and for his constant encouragement and advice.
With my heartfelt respect, immeasurable gratitude and honour, I thank my benevolent guide, Dr. G. VIMALA M.D.S., Professor & Head, Department of Orthodontics and Dentofacial orthopedics, Tamil Nadu Government Dental College and Hospital, Chennai – 3, for her prolific guidance, overwhelming support and encouragement throughout my post graduate course and to bring this dissertation to a successful completion.
I owe my thanks and great honour to Dr. B. BALASHANMUGAM M.D.S.,
Professor, Department of Orthodontics and Dentofacial Orthopaedics, Tamilnadu Govt. Dental College and Hospital, Chennai - 3, for helping me with his valuable suggestions.
I sincerely thank Associate professors Dr. G. Usha Rao, Dr. M. Vijjaykanth, Dr. M.D. Sofitha and Assistant professors Dr. G. Usha, Dr. D. Nagarajan, Dr. Mohammed Iqbal, Dr. M.S. Jayanthi and Dr. R. Selvarani for their continuous support and encouragement
I render my sincere thanks to Dr. Mohammed Junaid for helping me with the statistical analysis.
I take this opportunity to express my gratitude to my friends and colleagues for their valuable help and suggestions throughout this study.
I offer my heartiest prayers and gratitude to my family members for their selfless blessings.
This agreement herein after the “Agreement” is entered into on this... day of December 2014 between the Tamil Nadu Government Dental College and Hospital represented by its Principal having address at Tamilnadu Government Dental college and Hospital, Chennai-03, (hereafter referred to as , ’the college’) And
Dr. G. VIMALA aged 46 years working as professor at the college, having residence address at AP 115, 5th Street, AF Block, 11th main road, Anna nagar, Chennai 600040, Tamilnadu (Herein after referred to as the ‘Principal investigator’)
And
Dr. G.J. ARUNCHANDER aged 33 years currently studying as postgraduate student in department of Orthodontics in Tamilnadu Government Dental College and Hospital (Herein after referred to as the ‘PG/Research student and co- investigator’).
Whereas the ‘PG/Research student as part of his curriculum undertakes to
research “EVALUATION OF VARIABLES AFFECTING DISTRIBUTION OF STRESSES IN
ORTHODONTIC MINISCREWS AND IN SURROUNDING CORTICAL/CANCELLOUS BONE
–
A THREE DIMENSIONAL FINITE ELEMENT ANALYSIS” for which purpose the
PG/Principal investigator shall act as principal investigator and the college shall provide the requisite infrastructure based on availability and also provide facility to the PG/Research student as to the extent possible as a Co-investigator.
1. The parties agree that all the Research material and ownership therein shall become the vested right of the college, including in particular all the copyright in the literature including the study, research and all other related papers.
2. To the extent that the college has legal right to do go, shall grant to license or assign the copyright do vested with it for medical and/or commercial usage of interested persons/entities subject to a reasonable terms/conditions including royalty as deemed by the college.
3. The royalty so received by the college shall be shared equally by all the parties. 4. The PG/Research student and PG/Principal Investigator shall under no
circumstances deal with the copyright, Confidential information and know – how generated during the course of research/study in any manner whatsoever, while shall sole vest with the manner whatsoever and for any purpose without the express written consent of the college.
5. All expenses pertaining to the research shall be decided upon by the principal investigator/Co-investigator or borne sole by the PG/research student
(co-investigator).
6. The college shall provide all infrastructure and access facilities within and in other institutes to the extent possible. This includes patient interactions, introductory letters, recommendation letters and such other acts required in this regard.
recommendations and comments of the Ethical Committee of the college constituted for this purpose.
8. It is agreed that as regards other aspects not covered under this agreement, but which pertain to the research undertaken by the student Researcher, under guidance from the Principal Investigator, the decision of the college shall be binding and final. 9. If any dispute arises as to the matters related or connected to this agreement herein, it shall be referred to arbitration in accordance with the provisions of the Arbitration and Conciliation Act, 1996.
In witness whereof the parties hereinabove mentioned have on this the day month and year herein above mentioned set their hands to this agreement in the presence of the following two witnesses.
College represented by its
Principal PG Student
Witnesses Student Guide
S.NO. TITLE PAGE NO.
1. INTRODUCTION 01
2. AIMS AND OBJECTIVES 05
3. REVIEW OF LITERATURE 06
4. MATERIALS AND METHODS 38
5. RESULTS 49
6. DISCUSSION 52
7. SUMMARY AND CONCLUSION 70
S. No. TABLE PAGE No.
1 Control and variable simulations between tapered (Group-I) and
cylindrical (Group-II) 43
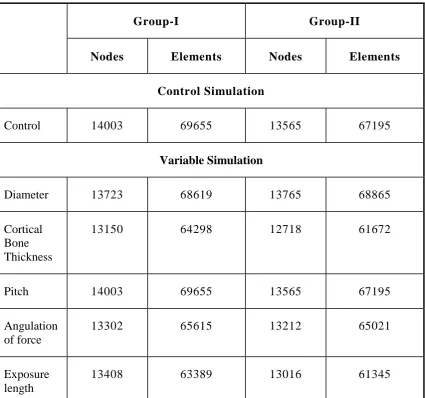
2 Number of nodes and elements employed in the control and variable
simulations between the two groups 44
3 Properties of Materials used for finite element analysis 44
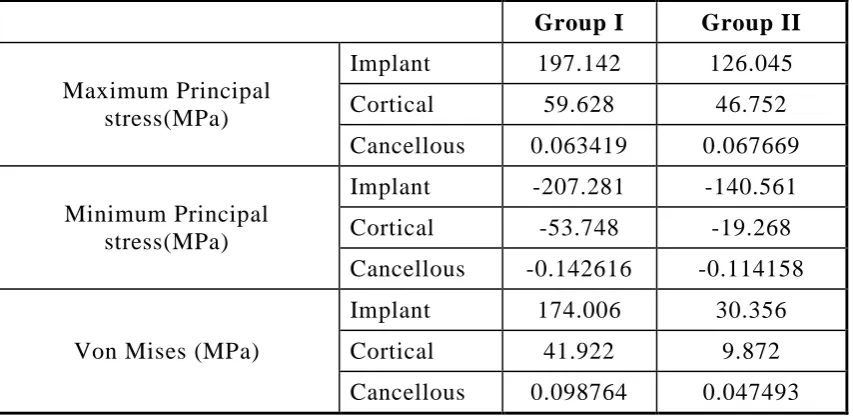
4 Comparison of stress between Group-I/ Group-II with control
simulation 49
5 Comparison of stress between Group-I/ Group-II with diameter as
variable 49
6 Comparison of stress between Group-I/ Group-II with cortical bone
thickness as variable 50
7 Comparison of stress between Group-I/ Group-II with pitch of the
mini screw as variable 50
8 Comparison of stress between Group-I/ Group-II with angulation of
bone as variable 51
9 Comparison of stress between Group-I/ Group-II with exposure
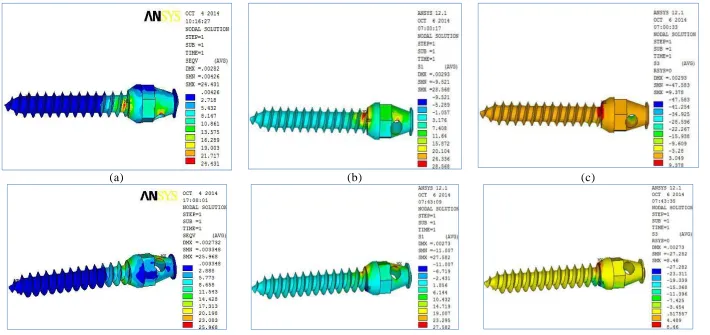
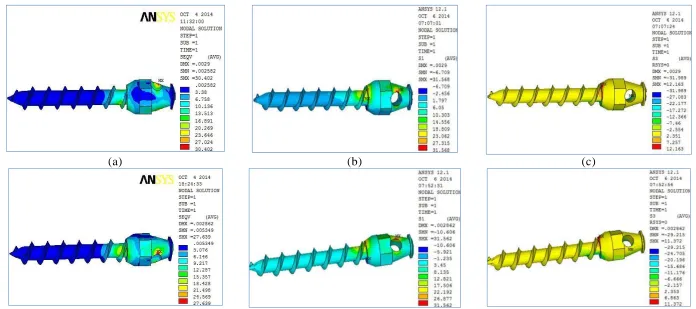
1. Stress plot showing (a) Vonmises (b) Maximum Principal (c) Minimum Principal
stress between Group-I (Top Panel) and Group-II (Lower Panel) in mini screws for
control simulation
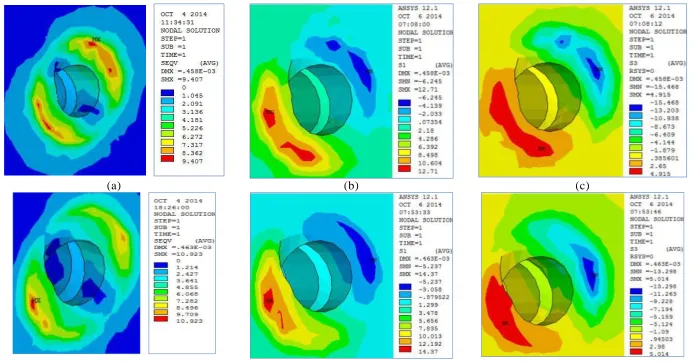
2. Stress plot showing (a) Vonmises (b) Maximum Principal (c) Minimum Principal
stress between Group-I (Top Panel) and Group-II (Lower Panel) in cortical bone for
control simulation
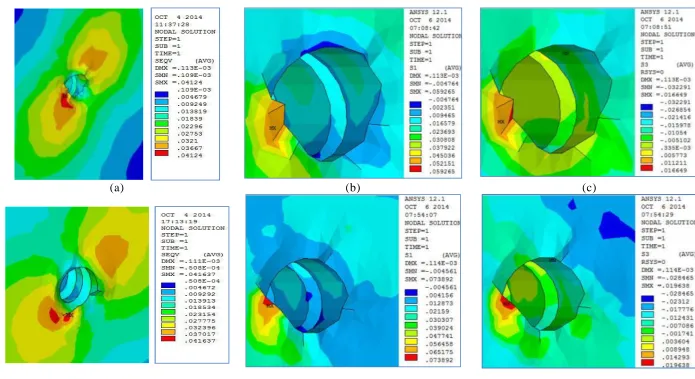
3. Stress plot showing (a) Vonmises (b) Maximum Principal (c) Minimum Principal
stress between Group-I (Top Panel) and Group-II (Lower Panel) in cancellous bone
for control simulation
4. Stress plot showing (a) Vonmises (b) Maximum Principal (c) Minimum Principal
stress between Group-I (Top Panel) and Group-II (Lower Panel) in mini screw with
diameter as variable
5. Stress plot showing (a) Vonmises (b) Maximum Principal (c) Minimum Principal
stress between Group-I (Top Panel) and Group-II (Lower Panel) in Cortical Bone
with diameter as variable
6. Stress plot showing (a) Vonmises (b) Maximum Principal (c) Minimum Principal
stress between Group-I (Top Panel) and Group-II (Lower Panel) in Cancellous Bone
with diameter as variable
7. Stress plot showing (a) Vonmises (b) Maximum Principal (c) Minimum Principal
stress between Group-I (Top Panel) and Group-II (Lower Panel) in mini screw with
Cortical bone thickness as variable
8. Stress plot showing (a) Vonmises (b) Maximum Principal (c) Minimum Principal
stress between Group-I (Top Panel) and Group-II (Lower Panel) in Cortical Bone
with Cortical bone thickness as variable
9. Stress plot showing (a) Vonmises (b) Maximum Principal (c) Minimum Principal
stress between Group-I (Top Panel) and Group-II (Lower Panel) in Cancellous Bone
stress between Group-I (Top Panel) and Group-II (Lower Panel) in mini screw with
Pitch of the mini screw as variable
11. Stress plot showing (a) Vonmises (b) Maximum Principal (c) Minimum Principal
stress between Group-I (Top Panel) and Group-II (Lower Panel) in Cortical Bone
with Pitch of the mini screw as variable
12. Stress plot showing (a) Vonmises (b) Maximum Principal (c) Minimum Principal
stress between Group-I (Top Panel) and Group-II (Lower Panel) in Cancellous Bone
with Pitch of the mini screw as variable
13. Stress plot showing (a) Vonmises (b) Maximum Principal (c) Minimum Principal
stress between Group-I (Top Panel) and Group-II (Lower Panel) in mini screw with
Angulation of Force as variable
14. Stress plot showing (a) Vonmises (b) Maximum Principal (c) Minimum Principal
stress between Group-I (Top Panel) and Group-II (Lower Panel) in Cortical Bone
with Angulation of Force as variable
15. Stress plot showing (a) Vonmises (b) Maximum Principal (c) Minimum Principal
stress between Group-I (Top Panel) and Group-II (Lower Panel) in Cancellous Bone
with Angulation of Force as variable
16. Stress plot showing (a) Vonmises (b) Maximum Principal (c) Minimum Principal
stress between Group-I (Top Panel) and Group-II (Lower Panel) in mini screw
with Exposure Length of the mini screw as variable
17. (a) Vonmises (b) Maximum Principal (c) Minimum Principal stress between
Group-I (Top Panel) and Group-II (Lower Panel) in Cortical Bone with Exposure
Length of the mini screw as variable
18. Stress plot showing (a) Vonmises (b) Maximum Principal (c) Minimum Principal
stress between Group-I (Top Panel) and Group-II (Lower Panel) in Cancellous Bone
INTRODUCTION
Orthodontics is gradually evolving from an opinion based practice to
evidence based practice. In contemporary period, it is necessary to have
scientific rationale for any treatment modality and the evidence of tissue
response to it. Anchorage control is one of the challenges for an orthodontist.
Efficient attainment and control of anchorage is fundamental to successful
orthodontic and dentofacial orthopedic treatment.1
Anchorage, defined as a resistance to unwanted tooth movement, is a
prerequisite for the orthodontic treatment of dental and skeletal
malocclusions. However, even a small reactive force can cause undesirable
movements; it is important to have absolute anchorage to avoid them.
Absolute or infinite anchorage is defined as no movemen t of the anchorage
unit (zero anchorage loss) as a consequence to the reaction forces applied to
move teeth. Such an anchorage can only be obtained by using ankylosed teeth
or dental implants as anchors, both relying on bone to inhibit movement.
Anchorage provided by devices, such as implants or mini - implants
fixed to bone, enhances the support to the reactive unit (indirect anchorage)
or by fixing the anchor units (direct anchorage), thus facilitating skeletal
anchorage.
Mini -implants are generally more widely used because of their lower
cost structure, ease of insertion and removal, and versatility of placement. In
achieving maximum primary stability.2
Implants as defined by Boucher are “alloplastic devices which are
surgically inserted into or onto the jaw bones”. From the time of 16th century
till to date , various materials have been tried as implants which include gold,
ivory, tantalum, stainless steel, cobalt chromium, vitre ous carbon, vitallium,
ceramics and titanium. Among these, titanium is the material of choice for
implants today because of its excellent biocompatibility and ability to
osseointegrate.
Stress analysis of the end osseous implants is necessary for bone
turnover and hence maximum anchorage success. It is virtually impossible to
measure stress accurately around mini-implants in vivo. Also, it is difficult to
achieve an analytical solution for problems involving complicated geometries
such as the maxilla and the mandible, which are exposed to various kinds of
loads.
Finite element analysis provides an approximate solution for the
response of the 3-dimensional (3D) structures to the applied external loads
under certain boundary conditions.3
Incorrect loading or overloading may lead to disturbed bone turn-over
and consequent implant loss. Since clinical determination of stress and strain
distribution in the bone is not possible, an alternative technique should be
used.
makes it practicable to elucidate stresses in the living structures caused by
various internal and external forces. FEM offers a viable and non -invasive
alternative for analysis of the stress and strain distribution, which is unique
because of its ability to model geometrically complex structures. Both two
and three dimensional stress analyses have been used to analyze the dental
implants.
Many studies have made a comparison between the three dimensional
and two dimensional finite element stress analysis.The three dimensional
method has been shown to offer a more precise prediction of stress
distribution than the two dimensional method. For over 200 years, people
have tried to understand the mechanical influence on living bone. In the past
two decades, Finite Element Analysis (FEA) has become an increasingly
useful tool for the prediction of the effects of stress on the implant and its
surrounding bone. The key factor for the success or failure of dental implant
is the manner in which the stresses are transferred to the surrounding bone.
FEA allows predicting stress distribution in the contact area of the implant
with the cortical bone, and around the apex of the implant in the trabecular
bone. Unlike prosthodontic implants Osseo integration is not necessary for
orthodontic mini implants which allows immediate loading of the mini
implants. 4
The primary stability of the mini implants has been associated with
many factors including cortical bone thickness, force applied and angle of the
applied force, exposure length, thread pitch, insertion angle and diameter.5
the bone adjacent to the different types of implant following orthodontic
loading. Knowledge about these factors will enable the clinician to
successfully manage anchorage problems in routine clinical practice.
AIMS AND OBJECTIVES
AIM
The Aim of this study is to evaluate the variables affecting distribution of
stresses in orthodontic miniscrews and in surrounding cortical/cancellous
bone by three dimensional finite element analysis
OBJECTIVES
1) To evaluate by applying FEM the stress distribution pattern in the bone
surrounding a tapered mini implant in response to variables such as
cortical bone thickness, force angulation, exposure length, thread pitch,
insertion angle and diameter.
2) To evaluate by applying FEM the stress distribution pattern in the bone
surrounding a cylindrical mini implant in response to variables such as
cortical bone thickness, force angulation, exposure length, thread pitch,
REVIEW OF LITERATURE
Voluminous literature has been published on implants. Writings
relevant to the present study have been reviewed under the following
categories:
1) Evolution of mini implants
2) Micro Computerized tomogram and radiographic study
3) Finite element analysis studies
4) Mechanical pull out strength of miniscrews.
Evolution of mini-implants:
Gainesforth and Higley (1945)6 mentioned the use of implant supported anchorage. They used vitallium screws in six dogs. These implants
were inserted in the ramal area, immediately loaded and were used to bring
about retraction of upper canines. However, all screws were lost within a
period of 1631days. However, all screws were lost within a period of 16
-31days. Following this failure to attain stable anchorage, th ere were no
further reports of attempts to use endosseous implants to move teeth.
Linkow(1970)7 about 25 years later used an implant as a replacement
for a missing molar. This was then used as an anchor tooth, to which Class II
elastics were used to retract the upper anteriors. The upper arch was
consolidated using a fixed appliance, while in the lower arch, only the
premolar and molar were banded and interconnected using a 0.040” rigid
Creekmore and Eklund (1983)8 published a case report of usage of a
vitallium implant for anchorage, while intruding the upper anterior teeth. The
vitallium screw was inserted just below the anterior nasal spine. After a
healing period of 10 days, an elastic thread was tied from the head of the
screw to the archwire. Within one year, 6mm intrusion was demonstrated
along with 25° lingual torque.
Eugene Roberts (1990, 1994)9 has done an extensive research relating to usage of retromolar implants for orthodontic anchorage. The first clinical
trial was on an adult in whom an atrophic extraction site had to be closed. A
special implant was developed that was 3.8mm wide and 6.9mm long, which
was placed in the retromolar area. A 0.021” X 0.025” SS wire was used for
anchorage from the screw around the premolar bracket. In the initial phases,
this wire also aided in leveling. The extraction spaces were closed using
forces from buccal as well as lingual arch. The premolar was prevented from
moving distally with the help of 0.021” X 0.025” wire acting as an anchorage.
The modification in this technique, as suggested by him in 1994, includes the
usage of a 0.019” X 0.025” TMA wire. This wire was termed as the anchorage
wire.
Southard et al (1995)10 compared the intrusion potential of implants with that of teeth (dental anchors). Titanium implants were placed in
extracted 4th premolar area in dogs, followed by a healing period of three
months. Then, an intrusive force of 50-60gm via a ‘V’ bend was applied.
This was compared with the intrusive potential of teeth on the other side
the experiment whereas, on the other side, the tooth acting as the anchor units
tipped severely. Therefore, they concluded that implants were definitely
superior to the teeth acting as anchor units.
Block and Hoffman (1995)11 introduced Onplant, which is a classic example of a subperiosteal implant. Developed by, it consists of a circular
disc, 8-10mm in diameter, with a provision for abutments in the center of the
superficial surface. These abutments would enable the Orthodontist to carry
out tooth movement against the Onplant. The undersurface of this titanium
disc is textured and coated with hydroxyapatite. The hydroxyapatite, being
bioactive, helps in stabilization of the implant by improving integration with
the bone. The average thickness (height) of the implant is 3mm. Extensive
animal studies have been carried out on Onplants. They point out to the fact
that Onplants bio-integrate, and can tolerate a maximum force of 161 lbs.
Block and Hoffman further suggest that these Onplants could be used not only
for dental anchorage (e.g., for retraction of anter iors and distalization of
posteriors), but also for orthopedic traction. Human trials are however
limited.
Four new systems, which could be grouped under the category of osseous
implants, were introduced. Osseous implants are those that are placed in
dense bone such as the zygoma, the body and ramus area or the mid-palatal
areas.
Wehrbein (1996)12 developed the Orthosystem a titanium screw
the retromolar regions of the mandible or the maxilla. The imp lants are
surface treated with sandblasting and acid etching for making the surface
rough in order to improve integration. They are available in two sizes of 4mm
and 6mm. An 8 week waiting period has been suggested before applying forces
onto this implant.
Umemori and Sugawara (1999)13 developed the Skeletal Anchorage
System. It essentially consists of titanium miniplates, which are stabilized in
the maxilla or the mandible using screws. The recent versions of these
miniplates have been modified for attaching orthodontic elastomeric threads
or coil springs. Different designs of miniplates are available, and this fact
offers some versatility in placing the implants in different sites. The ‘L’
shaped miniplates have been the most commonly used ones, while the ‘T’
shaped ones have been proposed for usage while intruding anterior teeth. The
screws used for fixing the miniplate are usually 2-2.5mm in diameter.
Karcher and Byloff (2000)14 introduced Graz implant supported
system, consists of a modified titanium miniplate with provision for four
miniscrews, and two oval shaped cylinders. This was used mainly as a
support for the Nance button of a pendulum appliance in the palate.
Hugo De Clerck and Geerinckx (2002)15 of Belgium, introduced the Zygoma anchor system. It is a curved titanium miniplate with provision for
three screws of 2.3mm diameter to offer the necessary stabil ity. The lower end
of the miniplate projects outward. It contains a vertical slot for ligatures or
zygomaticomaxillary buttress area. Placement is identical to that of the
Skeletal Anchorage System. These osseous implants were effective in
achieving complex tooth movements like molar intrusion. But, they had their
own limitations. They needed a fairly complex surgery and, therefore, had to
be placed by a surgeon. Secondly, the chances of infection were greater than
the screw implants. Their removal was as difficult as their placement.
Interdental implants were developed in the late 1990’s. They are
endosseous implants, but of smaller diameter, which allows placement in
interdental areas. These rely more on mechanical retention th an complete
osseointegration. The interdental implants are favoured over the retromolar
implants due to the following reasons;
1) Placement is very simple and can be done under local anaesthesia.
2) They seem to be equally effective in resisting forces as the larger
root form implants.
3) They can be used for bringing about all types of tooth movement.
4) Removal is an uneventful procedure.
Bousquet et al (1996)16 published a case report, demonstrating the use of an impacted titanium post for orthodontic anchorage. The post, 0.7mm
in diameter and 6mm long, was made of titanium alloy (Ti6Al4V). This
post, which was impacted in the interdental septum between the upper right
1st molar and the extraction site of the second premolar, was used as
premolar was retracted conventionally. The mesial movement of the two first
molars was then compared. The right first molar tube was connected to the
impacted post with a rigid 0.040” wire. At the end of retraction, it was seen
that on the side of post, there was no mesial movement of the molar and
complete retraction of the 1st premolar. On the left side, there was marked
mesial movement of the 1st molar along with the distal movement of the 1st
premolar. This case report showed the feasibility of using a titanium post for
anchorage.
Ryuzo Kanomi (1997)17 introduced the Mini-implant. This is a modified surgical miniscrew of 1.2mm diameter and 6-7 mm length, which can
be placed interdentally. These implants have been used successfully for
anterior intrusion and retraction, and molar intrusion.
Costa et al (1998)
1 8
published a preliminary report on their newly
developed mini implant called as Aarhus Anchorage System. The initial
design, with an internal Allen wrench-type hole in the head, fractured on
removal of the implant. This design was later replaced by a miniscrew
with a bracket-like head, which facilitated the insertion of a full-sized wire.
Various lengths of transmucosal collar and threaded body are available for
individual anatomies, in either 1.5mm or 2mm diameters.
Park et al (2001)19 developed a customized implant system called Micro-implant Anchorage system. These are small diameter implants, which
can be placed interdentally either in the buccal sulcus or palatal
The maxillary implants are longer than the mandibular ones owing to the
difference in the thickness of cortical bone. The micro-implants are made of
titanium. In mobile mucosal areas, such as the buccal aspect in the maxillary
arch, it has been suggested that the implants be placed directly without
placing an incision. The pilot drill is usually 0.2-0.3 mm smaller than the
desired implant size and is drilled at a slow speed. The implants are driven at
an angle of approximately 30-40° to the long axis of the maxillary teeth, and
10-20° to the mandibular teeth. This ensures optimum retention by
augmenting the area of contact between the implant and adjacent bone. Case
reports on micro-implant usage have shown their efficacy in anterior retraction
with/without intrusion and molar uprightin g.
Maino et al (2003)20 introduced Spider Screw system, and the OMAS
(Orthodontic Mini Anchor System) introduced by Lin et al (2003) are
identical to the micro-implants. They vary in their form and their head design.
The principles, however, remains the same. The tre nd presently seen is
towards immediate loading of these screws.
Micro Computerized tomograph and Radiographic studies.
Gray et al (1983)21 conducted the first study, wherein they tested the
abilities of two types (Bioglass-coated and Vitallium) of small cylindrical
endosseous implants to resist movement, when loaded with constant forces of
orthodontic magnitudes. After a 28-day healing period, these implants were
loaded with forces of 60g, 120g, and 180g. Analysis of implant movement after
28 days revealed that no statistically significant movement occurred at any of
revealed a connective tissue encapsulation with the Vitallium implant, and an
implant- bone bond with the Bioglass implant. No histologic evidence of
implant movement was observed for either implant type at any force level.
Roberts et al (1984)22 investigated the osseous adaptation to continuous loading of rigid endosseous implants in the femurs of rabbits.
After 6-8 weeks of healing, a 100g load was applied for 4-8weeks by
stretching a stainless steel spring between the implant. All but one of twenty
loaded implants remained rigid. Immediate loading of 4 pairs of implants
resulted in spontaneous spiral- type (“torsional”) fractures of the femur within
1 week. Their results indicated that the relatively simple and inexpensive
titanium implants developed a rigid osseous interface. Six weeks was an
adequate healing period, prior to loading, to attain rigid stability and avoid
spontaneous fracture. Continuously loaded implants remained stable within
the bone. These endosseous implants had potential as a source of firm
osseous anchorage for orthodontics and dentofacial orthopedics.
W.E. Roberts (1991)23 subsequently conducted a study to compare the bone adaptation to loaded teeth and dental implants. He concluded that the
rigid implants, the functional equivalent of an ankylosed tooth, appeared to
maintain rigidity by continually remodeling fatigued bone at the osseous
interface.
Gotcher et al (1991 )24 evaluated the bone surrounding loaded
endosseous implants. Eight Branemark implants were placed in the upper and
15, 21, 27, and 36 months. One animal was sacrificed at each time point, and
histomorphometric analysis was done. They concluded that the loaded implant
had enhanced bone turnover. This effect may be due to the loading alone or due
to the implant itself.
Wehrbein et al (1998)25 conducted a histomorphometric study to evaluate the bone-to-implant contact of orthodontic implants in humans
subjected to horizontal loading. In this study, implants were temporarily
inserted into the mid-palatal and the mandibular retromolar areas. These
implants were subjected simultaneously to both axial and oblique forces.
Following completion of the orthodontic therapy, the implants were
explanted by means of a trephine. This yielded a bony cylinder of
approximately 0.4mm in thickness around the 3.3mm implant.
Histomorphometric evaluation indicated that the implants were well integrated
into the bone despite the prolonged application of force in the magnitude of 2-6 N.
Saito et al (2000)26 evaluated the anchorage potential of endosseous
titanium implants as anchors for mesiodistal tooth movement in the beagle
dog. Two implants were surgically placed in healed mandibular extraction
sites of second and third premolars on each side. One side served as a control
or unloaded side, and the other side implants were subjected to 200g of lateral
force. Histomorphometric analysis indicated that there was no statistical
difference in the percent of peri-implant bone volume between the loaded and
the unloaded sides, and no statistical difference between the compression and
tension sides in both loaded and unloaded implants, which suggests that the
The same Japanese team, in 2001, conducted a clinical and histological evaluation of titanium mini-implants as anchors for orthodontic intrusion in
beagle dogs. The methodology was similar to the previous study; an intrusive
force of 150g was applied on the loaded side and compared with the unloaded
implants. The morphometrical findings indicated that the calcification of the
peri-implant bone on the loaded implants was equal to or slightly greater than
those of the controls. In addition, 6 of the 36 mini-implants were removed
after tooth movement, and all of them were easily removed with a screw
driver. Their findings suggested that mini-implants were effective tools for the
anchorage of orthodontic intrusion in beagle dogs.
Melsen et al (2001)27 performed a histomorphometric analysis of
tissue reactions around implants placed in 6 adult Maccaca fascicularis
monkeys, subjected to a well-defined force system. The analysis was
performed on undecalcified sections cut perpendicularly to the long axis of the
implant. The degree of osseointegration, bone density at varying distances
from the implant, as well as the relative extent of res orption and formation of
alveolar bone adjacent to the implant-bone interface was evaluated. The
results were correlated with the local strain of the tissue estimated by the
means of finite element analysis (FEA). It was found that the loading
significantly influenced both the turnover and the density of the alveolar bone
in the proximity of the implants. However, even unloaded implants tended to
maintain the bone characteristics of the alveolar process. But the degree of
osseointegration appeared to be independent of the loading of the implant.
aim was to quantify the histomorphometric properties of the bone- implant
interface to analyze the use of small titanium screws as an orthodontic
anchorage and to establish an adequate healing period. Overall, successful
rigid osseous fixation was achieved by 97% of the 96 implants placed. All the
loaded implants, including the e l a s t o m e r i c chain-loaded implants
showed rigid fixation. Mandibular implants had significantly higher
bone-implant contact than maxillary bone-implants. Within each arch, the significant
histomorphometric indices noted for the “three-week unloaded” healing group
were: increased labeling incidence, higher woven-to-lamellar-bone ratio, and
increased osseous contact. Analysis of these data indicates that small titanium
screws were able to function as rigid osseous anchorage against orthodontic
load for 3 months with minimal (under 3 weeks) healing period.
Motoyoshi et al (2007)29 investigated miniscrew stability with
respect to cortical bone thickness, inter root distance, insertion torque,
distance from alveolar crest to the bottom of the maxillary sinus. They
conducted a computerised tomo graphic study. The success of the miniscrew
was established as no mobility of the miniscrew or pain af ter six months of
loading. The authors concluded that success of the miniscrew was not related
to placement and width/height of peri-implant bone. However the cortical
bone thickness (1mm) and insertion torque (10 Ncm) played a very important
role in the success of miniscrews.
Reint Reynders et al(2009)30 reviewed the literature to quantify
success and complications encountered with the use of mini -implants for
failure and concluded that mini-implants can be used as temporary anchorage
devices, but research in this field is still in its infancy. Interpretation of
findings was conditioned by lack of clarity and poor methodology of most
studies. Questions concerning patient acceptability, rate and severity of
adverse effects of miniscrews, and variables that influenced success remain
unanswered.
Mario Veltri et al(2009)31 evaluated the soft bone primary stability of 3 different orthodontic screws by using the resonance frequency analysi s
which included Aarhus mini-implant , Mini Spider Screws, and Micerium
Anchorage System. Four screws per system were tested and each screw was
placed in 5 excised rabbit femoral condyles, providing experimental models
of soft bone. Placement was drill-free for the A screw, whereas the MAS and
S screws required a pilot hole through the cortical layer. After each placement
procedure, resonance frequency was assessed as a parameter of primary
stability. Differences among the groups were not statistically si gnificant and
concluded that the resonance frequency analysis is applicable to
comparatively assess the primary stability of orthodontic miniscrews and the
3 systems had similar outcomes in an experimental model of soft bone.
Jung-Yul Cha et al(2010)32 aimed to determine the effect of bone mineral density (BMD), cortical bone thickness (CBT), screw position, and
screw design on the stability of miniscrews using computerized tomography.
They placed ninety-six miniscrews of both cylindrical and tapered types in 6
beagle dog. Results showed the placement torque showed a positive
CBT. Placement and removal torque values were significantly higher in the
mandible compared with the maxilla. Tapered miniscrews had higher
placement torque than did the cylindrical type but, the removal torque was
similar in both groups,and concluded that the BMD of cortical bone, screw
type, and screw position significantly influence the primary stability of
miniscrews.
Jung-Yul Cha et al(2010)33 compared the insertion and removal
torque of tapered and cylindric orthodontic miniscrews. Ninety-six
miniscrews were placed into the buccal alveolar bone of the mandible in six
male beagle dogs. Results showed that the tapered miniscrews showed a
higher mean maximum insertion torque than the cylindric miniscrews. The
mean maximum removal torque of the tapered miniscrews was significantly
higher than that of the cylindric miniscrews at 3 weeks after placement, but
there was no significant difference in the mean maximum removal torque
value between the tapered and cylindric implants after 12 weeks of loading.
The percentage of bone-implant contact was similar between the groups after
3 weeks of loading and increased later. The percentage of bone volume/total
volume was higher in the tapered miniscrews than in the cylindric miniscrews
after 3 weeks of loading, but there was no significant difference between the
groups after 12 weeks of loading.
Marco Migliorati et al (2012)34 evaluated the correlations between bone characteristics, orthodontic miniscrew designs, and primary stability.
They placed four different miniscrews in pig ribs. The miniscrews were first
their threads. Subsequently, the maximum insertion torque of the screws and
the maximum load value in the pull out force tests were measured;
furthermore, bone specimen characteristics were analyzed by using cone
-beam computed tomography. For each bone sample, the insertion site cortical
thickness as well as both cortical and marrow bone density were evaluated.
They found a significant dependence between pitch and maximum insertion
torque. Positive correlations were also found between pullout force an d
maximum insertion torque, cortical thickness, and marrow bone density and
concluded a strong correlations were observed among miniscrew geometry,
bone characteristics, and primary stability.
Antonio Gracco et al (2012) 35 determined the effects of variations in thread shape on the axial pullout strength of orthodontic miniscrews. They
used a total of 35 miniscrews of both self-tapping and self-drilling
miniscrews of diameter 2 mm and a thread shaft length of 12 mm, 7 of each
design being considered,and were tested by performing pullout tests on a
synthetic bone support. Results showed the control group with a buttress
reverse thread shape had consistently higher pullout strength values than did
the experimental groups of buttress, 75 joint profile, rounded, and trapezoidal
design. A statistically significant reduction in pullout force was found
between the buttress reverse and the bu ttress thread miniscrews. They
concluded that the thread design influenced the resistance to pullout of the
orthodontic miniscrews. The buttress reverse thread shape provided the
greatest pullout strength.
the success rate of orthodontic microimplants and other factors with cone
-beam computed tomography images. The authors implanted 228 orthodontic
microimplants into the maxillary buccal alveolar bone of 130 patients with
malocclusion. Results showed the overall success rate was 87.7% (200 of
228) and the orthodontic microimplant success rate statistically signi ficantly
increased as root proximity increased, but there were no statistical
significances between placement angles and success rates, and cortical bone
thickness and success rate .They concluded that the success rate of
orthodontic microimplants is not affected by placement angles and is more
significantly affected by root proximity than by cortical bone thickness.
Cortical bone thickness is affected by placement angles, but root proximity is
not affected by placement angles.
Karan Bhalla et al(2013)37 conducted a prospective clinical trial
correlating miniscrew implant (MSI) Micro/macro architecture, the method of
placement, and biologic markers in peri -MSI crevicular fluid (PMICF) as
indicators of bone response. Two types of MSIs (hybrid and cylindric) were
placed in ten patients using a split-mouth technique. The MSIs were
immediately loaded, and PMICF was collected on days 0, 7, 14, 21, 28, and
42 and evaluated using a Standard laboratory protocol. Surface morphology
before placement and after retrieval of the MSI was observed using scanning
electron microscopy (SEM).They concluded that the levels of both the ALP
and AST are significantly higher in cylindric MSIs compared with hybrid
MSIs, indicating a correlation to the type and method of placement of the
until day 14 and a decline after that. Observations from the SEM show a
greater oxide layer formation in the hybrid MSI, which could imply a better
bone-MSI contact ratio.
3. FEM Studies:
A brief note on Finite Element Method:
Recent research in Biologic Sciences, including Medicine and
Dentistry, has made increasing use of technological tools developed by
Engineering and allied sciences. One such tool that has found widespread use
in orthodontic research is the Finite Element analysis (FEA), also called the
Finite Element Method (FEM). For problems involving complicated
geometries, it is very difficult to achieve an analytical solution. Therefore, the
use of numerical methods such as FEA came into existence. FEA was initially
developed in the early 1940s to solve structural problems in the aerospace
industry, but has since been extended to solve problems in heat transfer, fluid
flow, mass transport, and electromagnetics.
The application of FEM most related to orthodontics is the structural
stress analysis. There are a number of studies in orthodontic literature using
the FEM. These include studies of wire configurations, stresses in the
periodontal ligament, determination of centers of resistance and rotation of
teeth with normal and reduced alveolar bone height, stresses in the temporo
-mandibular joint, jaws and cranium, stresses in brackets and adhesives, design
of ceramic brackets, and studies of craniofacial growth.
FEM applicability increased as the computers became readily available
packages are commercially available, which have made this possible. Some
examples of such software packages are MSC PATRAN - NASTRAN,
ANSYS, NISA-DISPLAY, ALGOR etc.
Because the components in a dental implant-bone system are extremely
complex geometrically, FEA has been viewed as the most suitable tool for
analyzing them. Since the present study was carried out using the FEM, it is
apt to review this technique, its theoretical bases, and the difference between
linear and non – linear analyses.
Methodology of the Finite Element Method and its theoretical basis;
The term finite element method was coined by Clough in 1960. By
definition, it is a technique of discretizing a continuum into simple geometric
shapes called elements, enforcing material properties and governing
relationships on these elements, giving due consideration to loading and
boundary conditions which results in a set of equations, and obta ining their
solution to arrive at the approximate behavior of the continuum.
To understand this, the process can be divided into three parts –
1. Pre-Processing
a) This is the first step in the FEM. The structure (continuum) under
study is broken down into a number of sub-parts. These are known as
elements. The elements can be of various types, including spring elements,
line elements (representing rods, beams etc), surface elements (for plates or
membranes) or solid elements (for any solid structure).
process of dividing the continuum into discreet number of elements and nodes
is known as discretization. The collection of nodes and elements is known as
the finite element mesh. Increasing the number of elements (mesh density)
results in a more accurate solution. Although this concept is attractive,
increasing the number of elements also increases the complexity of the
problem, and increases system requirements (processor capabilities and spee d,
storage requirement etc). Practical knowledge and judgment are needed to
limit the number of elements to the minimum amount conducive to acceptable
results. Usually, areas where great variations of stress are anticipated are
divided into more number of elements.
b) After discretization, various material properties have to be
prescribed for the elements. These include Young’s modulus or Modulus of
elasticity, Poisson’s ratio, density, yield strength etc. The most important
properties are the Young’s modulus and Poisson’s ratio.
c) The model is now a rigid body, free to translate in all three planes of
space, or to rotate around any of the three axes. To simulate the true situation,
boundary conditions have to be enforced on the model. The term ‘boundary
conditions’ implies the real life constraints that act on a body. For example, if
one considers a cantilever beam, the fixed end of the beam will be a
constraint, or a boundary condition. To study the bending or stress
distribution of a structure (a building, bridge or a tooth), appropriate
boundary conditions need to be applied to the finite element model.
simulate the loading condition under study. Loads are applied at specific
nodes (according to the given situation), and can be applied as forces or
forced displacements. Also, most FEM software’s allow application of loads
in either a single step, or multiple load steps.
2. Processing
After the preprocessing is completed, the model is ready t o be
executed. Before the analysis proper, the software rechecks all the aspects of
pre processing. Then the global stiffness matrix is calculated.
This is done by calculating the element stiffness matrix for each
element (using the Young’s modulus and the Poisson’s ratio), and then
assembling it into one large matrix, the global stiffness matrix. The next step
is to solve a fundamental equation to obtain the displacements of each node in
all three planes of space. The equation is as follows –
{F} = [K]{u}
Where –
{F} = Nodal force matrix
{u} = Nodal displacement matrix and
[K] = Global stiffness matrix.
The basic unknown is the nodal displacements. By solving this
equation, the nodal displacements are calculated, and then, element stresses
are derived as a function of their displacements. The advantage of such a
small sections of the structure. This is well suited for the study of composite
materials.
3. Post-processing
After the solution is obtained, the results are displayed and analyzed.
This is known as post-processing. Three types of post processing are possible
with most software –
a) Numerical output: This is a large set of results, which gets
displayed. The deformation of each and every element in all three planes of
space can be studied in depth using this option.
b) Graphical output: This is a pictorial representation of the results,
which get displayed in a color-coded manner. The colors represent the
magnitude of stress /deformation at that area. This enables a quick
interpretation of the results.
c) Animated output: As against the static result display in the graphic
output, the animated output shows the effects of the resulting stresses on the
entire body in the form of dynamic displacement.
Linear Vs Non – Linear analysis
When the strain produced is strictly proportional to stress, the material
is said to behave in a linear fashion (since the stress strain graph is a straight
line). When this is not the case, the behavior becomes non-linear (as for
example, when the material is deformed beyond its Proportional or elastic
regains its original shape and size upon complete removal of the appl ied load
- it suffers some amount of permanent set, and its behavior becomes non
elastic). This must be taken into consideration when performing a FEM
analysis. If the applied load results in the structure behaving in a non -linear
fashion, a non –linear analysis must be done. A linear analysis will result in
an erroneous result. The two principal causes for non -linearity, which are of
interest to us, are geometrical and material.
1. Geometric Non-linearity. If a structure experiences large
deformations, its changing geometric configuration can cause the structure to
respond non-linearly. The study of orthodontic wires necessarily involves
large deflections, and hence is non – linear in nature. As the deflection goes
on increasing, the stiffness will also keep changing.
2. Material Non-linearity. Stress strain relationship of a material can be
affected by such factors as deformation beyond elastic limit, environmental
conditions like temperature and amount of time that the load is applied (creep
response). Examples of such material are rubbers, concrete, soils etc.
Finite element method studies
There have been many studies, which have examined the biologic
interactions between dental implants and living tissue. Few studies have
reported on the biomechanical aspects of dental implants. Most of these
studies have been on prosthodontic implants and very few on the implants
used for orthodontic anchorage.
Chen et al (1999)38 conducted a coordinated histomorphometric and
3D FEA to investigate the mechanical environment of cortical bone adjacent
to the threads of a retromolar endosseous implant, used for orthodontic
anchorage to mesially translate mandibular molars in response to normal
functional loading. A 3D model of the mandible and the retromolar implant
with the surrounding cortical bone were modeled. A strong stress pattern
change was found immediately around the implant, which was reflected by a
moderate change of stresses between the threads and a significant increase in
stress at the tips of the threads.
Va´squez M et al (2001)39 conducted a 3-D FEA to evaluate the
initial stress differences between sliding and sectional mechanics with an
endosseous implant as anchorage. A mathematical model was constructed that
used the finite element method, which simulated an endosseous implant and
an upper canine with its periodontal ligament and cortical and cancellous
bone. Levels of initial stress were measured during 2 types of canine
retraction mechanics (friction and frictionless). The lower magnitude and
more uniform stresses in the implant and its cortical bone were found to have
a moment-force ratio (M/F) of 6.1:1, whereas the canine and its supporting
structures exerted a M/F ratio of 10.3:1. On the basis of these results, they
concluded that when the anchor unit is an endosseous implant, it was better to
use a precalibrated retraction system without friction (T -loop) where a low
load-deflection curve would be generated. Overall, the area with the highest
stress was the cervical margin of the osseointegrated implant and its cortical
produce a permanent failure of the implant.
Gedrange et al (2003)40 conducted a 3D FEA of endosseous palatal implants and bone after vertical, horizontal and diagonal force application.
Three types of endosseous implants were: type 1 was a simple, cylinder
-shaped implant; type 2 a cylinder--shaped implant with a superperiosteal step;
and type 3 a cylinder-shaped implant, subperiosteally threaded, and with a
superperiosteal step. The load on the implant was investigated under three
conditions of bite, and orthodontic forces ranged from 0.01 to 100N
(vertically, horizontally and diagonally). Vertical loading caused bone
deformation of more than 600μeps (micro-strains) at the simple implant. The
largest deformations at this load were found in the trabecular bone with all
three implant geometries. However, trabecular bone deformation was reduced
by a superperiosteal step. Horizontal loading of the implants shifted the
deformation from the trabecular to the cortical bone. Furthermore, a large
deformation was measured at the transition from cortical to trabecular bone.
The smallest deformations (less than 300μeps) were found for implants with
superperiosteal step and diagonal loading (type 2). The use of threads
provided no improvement in loading capacity. All implant types investigated
showed good biomechanical properties. However, endosseous implants with a
superperiosteal step had the best biomechanical properties under low loads.
Melsen and Verna (2005)41 evaluated the load transfer from the
Aarhus miniscrew to the surrounding bone and the effect of varying thickness
of the underlying cortical and trabecular bone. They developed two differen t
model. A mesially directed force of 50g was applied at the head of both the
models. The results indicated that the primary component of the load transfer
occurred at a single revolution of the miniscrew thread within the cortex. The
implant tipped, causing tensile stress in the direction of the force. Stress
levels were higher in the cortical bone compared to the trabecular bone and
vice versa for the strain. When the peak strains in bone were co-related to
Frost’s mechanostat theory, it was observed that these strains reached the
pathological overload window only when the cortical bone thickness was
reduced to <0.5mm.
Gallas et al (2005)42 carried a 3D FEA to determine the pattern and distribution of stresses within the ITI-Bonefit endosseous implant and it’s
supporting tissues, when used as orthodontic anchorage unit. They simulated
2 conditions, one with no osseointegration and the second model with full
osseointegration. The threaded implant was simulated in an edentulous
segment of a human mandible with cortical and cancellous bone. The results,
using both models, indicated that the maximum stresses were always located
around the neck of the implant, in the marginal bone. They con cluded that this
area should be preserved clinically in order to maintain the bone -implant
interface structurally and functionally.
Eva Stahl et al (2009)43 compared the stresses produced in cortical bone between sixteen different implants from six manufac turers .The cortical
bone thickness was maintained at 1mm and 2mm and the Young’s modulus of
the cancellous bone was fixed at 100 MPa and 1GPa . The load direction was
that stress values are higher for a cortical bone thickness of 1mm and Young’s
modulus of cancellous bone at 100 MPa. The deflection of most implants
were of 4-10 µm in magnitude .The deflection of the implants increased as the
Young’s modulus of the cancellous bone decreased when the cortical bone
thickness was at 1mm.This association was not seen when the bone thickness
was at 2mm.The load direction when placed in a buccal direction decreased
the stresses by 35%.
Ashish Handa et al (2011)44 evaluated the influence of thread pitch
on maximum effective stress in cortical bone. They selected implants of
thread pitch of 0.5, 1.0, 1.5mm placed 1mm mesial to lower mandibular molar
with a force magnitude of 2 N at a 45 degree angulation. The Von-mises
stresses were maximum at the neck of the implant, bone interface and
increased with increasing thread pitch. However the pattern of the stress was
not influenced by the thread pitch.
Akihiro et al (2011)45 measured the stress distribution in cortical as
well as cancellous bone using 3 dimensional FEM .The authors used 3 types
of implant design cylindrical pin, helical thread,non helical thread designs. A
force of 2N were applied in all 3 directions and force angulations of
30,40,45,50,60,70,80,90 were used. Peak stresses of 9.16Mpa-14.8Mpa were
obtained in the case of pin type and 17.8Mpa-75.2Mpa in the case of helical
thread implant. They concluded that placement angle, type of miniscrew and
direction of the force played a major role in determining the magnitude of
Athina Chatzigianni et al (2011)46 compared the numerical and
experimental data obtained from FEM and mechanical testing of diameter,
angle of insertion, implant type and length of the miniscrews .Various
diameter (1.5-2mm) , lengths (7,9mm) were tested at an angulation of 45,90
degrees of the miniscrews at a force level of 0.5,5N. The authors simulated
the above parameters using a FEM and 3 D laser optic reflection was used to
study the mechanically tested specimens. The authors concluded that the
results obtained from the FEM was comparable to that of mechanical testing
of the miniscrews and also at low force levels 0.5N none of the above said
parameters had an influence on the miniscrew deformation.
Choi et al (2011)47 investigated the stress pattern in a two-piece miniscrew. The authors used a 1.8×8.5 mm miniscrew. Three different head
sizes of 1mm, 2mm, 3mm were available .The cortical bone thickness was
maintained at 1mm and a 2N lateral force was used. The head part of the
screw was friction fitted and an FEM study was done. They concluded that the
minimum principal level forces created were 10.84-15.33 M pa which was
within the tolerance level of bone.
Shivani Singh et al (2012)48 calculated the stress distribution in two
types of implant materials titanium ASTM 136 and medical grade stainless
steel ASTM 316 L. Both horizontal and torsional loading was used. Peak
stresses was produced in the neck of the implants in both materials at the
cortical bone implant interface .Slight bending of the neck of the titanium
Jenny Zwei-Chieng Chan et al (2012)49 evaluated the influence of
thread angulation, degree of taper, taper length, stiffness and screw
displacement on stresses created in bone. Four types of implants were custom
manufactured and tested mechanically in artificial, homogenous bone. FEA
was done and compared to the results obtained from mechanical testing. With
a fixed diameter of 2mm, thread length of 9.82 mm, pitch of 0.75 mm greater
thread depth, smaller taper angle, shorter taper length produced maximum
stresses in bone. They also concluded that maximum pull out strength was
found in implants with a core/external diameter of 0.68.
Te-chun Liu (2012)50 et al compared the bone quality, loading
conditions, screweffects and implanted depth. They utilized a 3 D bone block
and used a FEM to analyze the stress patterns produced in bone. The bone
blocks were of varying cortex thickness, cancellous bone density and the
implants simulated were of varying diameter, length with differing depth. The
results were as follows, the stress/displacement decreased with decreasing
cortical bone thickness, but cancellous bone played a minor role in
influencing the stress patterns. The two indices were linearly proportional to
the force magnitude and produced the highest values perpendicular to the long
axis of the screw. They also concluded that a wider screw produced a
decreased force and exposure length has the most influence on stress patterns
in cortical bone.
Abhishek H Meher et al (2012)51 compared varying cortical bone thickness, applied forces and angulations. They compared cortical bone
g respectively. The force angulation was maintained at 70, 90,110 and 130
degrees. They concluded that the maximum equivalent stress MES and
maximum deformation MD had an inverse relation with cortical bone
thickness. The maximum equivalent stress MES decreased with increased
force angulations whereas the maximum deformation MD increased with
increasing force angulation .On increase in load the maximum equivalent
stress MES showed no change but the maximum deformation MD increased.
Sun-Hye Baek et al (2012)52 compared the stress in the cortical bone due to
mastication and orthodontic miniscrews in three types of morphogenetic features
(high, average, low angle) cases. The three morphological characteristics were
modeled three dimensionally by hyper mesh software. A miniscrew was paced
between lower mandibular molar and second premolar. The stress produced in the
cortical bone during mastication and orthodontic loading of the miniscrew (150 g)
was simulated using the FEM and the peri orthodontic miniscrew compressive stress
(POMI-CSTN) was compared. The results was that (POMI-CSTN) produced due to
mastication was in the order of 1401.75µE and due to orthodontic loading was
1415µE.The authors concluded that the strain due to masticatory stress do not exceed
the normally allowed compressive bone strains but additional orthodontic traction
force to the miniscrew may exceed the threshold value result in the failure of the
miniscrew.
Issa et al (2012)53 evaluated the effect of different angulations in the cortical bone stresses produced in the bone. The authors conducted an FEM
study where miniscrews of 1.3×7, 1.3×8 mm implants were generated in D3