AN EXPLORATORY STUDY OF PERFORMANCE DIMENSIONS OF SUB-REGIONAL SHOPPING CENTRES
Jason Sit and Dawn Birch University of Southern Queensland
Abstract
Despite the advent of e-tailing and other changes in the retailing sector, the ‘one-stop’ shopping centre remains a popular retailing format. ServQual and ServPerf measure the performance of individual service firms on five key dimensions, namely reliability, responsiveness, assurance, empathy, and tangibles. However, these dimensions appear to be less appropriate for measuring the performance of a sub-regional shopping centre that comprises a mix of anchors, specialty stores and service outlets. An exploratory study of 251 households revealed that shoppers evaluate the performance of sub-regional centres on five alternative dimensions, namely accessibility, physical surroundings, safety, retail mix, and personal interaction.
Introduction
A regional shopping centre has 10 000 to 30 000 square metres of floor space. The sub-regional centre typically incorporates at least one full-line discount department store, a major supermarket, and around 40 or more specialty shops. This type of shopping centre makes significant contribution to the economy of Australia. For example, in 1998, sub-regional centres generated an estimated $2.9 billion retail sales and employed approximately 28 000 people in the state of Queensland, Australia (Property Council of Australia 1999). In addition to providing the local community with a range of merchandise, sub-regional shopping centres also house important community services including post-offices, banking, and medical services (Shopping Centre Council of Australia 2000). This exploratory study addresses the dimensions used by the shoppers to evaluate the performance of these sub-regional shopping centres.
Measurement of Performance of Sub-regional Shopping Centres
Research Methodology
Based on retailing literature and focus group discussions, five dimensions for evaluating the performance of sub-regional shopping centres were identified, namely, accessibility, physical surroundings, a safe shopping environment, retail mix, and personal interaction. Forty-four items were generated to operationalise these five dimensions. A questionnaire was developed to measure those items on Likert-type scales. A mail survey was administered to 960 households in a rural city in Queensland, Australia (Malhotra 1996). Households were randomly selected using an area sampling technique, and the main shopper in the household was requested to respond. Two hundred and fifty one usable questionnaires represented a 26% response rate. Goodness of fit testing revealed that there were significantly more female than male respondents, implying that females still assume the primary responsibility for shopping for households (Dholakia 1999).
Results of Exploratory Factor Analysis
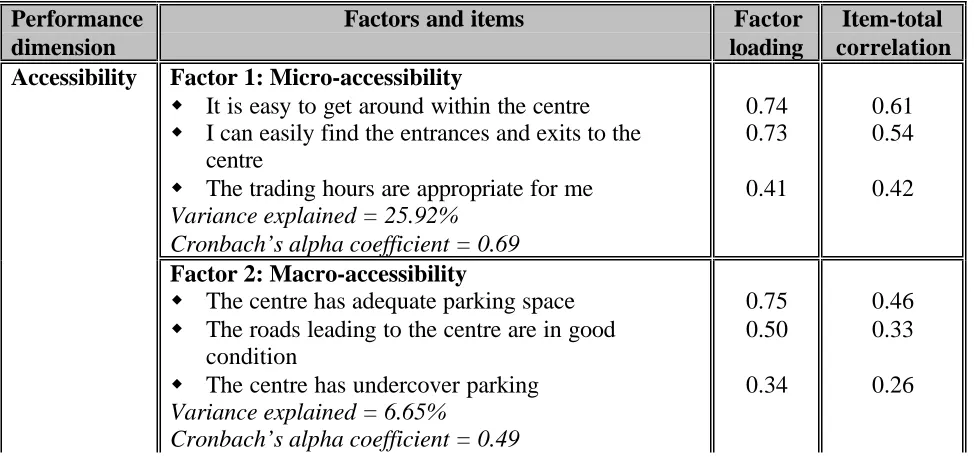
[image:2.612.65.552.484.717.2]The data was subjected to exploratory factor analysis with a varimax rotation. Based on the identified five dimensions, 44 items were factor analysed separately and ten factors that reflect the performance of sub-regional shopping centres were revealed, as summarised in table 1 (Tabachnick & Fidell 1989). In this exploratory study, there were a few items that had factor loadings between 0.3.0 and 0.40 indicating a weak correlation between those items and the factors. However, given the exploratory nature of the study and their relevant importance, those items with factor loadings below 0.50 were retained for further research. Factors with eigenvalues greater than 1.0 were retained. The Kaiser-Meyer-Olkin (KMO) measure of sampling adequacy was rated 0.70 and above, and also Bartlett’s test of sphericity was high and significant (Norusis 1993).
Table 1: Exploratory Factor Analysis for Performance Dimensions of Sub-regional Shopping Centres
Performance dimension
Factors and items Factor
loading
Item-total correlation Factor 1: Micro-accessibility
w It is easy to get around within the centre w I can easily find the entrances and exits to the
centre
w The trading hours are appropriate for me Variance explained = 25.92%
Cronbach’s alpha coefficient = 0.69
0.74 0.73
0.41
0.61 0.54
0.42 Accessibility
Factor 2: Macro-accessibility
w The centre has adequate parking space w The roads leading to the centre are in good
condition
w The centre has undercover parking Variance explained = 6.65%
Cronbach’s alpha coefficient = 0.49
0.75 0.50
0.34
0.46 0.33
Factor 3: Proximity
w The centre is close to where I work w The centre is close to my home Variance explained = 6.41%
Cronbach’s alpha coefficient = 0.534
0.63 0.33
0.39 0.39
Total variance explained = 38.98% Factor 4: Amenities
w The restrooms are easy to find
w The restrooms are conveniently located w The centre has clean restrooms
Variance explained = 36.77% Cronbach’s alpha explained = 0.93
0.93 0.86 0.76 0.91 0.88 0.76
Factor 5: Ambulance w There are adequate lifts
w Directory sign boards within the centre are helpful w There are adequate escalators
w The brochures on the centres' facilities provide adequate information
w Overall the centre is clean w The centre is well-lit Variance explained = 13.45% Cronbach’s alpha explained = 0.82
0.76 0.66 0.64 0.61 0.49 0.41 0.72 0.64 0.46 0.64 0.56 0.57
Factor 6: Ambient Conditions
w Overall the centre has a fashionable colour scheme w The centre has modern decor
w The centre has pleasant background music w The centre is air-conditioned
Variance explained = 6.871%
Cronbach’s alpha coefficient = 0.778
0.98 0.72 0.63 0.31 0.59 0.80 0.65 0.34 Physical surroundings
Total variance explained = 57.09% Factor 7: Safety
w I feel safe when using the escalators w I feel safe when using the restrooms w I feel safe when using the lifts w I feel safe within the shopping centre
w There are security guards on duty within the centre w I feel safe in the centre's car park
w My vehicle is safe in the car park
0.86 0.83 0.81 0.77 0.72 0.72 0.51 0.80 0.79 0.79 0.73 0.67 0.66 0.47 Safe shopping environment
Factor 8: Retail Mix
w The stores in the centre offer a good choice of brands
w Stores within the centre stock my preferred brands w The centre has a good range of products
w The centre provides a good range of services such as banks, health funds, post office etc
Variance explained = 25.41% Cronbach’s alpha coefficient = 0.72
0.84 0.71 0.68 0.40 0.66 0.58 0.55 0.34
Factor 9: Supporting Services
w The centre provides occasional entertainment for customers (i.e. fashion shows and lucky draws) w The centre has specific venues for entertainment
(i.e. cinemas and game zones)
w The centre provides childcare services for customers
w There is a food court in the centre Variance explained = 20.99%
Cronbach’s alpha coefficient = 0.71
0.76 0.69 0.65 0.49 0.59 0.50 0.55 0.35 Retail mix
Total variance explained = 46.40% Factor 10: Personal Interaction
w Employees at the information desk are knowledgeable about the centre
w Employees at the information desk provide prompt service
w Employees at the information desk are courteous w Centre management is helpful when I make an
enquiry
w Centre management responds appropriately to my concerns
w Employees at the information desk are neatly dressed
w I can get assistance at the information desk
0.92 0.90 0.85 0.84 0.83 0.72 0.65 0.87 0.85 0.83 0.81 0.81 0.69 0.63 Personal interaction
Total variance explained = 67.18% Cronbach’s alpha coefficient = 0.93
(Source: developed for this study based on results of five separate factor analyses)
Discussion of Results
three factors, namely, amenities, ambulance and ambient conditions. Amenities concern the locality and cleanliness of restrooms; ambulance concerns the equipment that facilitates the shopper’s movement within the centre, and ambient conditions represent the atmosphere of the centre.
The third dimension of a safe shopping environment revealed one factor named ‘safety’. Safety concerns both personal safety and the safety on one’s car in the parking lot. Retail mix represented the range of retail outlets and services within the centre. Retail mix revealed two factors, namely retail mix and supporting services. The retail mix appears to represent the core services offered, such as range of anchors and service outlets, whereas the supporting services included supplementary services including food courts, entertainment, and child care services. The fifth dimension, personal interaction, revealed one factor, labelled ‘personal interaction’, and concerned the attitude of employees and management when handling customers’ enquiries.
Contributions and Managerial Implications
This exploratory study extends the academic literature on one-stop shopping centres. That is, the study identified more appropriate dimensions that reflect the performance of sub-regional shopping centres than those offered by ServQual and ServPerf. (Parasuraman, Zeithaml & Berry 1988). This exploratory study could provide a framework for management when conducting an internal audit of their shopping centre. That is, the multiple-item scale developed in this study could be modified to gather benchmark data regarding current levels of service performance, and thus allow management to determine the relative strengths and weakness of their centre. Further, satisfactory performance of each dimension could be viewed as a means for delivering higher levels of service quality.
Limitations and Future Research
This exploratory study aimed to identify dimensions that reflect the performance of one-stop shopping centre, and these findings are confined to sub-regional shopping centres. Further research is required to examine the construct validity and reliability of those dimensions in this context, as well as, other types of shopping centres including regional and neighbourhood centres. Future research should also investigate the relative importance of the dimensions. This study was confined to the perceptions of respondents residing in a rural city in Queensland, Australia. Hence, further research may reveal that the perceived performance dimensions differ in other rural and urban areas. Moreover, further research may identify the moderating variables that influence shoppers’ perceptions. Further, the exploratory factor analysis revealed some unexplained variance, indicating that other factors may influence perceptions of performance.
Conclusion
that comprise a mix of anchor stores and specialty shops, and offer a range of merchandise and services. In this preliminary study, exploratory factor analysis with varimax rotation revealed that shoppers use five alternate dimensions for measuring the performance of sub-regional centres, namely accessibility, physical surroundings, safe shopping environment, retail mix and personal interaction. In terms of contribution, this exploratory study extends the academic literature on one-stop shopping centres. Further, the multiple-item scale developed in this study could serve as an internal audit tool that enables management to determine their centres’ strengths and weaknesses.
References
Churchill, A. Gilbert. (1979), 'A paradigm for developing better measures of marketing constructs', Journal of Marketing Research, vol. 15, February, pp. 64-73.
Cronin, Joseph. & Taylor, Steven, (1992), ‘Measuring service quality: a re-examination and extension’, Journal of Marketing, vol. 56, July, pp. 55-68.
Dholakia, R. Ruby. (1999), ‘Going shopping: key determinants of shopping behaviours and motivations’, International Journal of Retail and Distribution Management, vol. 27, no. 4, pp. 154-165.
International Council of Shopping Centres. (1999), ICSC Shopping Centre Definitions: basic configuration and types [Online], Available:
htt://www.icsc.org/srch/about/impactofshoppingcentres/centredefinitions.html, [Accessed 14 February 2000].
Kirkup, Malcolm. & Rafiq, Mohammed. (1999), ‘Marketing shopping centres: challenges in the UK context’, Journal of Marketing Practice: Applied Marketing Science, vol. 5, no. 5, pp. 119-133.
Levy, Michael. & Weitz, A. Barton. (1998), Retailing Management, 3rd edn, McGraw-Hill, United States.
Lovelock, C. H., Patterson, P. G. & Walker, R. H. 1998, Services Marketing, Australia and New Zealand edn, Practice Hall, United States
Malhotra, K. Naresh. (1996), Marketing Research: An Applied Orientation, 2nd edn, Prentice Hall, United States, America.
Merrilees, Bill & Miller, Dale. (1996), Retailing Management: A Best Practice Approach, RMIT Press, Victoria, Australia.
Norusis, Marija. J. 1993, SPSS for Windows, Professional Statistics, SPSS Inc. USA.
Property Council of Australia. (1999), Directory of Shopping Centres: New South Wales and Australia Capital Territory 1997/1998, Sydney, New South Wales.
Shopping Centre Council of Australia 2000 [Online], Available: http://www.propertyoz.com.au/scca/advoc/facts.htm, [Accessed 26 April 2000].