White Rose Research Online
Universities of Leeds, Sheffield and York
http://eprints.whiterose.ac.uk/
This is a copy of the final published version of a paper published via gold open access
in
Ecology and Evolution
.
This open access article is distributed under the terms of the Creative Commons
Attribution Licence (
http://creativecommons.org/licenses/by/3.0
), which permits
unrestricted use, distribution, and reproduction in any medium, provided the
original work is properly cited.
White Rose Research Online URL for this paper:
http://eprints.whiterose.ac.uk/78574
Published paper
A first-generation microsatellite linkage map of the ruff
Lindsay L. Farrell1,2, Terry Burke1, Jon Slate1& David B. Lank21Department of Animal and Plant Sciences, University of Sheffield, Sheffield, S10 2TN, U.K.
2Department of Biological Sciences, Simon Fraser University, Burnaby, British Columbia, Canada V5A 1S6
Keywords
Chromosomes, genetic map, linkage groups, microsatellite, ruff.
Correspondence
Lindsay L. Farrell, Department of Biological Sciences, Simon Fraser University, Burnaby, BC, Canada V5A 1S6.
Tel: +44 0114 222 0113; Fax: +44 0114 222 0002; E-mail: [email protected]
Funding Information
The laboratory work was performed at the University of Sheffield and supported by the UK Biotechnology and Biological Sciences Research Council. The captive ruff colony was supported by the Natural Sciences and Engineering Research Council of Canada (NSERC; to D. B. Lank) and L. L. Farrell was supported by an NSERC PGS-D3.
Received: 3 June 2013; Revised: 6 September 2013; Accepted: 9 September 2013
Ecology and Evolution2013; 3(14): 4631–
4640
doi: 10.1002/ece3.830
Abstract
A linkage map of the ruff (Philomachus pugnax) genome was constructed based on segregation analysis of 58 microsatellite loci from 381 captive-bred individu-als spanning fourteen breeding years and comprising 64 families. Twenty-eight of the markers were resolved into seven linkage groups and five single marker loci, homologous to known chicken (Gallus gallus) and zebra finch (Taeniopygia
guttata) chromosomes. Linkage groups range from 10.1 to 488.7 cM in length
and covered a total map distance of 641.6 cM, corresponding to an estimated 30–35% coverage of the ruff genome, with a mean spacing of 22.9 cM between loci. Through comparative mapping, we are able to assign linkage groups Ppu1, Ppu2, Ppu6, Ppu7, Ppu10, Ppu13, and PpuZ to chromosomes and identify sev-eral intrachromosomal rearrangements between the homologs of chicken, zebra finch, and ruff microsatellite loci. This is the first linkage map created in the ruff and is a major step toward providing genomic resources for this enigmatic species. It will provide an essential framework for mapping of phenotypically and behaviorally important loci in the ruff.
Introduction
Uniquely among birds, ruffs (Philomachus pugnax) exhibit three different and distinct permanent alternative male reproductive morphs, with correlated differences in terri-torial lekking behavior, body size, and the presence or coloration of ornamental breeding plumage. All popula-tions include: (1) dark-plumed territorial “Independents,” (2) white-plumed nonterritorial “Satellites,” and (3) small female mimics called “Faeders” (Hogan-Warburg 1966; H€oglund and Lundberg 1989; Van Rhijn 1973; Jukema and Piersma 2006). Status as an independent or satellite has been previously shown to be due to a genetic
polymorphism in male mating behavior consistent with a single-locus, two-allele autosomal Mendelian mode of inheritance (Lank et al. 1995). More recently, it has been discovered that a dominant autosomal allele controls development in to female-mimicking faeders (Lank et al. 2013).
With the current evidence for Mendelian genetic determination of behavioural type (Lank et al. 1995) and a strong genetic basis also suspected for plumage characters (Dale et al. 2001), the ruff presents an ideal species for the study of functional genetic variation underlying phenotypic traits. However, genomic resources for the ruff are limited; only nine previously published microsatellite markers were
ª2013 The Authors.Ecology and Evolutionpublished by John Wiley & Sons Ltd.
This is an open access article under the terms of the Creative Commons Attribution License, which permits use, distribution and reproduction in any medium, provided the original work is properly cited.
available (Thuman et al. 2002) until the recent publications of Farrell et al. (2012) and Verkuil et al. (2012). As a step toward developing genomic resources for the ruff and to allow mapping of phenotypic traits, we performed linkage analysis of 58 microsatellites from 381 captive individuals comprising 64 families, and present here the resulting linkage map.
Methods
Mapping population
The genetic mapping population consisted of 381 individ-uals belonging to a captive population maintained by DBL over fourteen breeding years at Simon Fraser University, Canada. This population was established from 31 individuals raised from eggs collected on breeding grounds near Oulu, Finland in 1985, to which 63 addi-tional wild birds were added during the years up to 1990. In 2006, two faeders, one satellite male, and one female captured in the Netherlands were added to the captive population. The pedigree used in this project contains individuals from 64 families, with 62 fathers and 93 mothers, with hatch years extending from 1985 for the original parental generation to 2009 for the most recent chicks. Breeding records held by DBL and genotyping of several loci by SB McRae (SBM; East Carolina University) determined parentage prior to this study.
Microsatellite markers
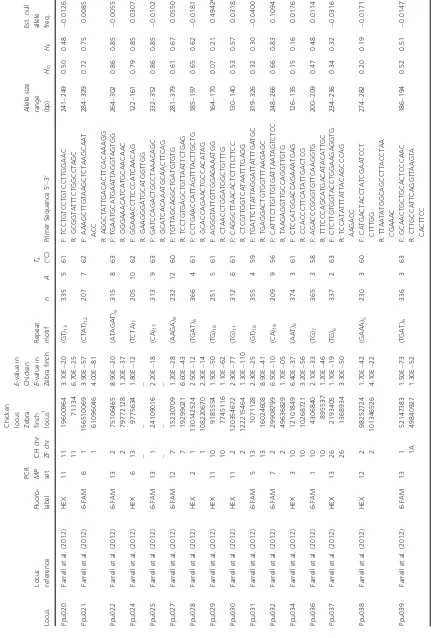
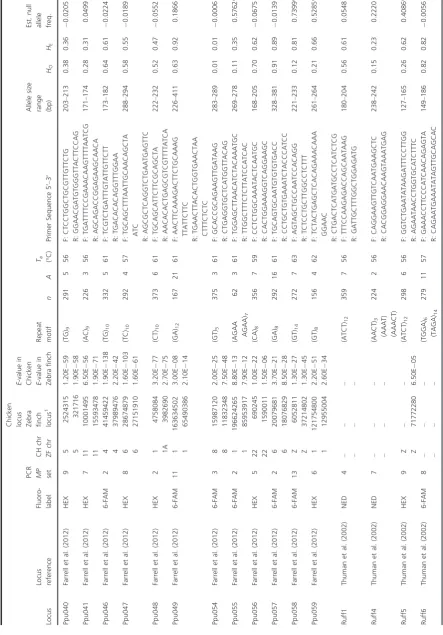
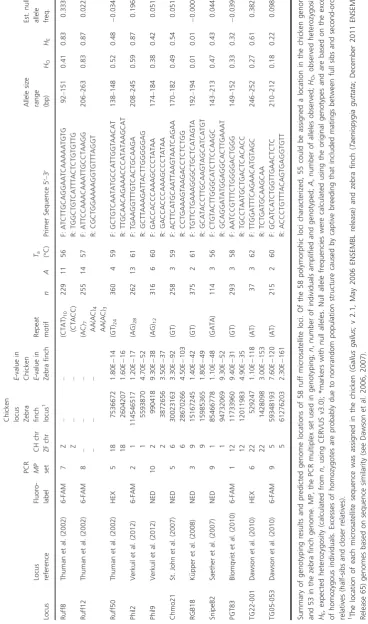
In total, 102 microsatellite markers were tested, of which 52 were found to be polymorphic and were developed and characterized (Farrell et al. 2012). Forty-seven of these were selected for linkage mapping and used together with 11 ruff loci previously developed for population genetic studies (Thuman et al. 2002; Verkuil et al. 2012), and 5 other shorebird loci identified from cross-utility testing in the ruff and many other avian species (Saether et al. 2007; St. John et al. 2007; Kupper et al. 2008; Blomqvist et al. 2010;€ Dawson et al. 2010), which had all been tested previously in the current population (Lank et al. 2013; S. B. McRae, unpublished). There is as yet no reference genome for the ruff; therefore, to verify the position of each microsatellite marker and ensure adequate spacing and complete genome coverage, we predicted microsatellite locations for all mark-ers in both the chicken and zebra finch genome assemblies (Table 1) by performing a search for sequence similarity using BLAST software via the ENSEMBL interface (www. ensembl.org), following approaches described elsewhere (Dawson et al. 2006, 2007). Chromosomal positions were plotted and visualized using MAPCHART (Voorrips 2002). Sequence data relating to the 63 markers were input into
MULTIPLEX MANAGERv.1.0 (Holleley and Geerts 2009) to optimize marker reactions and create 13 multiplex panel sets that were then used to genotype the 381 individuals contained within the ruff pedigree (Table 1).
DNA extraction and genotyping
We obtained DNA from blood and frozen tissue that had been collected from individuals and stored in absolute ethanol. Genomic DNA was extracted using an ammo-nium acetate precipitation method (Nicholls et al. 2000; Richardson et al. 2001). Each 2-lL PCR contained approximately 10 ng genomic DNA, 0.2 lmol/L of each primer, and 1 lL Qiagen Multiplex PCR Mix (Qiagen Inc). PCR amplification was performed using a DNA Engine Tetrad 2 Thermal Cycler (MJ Research, BioRad, UK) with the profile: 15 min at 95°C, followed by 35 cycles of 94°C for 30 sec, annealing temperature (Table 1) for 90 sec and 72°C for 1 min, then a final step of 60°C for 10 min. PCR products were loaded onto an ABI3730 Genetic Analyzer (Applied Biosystems) using ROX500 size standards, and genotypes were scored with GENEMAP-PER v4.0 software (Applied Biosystems). Observed and expected heterozygosities were calculated using CERVUS v3.0 (Kalinowski et al. 2007; Table 1). Deviations from Hardy–Weinberg equilibrium and linkage disequilibrium were assessed using GENEPOP v.4.0 (Rousset 2008). Four loci identified in ruffs (Ppu042, Ppu023, Ppu033, and
Ppu012; Farrell et al. 2012), and one primer set from
another species (Chmo06; St. John et al. 2007) failed to amplify in the genotyping multiplexes and were excluded from further analysis.
Pedigree assembly and linkage mapping
Parentage assignment was performed using genotypic data for all 58 microsatellite markers in 381 individuals (including 8% data replicates) using CERVUS v.3.0. The resulting parentage assignments were compared with the previous pedigree, held by DBL and SBM, for inconsisten-cies. Grandparent–Parent–Offspring genotypic inconsis-tences arising from incorrect parentage assignment or microsatellite genotyping errors were detected through a three-generation Pedigree Program (K. W. Kim, unpub-lished) and either resolved by rechecking the parentage and past genotyping records held by DBL and SBM, reviewing raw allele peaks on GENEMAPPER v.4.0 or, in any remaining cases of uncertainty, rescored as untyped.
Table 1. Summary of genotyping results (58 loci) and predicted genome locations (53 loci) of ruff microsatellite markers. Locus Locus reference Fluoro- label
PCR MP set
CH
chr
ZF
chr
Chicken locus Zebra finch locus
1
E
-value
in
Chicken E-value
in
Zebra
finch
Repeat motif
nA
Ta (°C)
Primer Sequence 5 ′– 3 ′ Allele size range (bp) HO HE Est. null allele freq. Ppu001 Farrell et al. (2012) HEX 7 1 1A 52975585 50776302 1.90E 138 3.30E 27 (TAGA) 12 227 7 5 6 F: ACCAGGCTTCTTCCCTCT GGA R: TGAAACTTCA CATTTTGGGGATGA 266 – 291 0.59 0.64 0.0519 Ppu003 Farrell et al. (2012) HEX 9 1 1 122413141 13670975 5.60E 61 1.20E 27 (CTAT) 11 296 6 5 6 F: CAGGATTGCTTTGGCTGG AG R: AGCATGTAGTGCT TCAGTTATTTA GATGC 365 – 374 0.59 0.56 0.0268 Ppu005 Farrell et al. (2012) 6-FAM 4 8 8 22771586 19350034 8.00E 108 4.40E 73 (TC) 5 287 8 5 6 F: GGAGCAATGTGATACCACTAAG G ACTG R: CTCCTGACCT CCACCGCAAC 217 – 233 0.39 0.57 0.2050 * Ppu006 Farrell et al. (2012) 6-FAM 1 5 5 17130526 16041469 2.70E 53 8.10E 70 (GT) 9 370 3 5 8 F: TGGAAGTGGAAGGAGGTCT GTG R: TCCACTCAGG TGCAGGCTTC 245 – 254 0.46 0.49 0.0319 Ppu007 Farrell et al. (2012) 6-FAM 9 3 3 76776326 76352543 4.00E 27 4.50E 52 (TG) 5 295 4 5 6 F: GCCAGAGTAGCAACAGTCAG TGC R: CCTATTCATGT CTCCAAGTTCAATCC 281 – 294 0.51 0.53 0.0171 Ppu008 Farrell et al. (2012) 6-FAM 7 – – – – – (CACA) 6 227 4 5 6 F: GAAGTTCCTCTTACCAAT TTGCTTGC R: TGACCTGCTGGT ACTCCACCAC 295 – 301 0.22 0.22 0.0076 Ppu009 Farrell et al. (2012) HEX 7 4 4 23020195 29737180 5.90E 64 3.70E 46 (ACAC) 6 173 16 56 F: TCTTTATGATGCTATTTGAG GGTTTGG R: AATGCCACTG CACCAGAAGTAGTC 419 – 472 0.73 0.88 0.0924 Ppu011 Farrell et al. (2012) HEX 1 3 3 57218799 49883043 3.40E 63 6.40E 43 (CA) 5 361 4 5 8 F: CGCACATCTGCTGTTGAGA AATC R: TGGACTGAAGGT GACTATTCTGCTG 215 – 224 0.48 0.45 0.0423 Ppu013 Farrell et al. (2012) HEX 8 3 3 18786830 18163845 1.40E 61 3.80E 63 (AG) 6 304 2 5 7 F: ACATGCTCCTCTTCCATTTG CAG R: TGCTCCATGGA ATCAAACATGG 222 – 229 0.53 0.49 0.0435 Ppu014 Farrell et al. (2012) 6-FAM 7 – 24 – 3112345 – 1.20E 30 (GTGT) 5 227 3 5 6 F: CAACCCCATCTCCTGGCT TTT R: CAGCTCGGTACATTGGT GCTTG 207 – 220 0.51 0.45 0.0639 Ppu015 Farrell et al. (2012) HEX 4 2 2 19888521 22065196 9.80E 27 1.70E 54 (CA) 5 300 5 5 6 F: GGTCCAGTTCTGTGTGCCAG TTT R: TGACTTTGGAGGT TGTTACTT ATTGTTGTC 242 – 247 0.48 0.64 0.1588 Ppu016 Farrell et al. (2012) HEX 12 1 1 166535076 65490386 1.10E 22 5.70E 13 (TCTC) 6 224 8 6 0 F: TCAGGCAGTGGGACTAGAT GATTG R: TCAAAGACTT CTGCAAAGTTA TTCTTCTAAGC 212 – 229 0.66 0.66 0.0037 Ppu017 Farrell et al. (2012) HEX 11 4 – 52883524 – 4.30E 11 – (TT) 7 179 3 6 1 F: GTTGGCCTGGACTCCGTCTG R: GTGCTACTGAA ATCGTCTGAT GTTGG 227 – 229 0.02 0.48 0.9122 * Ppu018 Farrell et al. (2012) HEX 9 2 2 61061152 71904153 1.90E 28 4.90E 38 (AGAT) 13 281 9 5 6 F: TGCCTTCTTACTTTCTCAATATT TG TGG R: AGAGATACAGTAAG CTTCGTATGA CAGACAC 242 – 274 0.79 0.79 0.0014 Ppu019 Farrell et al. (2012) HEX 2 3 – 84720681 – 7.60E 10 – (CA) 11 343 7 6 1 F: TAACCCACGAGTGGCTCT G R: GCTACTGGGTGC TGTTACTTCC 145 – 162 0.77 0.78 0.0128
ª2013 The Authors.Ecology and Evolutionpublished by John Wiley & Sons Ltd. 4633
[image:4.595.82.514.75.710.2]Table 1. Continued. Locus Locus reference Fluoro- label
PCR MP set
CH
chr
ZF
chr
Chicken locus Zebra finch locus
1
E
-value
in
Chicken E-value
in
Zebra
finch
Repeat motif
nA
Ta (°C)
[image:5.595.90.521.73.711.2]Table 1. Continued. Locus Locus reference Fluoro- label
PCR MP set
CH
chr
ZF
chr
Chicken locus Zebra finch locus
1
E
-value
in
Chicken E-value
in
Zebra
finch
Repeat motif
nA
Ta (°C)
Primer Sequence 5 ′– 3 ′ Allele size range (bp) HO HE Est. null allele freq. Ppu040 Farrell et al. (2012) HEX 9 5 5 2524315 321716 1.20E 59 1.90E 58 (TG) 9 291 5 5 6 F: CTCCTGGCTGCGT TGTTCTG R: GGAACGATGTGGG TTACTTCCAG 203 – 213 0.38 0.36 0.0205 Ppu041 Farrell et al. (2012) HEX 7 1 1 11 10001495 15593478 6.50E 56 1.90E 71 (AC) 9 226 3 5 6 F: TGATTTTCCGAAACA AGTTTTAATCG R: AGCAGACCGGAGAAG CAACA 171 – 174 0.28 0.31 0.0499 Ppu046 Farrell et al. (2012) 6-FAM 2 4 4 41459422 37989476 1.90E 138 2.20E 42 (TG) 10 332 5 6 1 F: TCGTCTGATTTGT ATTGTTCTT R: TGACACACAGGTT TGGAA 173 – 182 0.64 0.61 0.0224 Ppu047 Farrell et al. (2012) HEX 8 6 6 28674879 27151910 1.60E 103 1.60E 61 (TC) 10 292 4 5 7 F: TGCAGCTTTAA TTGCAACAGCTA ATC R: AGCGCTCAGGTCTG AATGAGTTC 288 – 294 0.58 0.55 0.0189 Ppu048 Farrell et al. (2012) HEX 2 1 1A 4758084 3982690 3.20E 77 2.70E 75 (CT) 10 373 6 6 1 F: TGCAGCATTCT TCGCAGCTA R: AACACACTGAGCG TCGTTTTATCA 222 – 232 0.52 0.47 0.0552 Ppu049 Farrell et al. (2012) 6-FAM 11 1 1 163634502 65490386 3.00E 08 2.10E 14 (GA) 12 167 21 61 F: AACTTCAAAGACT TCTGCAAAG TTATTCTTC R: TGAACTTACACTG GTGAACTAA CTTTCTCTC 226 – 411 0.63 0.92 0.1866 Ppu054 Farrell et al. (2012) 6-FAM 3 8 8 15987120 11832348 2.00E 25 7.50E 48 (GT) 5 375 3 6 1 F: GCACCGCAGAAG TTGATAAG R: CTGAGGTGCTCATGG TTACAG 283 – 289 0.01 0.01 0.0006 Ppu055 Farrell et al. (2012) 6-FAM 2 1 1 196624265 85953917 8.80E 13 7.90E 12 (AGAA AGAA) 7 62 3 6 1 F: TGGAGCTTAACA TCTACAAATGC R: TTGGCTTTCTCTTA TCCATCAC 269 – 278 0.11 0.35 0.5762 * Ppu056 Farrell et al. (2012) HEX 5 2 2 22 690245 1590011 1.00E 22 1.50E 06 (CA) 8 356 7 5 9 F: CCTCTGGCAAA TACTCAATGC R: CACTGGAAAGGTC AGGAAGC 168 – 205 0.70 0.62 0.0675 Ppu057 Farrell et al. (2012) 6-FAM 2 6 6 20079681 18076829 3.70E 21 8.50E 28 (GA) 8 292 16 61 F: TGCAGTGCAATGT GTGTGACC R: CCTGCTGTGAAATCT ACCCATCC 328 – 381 0.91 0.89 0.0139 Ppu058 Farrell et al. (2012) 6-FAM 13 Z Z 6052811 37214802 1.30E 27 1.30E 45 (GT) 14 272 7 6 3 F: AGTAGCTGCCAAT CCACAGG R: TCTCCTGCTTGGCC TCTTT 221 – 233 0.12 0.81 0.7399 * Ppu059 Farrell et al. (2012) HEX 6 1 1 121754800 12955004 2.20E 51 2.60E 34 (GT) 8 156 4 6 2 F: TCTACTGAGCT CACAGAAACAAA GGAAC R: CTGACTCATGATGCCT CATCTCG 261 – 264 0.21 0.66 0.5285 * Ruff1 Thuman et al. (2002) NED 4 – – – – – – (ATCT) 12 359 7 5 6 F: TTTCCAAGAGACCAG CAATAAG R: GATTGCTTTGGCTGGA GATG 180 – 204 0.56 0.61 0.0548 Ruff4 Thuman et al. (2002) NED 7 – – – – – – (AACT) 3 (AAAT) (AAACT) 224 2 5 6 F: CAGGAAGTTGTCAAT GAAGCTC R: CACGGAGGAACAA GTAAATGAG 238 – 242 0.15 0.23 0.2220 Ruff5 Thuman et al. (2002) HEX 9 Z Z – 71772280 – 6.50E 05 (ATCT) 12 298 6 5 6 F: GGTCTGAATATAAG ATTTCCTTGG R: AGAATAACCTGGT GCATCTTTC 127 – 165 0.26 0.62 0.4086 * Ruff6 Thuman et al. (2002) 6-FAM 8 – – – – – – (TGGA) 6 (TAGA) 14 279 11 57 F: GAAACCTTCCCAT CAACAGAGTA R: CAGAATGAAATA TAGTTGCAGCAC 149 – 186 0.82 0.82 0.0056
ª2013 The Authors.Ecology and Evolutionpublished by John Wiley & Sons Ltd. 4635
[image:6.595.74.518.73.709.2]Table 1. Continued. Locus Locus reference Fluoro- label
PCR MP set
CH
chr
ZF
chr
Chicken locus Zebra finch locus
1
E
-value
in
Chicken E-value
in
Zebra
finch
Repeat motif
nA
Ta (°C)
[image:7.595.79.448.78.703.2]any noninformative individuals. A two-point linkage analysis of all markers was then performed based on a LOD score > 3.0. Markers were also assumed to be linked if they were supported by a LOD>2.0 and an expectation of linkage based on a priori knowledge (Slate et al. 2002), that is, linkage was expected based on BLAST search (Altschul et al. 1997) and assignment of chromosomal location in chicken and zebra finch (Daw-son et al. 2006, 2007). Linkage groups were created using AUTOGROUP and markers belonging to the same linkage group were analyzed using the BUILD command. PUK_LIKE_TOL and PK_LIKE_TOL values were lowered from 3.0 to 2.0, and then 2.0 to 1.0, and the BUILD command rerun until no further markers were added. Marker order was determined and confirmed by the FLIPS command, where new marker orders were tested against alternative orders to determine whether they fitted the data. Recombination frequencies and positions of all loci in linkage groups were visualized using the CHROMPIC function. During map construction, both sex-averaged and sex-specific maps were built; however, only the sex-averaged maps per linkage group are presented, with map distances based on the Kosambi mapping function.
Genome coverage
The mean marker spacing was calculated by dividing the total length of the map by the number of intervals. Aver-age intramarker spacing for each linkAver-age group was calcu-lated by dividing the length of each linkage group by the total number of intervals on that linkage group. Linkage map coverage was calculated by summing the difference in base-pair position in chicken of the first and last inter-val on each linkage group, and dividing by the total base-pair length of the chicken genome (~1.07 Gb; Ensembl database www.ensembl.org/Gallus_gallus/index.html).
Results and Discussion
Based on comparative mapping methods of microsatellite loci homologous to the ruff, chicken, and zebra finch, homologs of 55 of the 58 typed microsatellite loci were assigned predicted chromosomal locations in the chicken genome and 53 were assigned locations in the zebra finch (Table 1). Five ruff microsatellite sequences (Ppu008,
Ruff1, Ruff4, Ruff6, and Ruff12) could not be assigned
predicted chromosomal locations in either genome based on sequence similarity.
Ppu021 0.0
Ppu048 100.0
Ppu001 138.7
Ppu025 179.8
Ppu028 248.4
Ppu039 314.5
Phil2 414.5
Ppu049 458.0
Ruff1
488.7
Ppu1
Ppu022 0.0
Ppu018 23.6
Ppu038 46.8
Ppu2
Ppu047 0.0
Chmo21 17.4
Ppu6
Ppu027 0.0
Ppu008 10.1
Ppu7
GgaRGB18 0.0
Ppu9
Ppu036 0.0
Ppu034 18.4
Ppu10
PGT83 0.0
Ppu12
Ruff6
0.0
Ppu031 19.6
Ppu024 36.0
Ppu13
Ruff5 0.0
Ppu18
Ppu014 0.0
Ppu24
Ppu037 0.0
Ppu26
Ruff5 0.0
Ruff8
24.2
[image:8.595.57.529.389.628.2]PpuZ
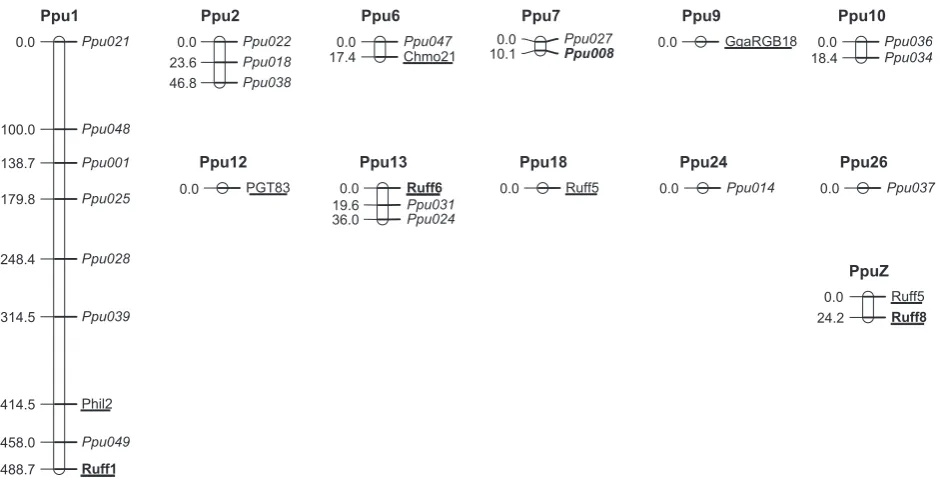
Figure 1. A first-generation linkage map of the ruff (Philomachus pugnax) consisting of seven linkage groups and five single markers ordered by homologous chromosome size. Positions given in centimorgan. Linkage groups with marker order supported by either LOD>3.0, or LOD>2.0 in agreement with a predicted location are presented, as well as single-marker loci assigned locations on chromosomes. Loci in italics are described in Farrell et al. (2012); loci underlined are cross-utility shorebird loci (Thuman et al. 2002; Kupper et al. 2008; St. John et al. 2007; Blomqvist€ et al. 2010; Verkuil et al. 2012). Loci in bold are four loci previously unassigned a chromosomal location by a predictive mapping method that are here assigned a chromosomal location via linkage analysis.
ª2013 The Authors.Ecology and Evolutionpublished by John Wiley & Sons Ltd. 4637
The first-generation linkage map of the ruff consisted of 23 microsatellite markers resolved into 7 linkage groups (Ppu1, Ppu2, Ppu6, Ppu7, Ppu10, Ppu13, and PpuZ) homologous to chicken and zebra finch chromo-somes. Each linkage group was numbered according to the homologous chicken and zebra finch chromosome number (with the prefix Ppu; Fig. 1). An additional five loci were not expected to be linked to any other marker, based on predicted genomic locations. This expectation was confirmed by the two-point analysis, and so these were treated as linkage groups with a single marker (Fig. 1). The remaining 30 markers were expected to form linkage groups, but were found to be unlinked to all other markers. The map covers 641.6 cM with an average spacing of 22.9 cM. The size of linkage groups, ignoring
those that consisted of a single marker, ranged from 10.1 to 488.7 cM. The number of markers per linkage group varied from 2 to 9. The intermarker interval for each linkage group varied from 5.0 to 54.3 cM, with a mean of 16.7 cM.
Four of the markers that lacked predicted genomic loca-tions were subsequently assigned to chromosomes on the basis of the linkage mapping: Ruff1, Ruff6, Ppu008, and
Ruff8 were assigned to chromosomes Ppu1, Ppu13, Ppu7,
and Z, respectively.Ruff8 was known to be Z-linked from previous work by Thuman et al. (2002); however, its genomic location on chromosome Z is reported here for the first time. Chromosomes Ppu1A, Ppu3, Ppu4, Ppu5, Ppu8, Ppu11 and Ppu22 were all predicted to contain more than one typed marker; yet, linkage groups could
Ppu027
Ppu008
Ppu7
Ppu027
Ppu023
Gga7
Ppu023
Ppu027
Tgu7
Ppu036 Ppu034
Ppu10
Ppu036
Chmo06
Ppu029 Ppu034
Gga10
Ppu036
Chmo06
Ppu029 Ppu034
Tgu10
Ruff6
Ppu031 Ppu024
Ppu13
Ppu031 Ppu024
Gga13
Ppu031
Tgu13
Ppu021 Ppu048 Ppu001 Ppu025
Ppu028 Ppu039
Phil2
Ppu049
Ruff1
Ppu1
Ppu048
Ppu025
Ppu039 Ppu001
SnipeB2
Phil2
Ppu059 Ppu003 Ppu028
Ppu021 Ppu049 Ppu016
Ppu055
Gga1
Ppu048
Ppu039 Ppu001
Phil2
Ppu059 Ppu003
Ppu021 Ppu016Ppu049
Ppu055
SnipeB2
Ppu028
Tgu1A
Ppu022 Ppu018
Ppu038
Ppu2
Phil9
Ppu015 Ppu032
Ppu018 Ppu022
Ppu038
Ppu030
Gga2
Phil9
Ppu015
Ppu032
Ppu018 Ppu022
Ppu038
Ppu030
Tgu2
Ppu047
Chmo21
Ppu6
Ppu057 Ppu047
Chmo21
Gga6
Ppu057 Ppu047
Chmo21
Tgu6
Ruff5
Ruff8
PpuZ
Ppu058
GgaZ
Ppu058
Ruff5
[image:9.595.66.534.261.652.2]TguZ
Figure 2. A comparative map of microsatellite loci in ruff (Ppu; Philomachus pugnax), chicken (Gga; Gallus gallus), and zebra finch (Tgu;
not be formed. There are two possible explanations for the failure to assign the markers to these chromosomes. First, the pedigree may have been insufficiently powerful to map all linked markers, especially if they were relatively far apart on a chromosome. Second, the predicted chromo-somal locations may not be an accurate indication of the true locations; in other words, synteny may not be highly conserved between ruffs and other birds. Given that no mapped markers were assigned to locations other than their predicted locations, we believe that the failure to assign markers to these chromosomes is an issue of power rather than poorly conserved synteny.
Following the methods of Backstr€om et al. (2008), we used available physical data on the chicken genome to cal-culate the proportion of the ruff genome covered by the map. The distance on the chicken genome assembly between the homologs of the most distal markers on each ruff linkage group was estimated, and summing across chromosomes was found to be 270 Mb, or 26% of the total
~1.07 Gb chicken genome (Ensembl database www.ensem-bl.org/Gallus_gallus/index.html). However, additional seq-uence is covered by the ruff map if the five chromosomes with single markers and the sequence immediately beyond the first and last markers on each linkage group are included. Assuming the ruff has a similar genome size to the chicken (http://www.genomesize.com/), it may be esti-mated that our map covers 30–35% of the ruff genome. The proportion of the total genetic (i.e., recombination) length of the ruff genome covered by the map is harder to assess, as the microchromosomes are mostly unmapped. Although microchromosomes are physically short and con-tribute little to the physical genome size, they each have an obligate crossing-over event during meiosis, which contrib-utes 50 cM to the total map length (Jones and Frankin 2006). Thus, compared with its coverage of the physical genome, the map must cover a lower proportion of the total linkage (recombination) map length of the ruff gen-ome.
Despite the highly conserved synteny generally believed to exist among avian genomes (Griffin et al. 2007), com-parative mapping among the homologs of chicken, zebra finch, and ruff microsatellite loci results in three possible intrachromosomal rearrangements being reported for the first time on chromosome 1 (involving loci Ppu001,
Ppu021, and Ppu028), chromosome 2 (loci Ppu018 and
Ppu022) and chromosome 7 (loci Ppu023 and Ppu027;
Fig. 2). These types of rearrangements were once thought to be relatively rare in birds (Stapley et al. 2008). However, with the recent sequencing of the turkey (Meleagris gallop-avo) genome, comparative analyses between the turkey, zebra finch (Taeniopygia guttata), and chicken (Gallus
gallus) have identified a large number of
intrachromoso-mal rearrangements, reflective of avian genome evolution
(Skinner and Griffin 2012). Therefore, these regions are of evolutionary interest in the ruff.
In summary, the map of seven linkage groups and length 641.6 cM covers an estimated 30–35% coverage of the ruff genome. It is the first linkage map of any shore-bird species and will be of utility, even at this low density, as previous studies with approximately 30% map coverage have met with some success in the mapping of pheno-typic loci (Miwa et al. 2006). Thus, this map has the potential to provide an essential framework for further studies mapping important behavioral and plumage traits in this species.
Acknowledgments
During this work, Lindsay L. Farrell was a PhD student in the Department of Biological Sciences at Simon Fraser University, Canada. The laboratory work was performed at the University of Sheffield and supported by the UK Biotechnology and Biological Sciences Research Council. Deborah Dawson provided advice on marker selection, BLAST mapping and data validation. Special thanks to Sue McRae for guidance in the early days of genotyping and assembling the ruff pedigree, and for providing DNA sam-ples for missing individuals in the pedigree. The captive ruff colony was supported by the Natural Sciences and Engineering Research Council of Canada (NSERC; to D. B. Lank) and L. L. Farrell was supported by an NSERC PGS-D3.
Conflict of Interest
None declared.
References
Altschul, S. F., T. L. Madden, A. A. Sch€affer, J. Zhang,
W. Miller, and D. J. Lipman. 1997. Gapped BLAST and PSI-BLAST: a new generation of protein database search
programs. Nucleic Acids Res. 25:3389–3402.
Backstrom, N., N. Karaiskou, E. H. Leder, L. Gustafsson,€
C. R. Primmer, A. Qvarnstr€om, et al. 2008. A gene-based
genetic linkage map of the collared flycatcher (Ficedula
albicollis) reveals extensive synteny and gene-order conservation during 100 million years of avian evolution.
Genetics 179:1479–1495.
Blomqvist, D., A. Pauliny, M. Larsson, and L.A. Flodin. 2010.
Trapped in the extinction vortex? Strong genetic effects in a declining vertebrate population. BMC Evol. Biol. 33:
1471–2148.
Dale, J., D. B. Lank, and H. K. Reeve. 2001. Signalling individual identity versus quality: a model and case studies
with ruffs, queleas, and house finches. Am. Nat. 158:75–86.
Dawson, D. A., T. Burke, B. Hansson, J. Pandhal, M. C. Hale, G. H. Hinten, et al. 2006. A predicted microsatellite map of
ª2013 The Authors.Ecology and Evolutionpublished by John Wiley & Sons Ltd. 4639
the passerine genome based on chicken–passerine sequence
similarity. Mol. Ecol. 5:1299–1320.
Dawson, D. A., M.Akesson, T. Burke, J. M. Pemberton, J. Slate,
and B. Hansson. 2007. Gene order and recombination rate in homologous chromosome regions of the chicken and a
passerine bird. Mol. Biol. Evol. 7:1537–1552.
Dawson, D. A., G. J. Horsburgh, C. K€upper, I. R. K. Stewart,
A. D. Ball, K. L. Durrant, et al. 2010. New methods to identify conserved microsatellite loci and develop primer
sets of high utility–as demonstrated for birds. Mol. Ecol.
Resour. 10:475–494.
Farrell, L. L., D. A. Dawson, G. J. Horsburgh, T. Burke, and D. L. Lank. 2012. Isolation, characterisation and predicted
genome locations of ruff (Philomachus pugnax, AVES)
microsatellite loci. Conserv. Genet. Resour. 24:763–771.
Green, P., K. Falls, and S. Crooks. 1990. CRIMAP
Documentation, version 2.4. Washington University School of Medicine, St. Louis, MO.
Griffin, D. K., L. B. W. Robertson, H. G. Tempest, and B. M. Skinner. 2007. The evolution of the avian genome as revealed by comparative molecular cytogenetics. Cytogenet.
Genome Res. 117:64–77.
Hogan-Warburg, A. J. 1966. Social behavior of the ruff (Philomachus pugnax). Ardea 54:108–229.
H€oglund, J., and A. Lundberg. 1989. Plumage color correlates
with body size in the ruff (Philomachus pugnax). Auk
106:336–338.
Holleley, C. E., and P. G. Geerts. 2009. Multiplex Manager 1.0: a cross-platform computer program that plans and
optimizes multiplex PCR. Biotechniques 7:511–517.
Jones, G. H., and C. Frankin. 2006. Meiotic crossing-over:
obligation and interference. Cell 126:246–248.
Jukema, J., and T. Piersma. 2006. Permanent female mimics in
a lekking shorebird. Biol. Lett. 2:161–164.
Kalinowski, S. T., M. L. Taper, and T. C. Marshall. 2007. Revising how the computer program CERVUS accommodates genotyping error increases success in
paternity assignment. Mol. Ecol. 16:1099–1106.
K€upper, C., T. Burke, T. Szekely, and D. A. Dawson. 2008.
Enhanced cross-species utility of conserved microsatellite
markers in shorebirds. BMC Genomics 9:502–522.
Lank, D. B., C. M. Smith, O. Hanotte, T. Burke, and F. Cooke. 1995. Genetic polymorphism for alternative mating
behaviour in lekking male ruff,Philomachus pugnax. Nature
378:59–62.
Lank, D. B., L. L. Farrell, T. Burke, T. Piersma, and S. B. McRae. 2013. A dominant allele controls development into female
mimic male and diminutive female ruffs. Biol. Lett. (in press).
Miwa, M., M. Inoue-Murayama, N. Kobayashi, B. B. Kayang, M. Mizutani, H. Takahashi, et al. 2006. Mapping of panda plumage colour locus on the microsatellite linkage map of
the Japanese quail. BMC Genet. 7:1471–2156.
Nicholls, J. A., M. C. Double, D. M. Rowell, and D. Magrath. 2000. The evolution of cooperative and pair breeding in
thornbillsAcanthiza(Pardalotidae). J. Avian Biol. 31:165–176.
Richardson, D. S., F. L. Jury, K. Blaakmeer, J. Komdeur, and T. Burke. 2001. Parentage assignment and extra-group paternity in a cooperative breeder: the Seychelles warbler (Acrocephalus sechellensis). Mol. Ecol. 10:2263–2273. Rousset, F. 2008. GENEPOP’007: a complete
re-implementation of the GENEPOP software for Windows
and Linux. Mol. Ecol. Resour. 8:103–106.
Saether, S. A., P. Fiske, J. A. Kalas, A. Kuresoo, L. Luigujoe,
S. B. Piertney, et al. 2007. Inferring local adaptation from
QST–FSTcomparisons: neutral genetic and quantitative trait
variation in European populations of great snipe. J. Evol.
Biol. 20:1563–1576.
Skinner, B. M., and D. K. Griffin. 2012. Intrachromosomal rearrangements in avian genome evolution: evidence for
regions prone to breakpoints. Heredity 108:37–41.
Slate, J., P. M. Visscher, S. MacGregor, D. R. Stevens, M. L. Tate, and J. M. Pemberton. 2002. A genome scan for
QTL in a wild population of red deer (Cervus elaphus).
Genetics 162:1863–1873.
St. John J., R. F. Kysela and S. J. Oyler-McCance. 2007. Characterization of microsatellite loci isolated in mountain
plover (Charadrius montanus). Mol. Ecol. Resour. 7:802–804.
Stapley, J., T. R. Birkhead, T. Burke, and J. Slate. 2008. A
linkage map of the zebra finchTaeniopygia guttataprovides
new insight into avian genome evolution. Genetics
179:651–667.
Thuman, K. A., F. Widemo, and S. B. Piertney. 2002.
Characterization of polymorphic microsatellite DNA markers
in the ruff (Philomachus pugnax). Mol. Ecol. Notes 2:276–277.
Van Rhijn, J. G. 1973. Behavioural dimorphism in male ruffs
Philomachus pugnax(L.). Behaviour 47:153–229. Verkuil, Y. I., T. Piersma, J. Jukema, J. C. Hooijmeijer,
E. W. Zwarts, and A. J. Baker. 2012. The interplay between habitat availability and population differentiation: a case study on genetic and morphological structure in an inland
wader (Charadriiformes). Biol. J. Linn. Soc. 106:641–656.
Voorrips, R. E. 2002. MapChart: software for the graphical