transcriptome–phenotype relationship
.
White Rose Research Online URL for this paper:
http://eprints.whiterose.ac.uk/110281/
Version: Accepted Version
Article:
Harrison, P.W., Wright, A.E. and Mank, J.E. (2012) The evolution of gene expression and
the transcriptome–phenotype relationship. Seminars in Cell & Developmental Biology, 23
(2). pp. 222-229. ISSN 1084-9521
https://doi.org/10.1016/j.semcdb.2011.12.004
Reuse
This article is distributed under the terms of the Creative Commons Attribution-NonCommercial-NoDerivs (CC BY-NC-ND) licence. This licence only allows you to download this work and share it with others as long as you credit the authors, but you can’t change the article in any way or use it commercially. More
information and the full terms of the licence here: https://creativecommons.org/licenses/
Takedown
If you consider content in White Rose Research Online to be in breach of UK law, please notify us by
The evolution of gene expression and the transcriptome–
phenotype relationship
Peter W. Harrison1, Alison E. Wright1, and Judith E. Mank*
University of Oxford, Edward Grey institute, Department of Zoology, South Parks Road, Oxford OX1 3PS, United Kingdom
Abstract
Changes in gene expression underlie the adaptive evolution in many complex phenotypes, and the recent increase in the availability of multi-species comparative transcriptome data has made it possible to scan whole transcriptomes for loci that have experienced adaptive changes in expression. However, despite the increase in data availability, current models of gene expression evolution often do not account for the complexities and inherent noise associated with
transcriptome data. Additionally, in contrast to current models of gene sequence evolution, models of transcriptome evolution often lack the sophistication to effectively determine whether
transcriptional differences between species or within a clade are the result of neutral or adaptive processes. In this review, we discuss the tools, methods and models that define our current understanding of the relationship between gene expression and complex phenotype evolution. Our goal is to summarize what we know about the evolution of global gene expression patterns underlying complex traits, as well to identify some of the questions that remain to be answered.
Keywords
Gene expression evolution; Adaptive evolution; Transcriptomics; Gene regulation; Complex phenotypes
1. The Genome–phenotype relationship and gene expression evolution
Phenotypes are encoded by genes, and the vast majority of heritable changes in phenotypes are caused by changes in DNA. This simple statement obscures the deeply complex relationship between DNA and phenotypes, a relationship that involves several types of molecules, signalling patterns and interactions. Phenotypic evolution can therefore occur through a variety of mechanisms, sometimes divided dichotomously into structural versus regulatory. Changes in coding sequence result in altered protein forms, with different folding structures, activity or other properties that result in functional phenotypic variation [1]. Regulatory changes do not alter the protein structure, rather the amount of protein produced, and can influence phenotypes by altering the volume, timing or tissue of expression [2].
Many examples of adaptive phenotypic change have been shown to be due to changes in protein coding sequence, and this is an important, and arguably the classical evolutionary mechanism of adaptation. Powerful and nuanced models of sequence evolution exist that allow us to scan gene sequence data for regions of adaptive evolution [3]. These models,
© 2011 Elsevier Ltd. All rights reserved. Author Manuscript
Semin Cell Dev Biol. Author manuscript; available in PMC 2012 October 01.
Published in final edited form as:
Semin Cell Dev Biol. 2012 April ; 23(2): 222–229. doi:10.1016/j.semcdb.2011.12.004.
Europe PMC Funders Author Manuscripts
combined with the explosion of sequence data in recent years at both the species and population level, have made possible whole-genome scans for changes in gene sequence and polymorphism indicating the locus of phenotypic changes [4–8].
However, there is a growing body of work showing that in some cases where gene sequence is functionally conserved, gene regulation modifications can cause the major phenotypic differences that underlie adaptive change. For example, adaptive camouflage in beech mice [9], melanisation in Drosophila [10], beak morphology in Darwin’s finches [11] have all been shown to be the result of gene expression changes rather than changes in protein structure. These studies represent compelling evidence for the role of gene regulation in phenotypic evolution.
The above examples of phenotypic change due to gene expression are primarily due to changes in the expression of a single locus of very large effect, and most of these cases were discovered via candidate gene or QTL methods. However, many phenotypes are far more complex, especially where multiple phenotypes are expressed within a single species. For example, the polyphenism underlying ant castes is due to complex suites of hundreds of genes [12,13]. Condition-dependent phenotypes [14] and sex-specific phenotypes [15] are also composed of hundreds of loci, and broad expression changes can be detected in response to a range of environmental and developmental factors [16]. In these cases, candidate gene and QTL methods lack sufficient power or are wholly inappropriate for identifying the suites of genes and regulatory loci underlying adaptive evolution of these traits.
In order to understand how these types of phenotypes are encoded, and more broadly how they evolve among lineages, we require comparative transcriptomics in conjunction with models of gene expression evolution. This permits transcriptome-wide scans for loci showing accelerated rates of change, a similar approach to models of sequence evolution that are implemented on coding regions. Just as the next-generation sequencing revolution has reshaped the research horizon in DNA sequencing abilities, so too has it reshaped our ability to quantify the expression of all the genes expressed in a given tissue, with or without a prior reference genome sequence.
Although the next-generation sequencing revolution has facilitated the generation of transcriptomic data, the models with which to study gene expression evolution are less sophisticated than those used to understand changes in coding sequence. For example, consensus has yet to be reached regarding the null model of neutral evolution for gene expression. This is a key requirement, as an accurate and robust null model is the necessary first step in differentiating loci that have undergone rapid adaptive change from those where change is due to genetic drift. At this point, these alternative explanations are often
indistinguishable [17]. Additionally, the regulatory changes underlying the evolution of complex phenotypes remain largely unknown at this point. For instance, although maleness and femaleness are ancient phenotypes, the gene expression patterns underlying them can vary extensively even among closely related species [18–21]. Changes in these phenotypes presumably are due to the observed differences in sex-specific expression, but the direct link remains elusive.
2. Studies of gene expression evolution for understanding complex
phenotypes
The first step in understanding the gene expression changes underlying the adaptive
evolution of complex phenotypes is scanning comparable transcriptome data for specific loci that show differences in expression. Observed differences are due to two alternate processes.
Europe PMC Funders Author Manuscripts
Large differences in expression between taxa, populations or lineages can result entirely from neutral processes related to genetic drift, where relaxation of evolutionary constraints results in non-adaptive changes. Alternatively, adaptive changes in expression, resulting from positive selection for advantageous traits, can also cause large changes in gene expression over evolutionary time. Determining whether differences in gene expression are the result of neutral or adaptive evolution is a challenging and important problem, as these alternatives have significant implications as to the nature of mutation, selection and evolutionary change.
Studying the evolution of gene regulation requires models based on different evolutionary predictions. The data can then be tested against these models to explain the observed pattern and identify outliers that may represent loci changing at accelerated rates, either due to adaptive or neutral evolution. For such studies of transcriptome evolution, the validity of the conclusions relies heavily on the robustness of the null neutral model. Despite its
importance, parameters of the model, such as the mutation rate and level of constraint, remain difficult to define. Current approaches to infer the mode of transcriptome evolution can be broadly divided into pairwise methods that test expression divergence between two related taxa, and multiple taxa approaches that additionally infer the relative rate of expression among related lineages over evolutionary timescales.
2.1. Pairwise tests of gene expression evolution
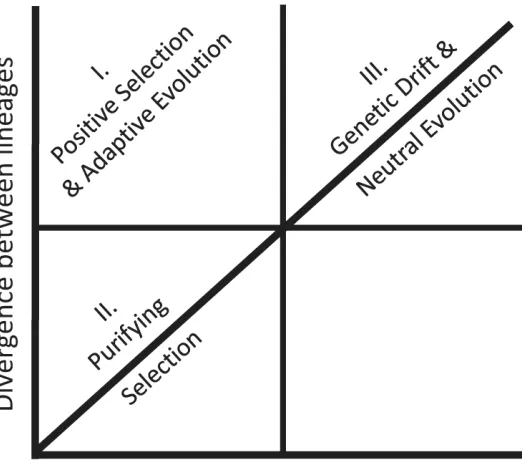
The neutral theory of genetic evolution [22] predicts that selectively neutral changes are based solely on the underlying mutation rate [23]. Mutation leads to polymorphism, which can be inferred in expression data through intra-population expression variation. When applied to expression data, with all factors such as effective population size and mutation rate being equal, genetic drift explains instances where variation in expression within lineages is equal or exceeds divergence between them. Genes where expression divergence and variation are both low are shaped primarily by purifying selection. Finally, sites evolving by positive selection have higher levels of divergence than polymorphism in expression, as variation in expression is removed due to selection acting to maintain the optimal phenotype. Therefore, the different selective pressures can be inferred
experimentally by calculating the ratio of within to between population variation in expression for a given locus (Fig. 1).
Applying these models to transcriptomic data requires multiple replicates for each assessed taxon in order to estimate expression variance. Using this approach with two species of killifish, Oleksiak et al. [24] demonstrated that far more variation was detected within species than between them, indicating that most gene expression evolves under neutral expectations of genetic drift. This neutral expectation was then used to identify loci that departed significantly from the model, allowing the identification of a number of genes related to temperature tolerance that showed high divergence between species but low variation within. Similarly, Rifkin et al. [25] scanned expression data from replicate populations of Drosophila melanogaster and outgroup populations of D. simulans and D. yakuba by classifying genes into three different quadrants outlined in Fig. 1. This study tested neutral evolution by elimination, rather than testing deviations from a null neutral model directly. In doing so, the authors concluded that only 17% of genes were consistent with a neutral model, whereas 44% fit the model of purifying selection, and 39% of genes were consistent with positive selection. The distribution of genes among the three classes suggested that although purifying selection was most prominent, genes with both adaptive and neutral evolutionary changes could be differentiated.
Unlike the previous two studies above, Lemos et al. [26] used data from mammals and Drosophila to explicitly test expression data against a null neutral model, albeit one based on
Europe PMC Funders Author Manuscripts
a number of assumptions. Mutational variance, the per generation increase in variance solely resulting from mutation, is a key component of the null neutral model but difficult to measure explicitly in expression data. Instead, it was assumed that the mutational variance affecting gene expression could be estimated from other quantitative traits, such as
Drosophila alcohol dehydrogenase activity, bristle number and viability. In order to establish the minimum and maximum rates of gene expression divergence that could still be
considered neutral, the authors combined these phenotype estimates of mutation with the assumption that environmental variance accounts for half of the within-population variance. Genes that diversified less than neutral predictions were assumed to be shaped by purifying selection, whereas those that diversified more were categorised as evolving under directional selection. Under this model, stabilising selection acting within species was found to be the dominant evolutionary force shaping gene expression.
Pairwise studies such as these are useful for identifying loci that differ between two related taxa, and have an advantage in that they do not require the estimation of an ancestral gene expression state at internal nodes of a phylogeny. However, they represent a rather narrow view of evolutionary history. To broaden the evolutionary window of gene expression evolution, a phylogenetic history of expression employing multiple taxa is required.
2.2. Multiple taxa and relative rates in gene expression evolution
An alternative to the studies discussed thus far is to assess the relative rate of evolution across multiple taxa within a phylogenetic context, thereby creating a more dynamic understanding of gene expression evolution across clades. Just as models of sequence evolution require the inference of ancestral proteins, multi-species studies of gene expression evolution require the estimation of ancestral gene expression from the levels observed in extant descendant species. However, unlike phylogenetic models of gene sequence evolution, where ancestral protein sequences have some experimental validation [27], no such validation exists for inference of ancestral gene expression levels, making this key parameter largely untested.
By incorporating a measure of divergence time into the null neutral model Khaitovich et al. [28] showed that divergence between primate species in brain-expressed genes accumulate approximately linearly with time, consistent with neutral evolution. Importantly, the microarrays that formed the technological basis of this study were species-specific, and data from species-specific arrays cannot be easily compared. Gilad et al. [29] partly overcame this problem by using multi-species arrays, and did not find evidence for a linear trend of divergence with time in primates, rather a pattern dominated by purifying selection and little expression change among species.
Multi-species studies have also demonstrated that constraints in gene expression, and therefore the degree that the transcriptome is shaped by purifying selection, are somewhat defined by tissue. Rates of sequence evolution vary by tissue in mammals [17], with neurological transcriptomes evolving slower than reproductive ones. Additionally, broadly expressed genes show lower divergence rates than genes with narrower or tissue-specific expression [30,31], consistent with conclusions that pleiotropic forces resulting from broad expression act to constrain gene expression change [32]. These studies suggest that a single neutral model of gene expression evolution may not be possible, rather tissue-specific models may be required.
In addition to tissue-specific patterns, the pattern of gene expression evolution is also influenced by regulatory differences. For example, up- and down-regulation may be governed by different evolutionary factors and therefore may have different implications for adaptive phenotypic change. In primate neurological samples, up-regulation of expression is
Europe PMC Funders Author Manuscripts
less frequent but of greater magnitude than down-regulation [33], suggesting that major innovations, such as human cognition, may be attributed to the lineage-specific up-regulation of a few genes. This result has been upheld even when improved models were implemented on the same data [34]. Incidentally, the costs of up- and down-regulation may differ, offering a potential explanation for the observed pattern in primates [33,34]. If up-regulation is more costly than down-up-regulation, potentially due to constraints acting on the transcriptional machinery (discussed in more detail in Section 3.1), then increases in expression may be more often the result of positive selection, and reductions more dominated by genetic drift.
Beyond differences in the evolution of up- and down-regulation, other differences in the regulatory mechanisms underlying gene expression change are conflated in current models, which often do not account for copy number variation, cellular mechanisms [17], or cis-versus trans-acting effectors of gene expression change. These different regulatory
underpinnings may have very different transcriptomic signals, requiring the development of sophisticated models to effectively parse their evolutionary implications.
3. Developing a robust model of gene expression evolution
The studies described above indicate that although gene expression change across lineages is a dynamic and complex process, much of the fine detail is condensed and simplified in current models of expression evolution. Additionally, whereas coding sequence change can be understood and tested against a well-developed null model of neutral evolution [22], this is often not the case for gene expression evolution. As the pace of transcriptomic data acquisition increases exponentially with the implementation of next-generation sequencing methods, developing a robust null model is absolutely essential if we hope to integrate this data into a meaningful model of transcriptome evolution.
3.1. The relationship between mutation and expression level is complex
Current models of gene expression evolution assume a clock like rate of mutations in regulatory regions [17,22,24,29,34] that generate consistent incremental gene expression changes, thus setting the stage for null models of gene expression evolution similar to sequence evolution [28]. However, this simplistic assumption masks the complex nature of the relationship between mutation and expression change.
A regular accumulation of mutations in regulatory elements may generate an additive linear increase in expression, however, it is easy to envisage situations where this is not the case. If the importance of individual nucleotides in determining overall expression level differs, mutations would produce a labile irregular pattern of expression change. Additionally, an additive function does not accurately describe the relationship between regulatory mutation and transcription level close to levels of gene expression saturation, where a parabolic function with diminishing returns is more appropriate. Results from eQTL studies have the potential to shed light on these questions by identifying individual SNPs responsible for differences in expression level [36–38]. Nonetheless, these are still preliminary and further work is needed to accurately describe the relationship between regulatory mutation and expression level.
In addition to non-additivity, the work described in the previous section suggests that it is vital to examine not only the magnitude of expression change, but also the direction. Models that fail to distinguish between up- and down-regulation are unrealistic because they require the assumption that saturation, the point at which the additive relationship between mutation and transcriptional change breaks down, is the same for both types of expression change. This assumption is unfair because although up-regulation is theoretically limited only by the
Europe PMC Funders Author Manuscripts
efficiency of the transcriptional machinery, down-regulation is bounded by zero expression [39]. Saturation of down-regulatory change is therefore defined as the loss of expression, and is relatively easy to observe. Observed saturation of up-regulatory change is less obvious, as an additive relationship between regulatory mutations and transcription is not expected close to the optimal levels of transcriptional efficiency. This means that for up-regulation, the exact parameters of saturation are poorly understood and the saturation point may differ among genes.
Additionally, expression level is not solely determined by regulatory regions but by a large number of genetic mechanisms such as DNA methylation [40], RNA degradation [41] and alternate splicing [42–44]. Current additive models of change also do not account for gene duplication, which produces a stepwise increase in expression [46–48]. The complex nature of gene expression evolution is therefore unduly simplified in current evolutionary models, primarily because the relationship between mutational events and expression is poorly understood. Once a deeper understanding is attained, the effect of each class of mutational event on expression level may need to be modelled separately in order to explore all modes of gene expression evolution.
3.2. Modelling “noisy” gene expression data
Gene expression data is inherently noisier than sequence data, and this has important implications for the transcriptome–phenotype relationship. Because the boundaries between which change in expression does not affect protein level and therefore phenotype are not clear [50,51], there is some uncertainty about the functional implications of variance in gene expression. This uncertainty affects the limits of selective pressures and therefore the role of neutral evolutionary processes. The environment also strongly influences gene expression [52,53], and therefore environmental variation contributes to this noise in a way that is wholly missing from sequence data. Minimising environmental variation is important, as all expression change is classed as heritable in current models of expression evolution.
As a result, the “noisy” nature of gene expression data should be considered when
specifying the conditions over which expression change is considered neutral. Compared to coding sequence evolution, neutral evolution likely accounts for a wider range of gene expression patterns due to this extra variance. Therefore, the boundaries of neutral evolution of gene expression should be less stringent than that of sequence evolution. This is even more applicable for comparative transcriptomics in wild caught animals, where
environmental variance would widen the variance boundaries further.
3.3. Post-transcriptional and epigenetic changes as alternate routes to expression evolution
Current models of gene expression fail to distinguish between different mechanisms underlying expression change. One such mechanism is alternate splicing which has been shown to have important phenotypic consequences [42–44]. Alternative splicing may present a quick route to phenotypic innovation, as only a few mutations can generate new splice variants, thereby dramatically changing the expression of a specific exon. Alternative splicing varies across taxonomic lineages [45], however it is not clear by how much, or how this form of post-transcriptional regulation evolves. A comparison of chimpanzee and human transcriptomes revealed that 7% of genes expressed in the liver have conserved splice variants [42] however, sex-specific splice variants appear to be more common and strongly conserved across Drosophila species [44].
The role of methylation in determining expression level has been widely documented [54], however the heritability and evolutionary signal of this genetic mechanism across lineages
Europe PMC Funders Author Manuscripts
in unknown. Similarly, parent-of-origin expression, likely ultimately due to methylation, is widely documented in mammals [55,56], and may be driven by sexual conflict [57,58]. However, the evolutionary patterns of imprinting across related species remain uncharacterized.
3.4. Coding sequence evolution versus gene expression evolution
A major question in evolutionary genetics is the extent to which sequence and expression evolution represent different routes in generating phenotypic divergence. Preliminary data indicates a correlation between expression divergence and rates of coding sequence change [31,50,59–64], however this may be largely due to neutral processes acting on relatively unconstrained genes, which would be expected to affect sequence and expression data in similar ways.
Genes responsible for adaptive phenotypic divergence are shaped primarily by positive directional selection, and these genes may not show a correlation between sequence and expression evolution [9–11]. Adaptive change in expression and sequence may therefore represent alternate routes for responding to selection pressures, as expression change may avoid negative pleiotropic effects when sequence is constrained [65] and vice versa. Additionally, if expression change is more labile than sequence change, it could facilitate rapid phenotypic divergence.
4. A next-generation sequencing approach to gene expression evolution
Evolutionary models are only useful in the extent to which they can accurately predict the biological relationships they supposedly mirror. This relates not only to the efficacy of parameters and constraints, but also to the appropriateness and accuracy of the data used to construct and implement them. Therefore, in addition to the development of improved models of gene expression evolution, careful consideration of the design of the studies that employ such models is equally important.
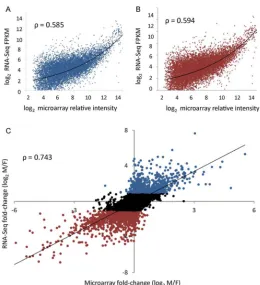
Our current understanding of the relationship between complex phenotypes and gene expression evolution is largely based on data obtained from microarray studies. Recent advances in the application of high-throughout sequencing technology has made it possible to sequence the entire transcriptome of a sample by direct sequencing of cDNA fragments derived from sample RNA [66]. This method, referred to as RNA-Seq, provides accurate quantification of the relative levels of each transcript present in the sample through mapping of reads to reference sequences [67]. A comparison of the same samples using both
technologies highlights the advantages of RNA-Seq over microarrays for comparative transcriptomics (Fig. 2). Although there is a reasonable correlation across the majority of the expression spectrum ( = 0.743), microarrays suffer technical limitations at low and high levels of expression due to background levels of hybridisation and probe saturation respectively. Crucially, it is within these extremes of expression that the most differentially expressed genes are found. It is also worth noting that no comparison can be made at very low expression, as unlike RNA-Seq, microarrays are simply unable to detect expression at this level.
RNA-Seq has also removed the necessity of prior knowledge for designing probes and therefore measuring expression. The development of de novo transcriptome assembly allows for the identification of novel genes and alternate splice isoforms without reference genomes [68,69], as well as the sequencing of non-model organisms [70,71].
Comparing RNA-Seq-based expression estimates across species is relatively straightforward once orthology is determined within transcriptomes. This is in stark contrast to the
Europe PMC Funders Author Manuscripts
difficulties associated with comparing array data, as separate species-specific arrays cannot be directly compared with a high-level of accuracy and non-specific arrays must be optimised for one focal species at the cost of specificity for the others [72], a particular problem for highly divergent lineages. This loss of comparative power is particularly important when determining the mode of evolution due to the requirement for accurate measures of between species divergence. Multi-species arrays provide comparable
expression data, but the probes from multi-species arrays have to be constructed specifically for each study combination.
The ability of RNA-Seq to efficiently and accurately assess the gene expression of an entire sample has enabled powerful comparative studies between different sexes [73], species [42], tissues [74], conditions [75] and developmental time points [76]. However, RNA-Seq studies are far from perfect. Inadequate experimental design results in serious limits to the implementation of models of transcriptome evolution. The sequencing depth required for a transcriptome project largely depends both on the availability and quality of a reference genome and the complexity of the transcriptome [77]. Calculating required coverage for RNA-Seq experiments is more difficult than for traditional genomic sequencing, due to the difficulty of quantifying lowly expressed genes or rare isoforms as samples are dominated by a few highly expressed genes. Additionally, even with clear evidence from many years of microarray analyses that biological replicates are crucial for meaningful results to be obtained with appropriate statistical power [78], many RNA-Seq studies have not included replicates [17,79–82]. Despite advances in variation estimation that allow otherwise underpowered projects to obtain at least conservative results [83], it remains the case that without appropriate replication the biological meaningfulness of the experiments will be limited. An ideal study should include numerous biological replicates and should also consider a randomised/blocked sequencing design to account for technological bias [84].
Additionally, for models to be effective, transcriptome sequencing studies should be designed to minimize as much sampling and environmental variation as possible. This means that sampling from controlled, captive populations is preferred, especially when generating data for modelling, as captive populations offer the advantages of known pedigree, condition, diet, stress and immunological state. Controlled populations also allow greater command over the age of samples, which should be as similar as possible as expression profiles vary dramatically at different developmental stages [85]. Depending upon the aims of the study the point of sampling needs to be carefully selected, as for example adult phenotypes can be programmed early on in development far before adulthood is reached [86]. Additionally, corrections in sampling are required when comparisons are made between species that may develop at different rates. This allows for accurate comparisons to be made of the same developmental stage [87,88].
Although studying wild populations with RNA-Seq has the advantage of assessing natural ecological and evolutionary conditions [71], it introduces a number of confounding factors related to age, disease state and environmental influences. Environmental and
developmental factors introduce considerable noise to expression profiling with global and targeted expression responses, and can influence long-term expression patterns [89]. A key question for future studies is whether studies of transcriptome evolution can be performed on natural populations with sufficient accuracy. If it is just a matter of sample size, then the continuing advances in sequence technology will likely overcome the sampling restriction as larger and more complex studies become feasible and affordable. However, many model parameters are difficult to estimate even in well-studied model organisms, so it may still prove extremely difficult to account for the levels of environmental variation present in uncontrolled populations.
Europe PMC Funders Author Manuscripts
The phenotypic locus is also important in expression studies. Rather than sampling the whole organism, a better strategy is to sample the specific tissue, or even a specific subpart of a given tissue, where phenotypes of interest are expressed. For example, whole-brain preparations have failed to identify the basis of behavioural differences [20] and in such studies, it may be necessary to identify and select the appropriate region of the brain that controls for the desired behavioural phenotypes.
Data accuracy is also affected by the sequencing technology itself. The inherent biases of the different sequencing platforms need to be understood and, if possible, methods implemented to counteract them. For example, random hexamer priming in Illumina RNA-Seq standard library preparation [82] causes positional biases, but these can be corrected through read count adjustments [90]. More fundamentally, the methods of estimation of gene expression levels need to be carefully selected. For example, the widely used measurement of reads per kilobase of gene length per million reads (RPKM) suffers from gene-length, G + C and dinucleotide frequency bias [91]. Statistical methods, such as DESeq [83], have been developed to control for these biases and to additionally allow for reads that map to multiple locations to be appropriately accounted for.
Technological advances in next-generation sequencing have also opened other avenues for furthering our understanding of gene expression evolution. An alternative to studying expression changes is to explicitly determine alterations to regulatory regions at the sequence level. The complexity of regulatory regions makes them difficult to study, but advances in next-generation sequencing may provide a more complete picture of gene regulation and expression. For example, microRNA-sequencing [92] is able to detect small regulatory RNAs and ChIP-Seq allows the identification of DNA–protein interactions, such as those of transcription factors [93]. It is only through coupling the advances in sequencing technology with the development of improved models of gene expression evolution that the full relationship between genome and phenotype will be understood.
5. Concluding remarks
Next generation sequencing provides the necessary tools to identify, with unprecedented power and precision, regulatory changes underlying complex phenotypic adaptation across the whole genome. However, a robust model framework with which to interpret this
transcriptomic data is lacking, and thus current methods to distinguish signatures of adaptive change from neutral processes are inadequate. As a result our understanding of the nature of gene expression evolution remains limited.
Developing a null model of neutral evolution that acknowledges the inherently noisy nature of gene expression and the multitude of complex genetic routes to generate regulatory change is key. The incorporation of distinct factors to govern different mutational mechanisms, such as alternative splicing and gene duplication, will reflect with greater accuracy the complex dynamics of transcriptome evolution. This null model, when combined with next generation transcriptomic data, has the potential to revolutionise our understanding of the role of the transcriptome-phenotype relationship over broad
evolutionary scales. In doing so, this will bring our understanding of regulatory evolution in line with that of sequence evolution so that the full relationship between the genome and phenotype can be understood.
Acknowledgments
This work was supported by NERC, BBSRC and the ERC under the Framework 7 Agreement (grant agreement 260233).
Europe PMC Funders Author Manuscripts
References
[1]. Hoekstra HE, Coyne JA. The locus of evolution: evo devo and the genetics of adaptation. Evolution. 2007; 61:995–1016. [PubMed: 17492956]
[2]. Carroll SB. Evo-devo and an expanding evolutionary synthesis: a genetic theory of morphological evolution. Cell. 2008; 134:25–36. [PubMed: 18614008]
[3]. Yang Z. PAML 4: phylogenetic analysis by maximum likelihood. Mol Biol Evol. 2007; 24:1586– 91. [PubMed: 17483113]
[4]. Clark AG, Eisen MB, Smith DR, Bergman CM, Oliver B, Markow TA, et al. Evolution of genes and genomes on the Drosophila phylogeny. Nature. 2007; 450:203–18. [PubMed: 17994087] [5]. Clark AG, Glanowski S, Nielsen R, Thomas PD, Kejariwal A, Todd MA, et al. Inferring
nonneutral evolution from human-chimp-mouse orthologous gene trios. Science. 2003; 302:1960–3. [PubMed: 14671302]
[6]. Rubin C-J, Zody MC, Eriksson J, Meadows JRS, Sherwood E, Webster MT, et al. Whole-genome resequencing reveals loci under selection during chicken domestication. Nature. 2010; 464:587– 91. [PubMed: 20220755]
[7]. Sabeti PC, Schaffner SF, Fry B, Lohmueller J, Varilly P, Shamovsky O, et al. Positive natural selection in the human lineage. Science. 2006; 312:1614–20. [PubMed: 16778047]
[8]. Yi X, Liang Y, Huerta-Sanchez E, Jin X, Cuo ZXP, Pool JE, et al. Sequencing of 50 human exomes reveals adaptation to high altitude. Science. 2010; 329:75–8. [PubMed: 20595611] [9]. Manceau M, Domingues VS, Mallarino R, Hoekstra HE. The developmental role of agouti in color
pattern evolution. Science. 2011; 331:1062–5. [PubMed: 21350176]
[10]. Rebeiz M, Pool JE, Kassner VA, Aquadro CF, Carroll SB. Stepwise modification of a modular enhancer underlies adaptation in a Drosophila population. Science. 2009; 326:1663–7. [PubMed: 20019281]
[11]. Abzhanov A, Kuo WP, Hartmann C, Grant BR, Grant PR, Tabin CJ. The calmodulin pathway and evolution of elongated beak morphology in Darwin’s finches. Nature. 2006; 442:563–7. [PubMed: 16885984]
[12]. Ometto L, Shoemaker D, Ross KG, Keller L. Evolution of gene expression in fire ants: the effects of developmental stage, caste, and species. Mol Biol Evol. 2010; 28:1381–92. [PubMed: 21172833]
[13]. Wurm Y, Wang J, Keller L. Changes in reproductive roles are associated with changes in gene expression in fire ant queens. Mol Ecol. 2010; 19:1200–11. [PubMed: 20163551]
[14]. Wyman MJ, Agrawal AF, Rowe L. Condition-dependence of the sexually dimorphic
transcriptome in Drosophila melanogaster. Evolution. 2010; 64:1836–48. [PubMed: 20059540] [15]. Ranz JM, Castillo-Davis CI, Meiklejohn CD, Hartl DL. Sex-dependent gene expression and
evolution of the Drosophila transcriptome. Science. 2003; 300:1742–5. [PubMed: 12805547] [16]. Pancaldi V, Schubert F, Bähler J. Meta-analysis of genome regulation and expression variability
across hundreds of environmental and genetic perturbations in fission yeast. Mol Biosyst. 2010; 6:543–52. [PubMed: 20174682]
[17]. Brawand D, Soumillon M, Necsulea A, Julien P, Csardi G, Harrigan P, et al. The evolution of gene expression levels in mammalian organs. Nature. 2011; 478:343–8. [PubMed: 22012392] [18]. Grath S, Baines J, Parsch J. Molecular evolution of sex-biased genes in the Drosophila ananassae
subgroup. BMC Evol Biol. 2009; 9:291. [PubMed: 20015359]
[19]. Jiang Z-F, Machado CA. Evolution of sex-dependent gene expression in three recently diverged species of Drosophila. Genetics. 2009; 183:1175–85. [PubMed: 19720861]
[20]. Naurin S, Hansson B, Hasselquist D, Kim Y-H, Bensch S. The sex-biased brain: sexual dimorphism in gene expression in two species of songbirds. BMC Genomics. 2011; 12:37. [PubMed: 21235773]
[21]. Zhang Y, Sturgill D, Parisi M, Kumar S, Oliver B. Constraint and turnover in sex-biased gene expression in the genus Drosophila. Nature. 2007; 450:233–8. [PubMed: 17994089]
[22]. Kimura, M. The neutral theory of molecular evolution. Cambridge University Press; Cambridge: 1983.
Europe PMC Funders Author Manuscripts
[23]. Hartl, DL.; Clark, AG. Principles of population genetics. 3rd ed. Sinauer Associates Inc.; MA, SunderlandMA: 1997.
[24]. Oleksiak MF, Churchill GA, Crawford DL. Variation in gene expression within and among natural populations. Nat Genet. 2002; 32:261–6. [PubMed: 12219088]
[25]. Rifkin SA, Kim J, White KP. Evolution of gene expression in the Drosophila melanogaster subgroup. Nat Genet. 2003; 33:138–44. [PubMed: 12548287]
[26]. Lemos B, Meiklejohn CD, Cáceres M, Hartl DL. Rates of divergence in gene expression profiles of primates, mice, and flies: stabilizing selection and variability among functional categories. Evolution. 2005; 59:126–37. [PubMed: 15792233]
[27]. Jermann TM, Opitz JG, Stackhouse J, Benner SA. Reconstructing the evolutionary history of the artiodactyl ribonuclease superfamily. Nature. 1995; 374:57–9. [PubMed: 7532788]
[28]. Khaitovich P, Weiss G, Lachmann M, Hellmann I, Enard W, Muetzel B, et al. A neutral model of transcriptome evolution. PLoS Biol. 2004; 2:e132. [PubMed: 15138501]
[29]. Gilad Y, Oshlack A, Smyth GK, Speed TP, White KP. Expression profiling in primates reveals a rapid evolution of human transcription factors. Nature. 2006; 440:242–5. [PubMed: 16525476] [30]. Jordan IK, Mariño-Ramírez L, Koonin EV. Evolutionary significance of gene expression
divergence. Gene. 2005; 345:119–26. [PubMed: 15716085]
[31]. Khaitovich P, Hellmann I, Enard W, Nowick K, Leinweber M, Franz H, et al. Parallel patterns of evolution in the genomes and transcriptomes of humans and chimpanzees. Science. 2005; 309:1850–4. [PubMed: 16141373]
[32]. Mank JE, Hultin-Rosenberg L, Zwahlen M, Ellegren H. Pleiotropic constraint hampers the resolution of sexual antagonism in vertebrate gene expression. Am Nat. 2008; 171:35–43. [PubMed: 18171149]
[33]. Khaitovich P, Pääbo S, Weiss G. Toward a neutral evolutionary model of gene expression. Genetics. 2005; 170:929–39. [PubMed: 15834146]
[34]. Chaix R, Somel M, Kreil DP, Khaitovich P, Lunter GA. Evolution of primate gene expression: drift and corrective sweeps. Genetics. 2008; 180:1379–89. [PubMed: 18791252]
[36]. Gilad Y, Rifkin SA, Pritchard JK. Revealing the architecture of gene regulation: the promise of eQTL studies. Trends Genet. 2008; 24:408–15. [PubMed: 18597885]
[37]. Khaitovich P. Brain expression – is it all in our SNPs? Mol Syst Biol. 2007; 3:155. [PubMed: 18091726]
[38]. Majewski J, Pastinen T. The study of eQTL variations by RNA-seq: from SNPs to phenotypes. Trends Genet. 2011; 27:72–9. [PubMed: 21122937]
[39]. Gilad Y, Oshlack A, Rifkin SA. Natural selection on gene expression. Trends Genet. 2006; 22:456–61. [PubMed: 16806568]
[40]. Jones PA, Takai D. The role of DNA methylation in mammalian epigenetics. Science. 2001; 293:1068–70. [PubMed: 11498573]
[41]. Valencia-Sanchez MA, Liu JD, Hannon GJ, Parker R. Control of translation and mRNA degradation by miRNAs and siRNAs. Genes Dev. 2006; 20:515–24. [PubMed: 16510870] [42]. Blekhman R, Marioni JC, Zumbo P, Stephens M. Sex-specific Gilad Y. lineage-specific
alternative splicing in primates. Genome Res. 2010; 20:180–9. [PubMed: 20009012]
[43]. Prince EG, Kirkland D, Demuth JP. Hyperexpression of the X chromosome in both sexes results in extensive female-bias of X-linked gene in the flour beetle. Genome Biol Evol. 2010; 2:336– 46. [PubMed: 20624738]
[44]. Telonis-Scott M, Kopp A, Wayne ML, Nuzhdin SV, McIntyre LM. Sex-specific splicing in Drosophila: widespread occurrence, tissue specificity and evolutionary conservation. Genetics. 2009; 181:421–34. [PubMed: 19015538]
[45]. Licatalosi DD, Darnell RB. RNA processing and its regulation: global insights into biological networks. Nat Rev Genet. 2010; 11:75–87. [PubMed: 20019688]
[46]. Hyman E, Kauraniemi P, Hautaniemi S, Wolf M, Mousses S, Rozenblum E, et al. Impact of DNA amplification on gene expression patterns in breast cancer. Cancer Res. 2002; 62:6240–5. [PubMed: 12414653]
Europe PMC Funders Author Manuscripts
[47]. Mank JE. The W, X, Y and Z of sex-chromosome dosage compensation. Trends Genet. 2009; 25:226–33. [PubMed: 19359064]
[48]. Pollack JR, Sørlie T, Perou CM, Rees CA, Jeffrey SS, Lonning PE, et al. Microarray analysis reveals a major direct role of DNA copy number alteration in the transcriptional program of human breast tumors. Proc Natl Acad Sci USA. 2002; 99:12963–8. [PubMed: 12297621] [50]. Fu N, Drinnenberg I, Kelso J, Wu J-R, Paeaebo S, Zeng R, et al. Comparison of protein and
mRNA expression evolution in humans and chimpanzees. PloS One. 2007; 2:e216. [PubMed: 17299596]
[51]. Schwanhäusser B, Busse D, Li N, Dittmar G, Schuchhardt J, Wolf J, et al. Global quantification of mammalian gene expression control. Nature. 2011; 473:337–42. [PubMed: 21593866] [52]. Idaghdour Y, Storey JD, Jadallah SJ, Gibson G. A genome-wide gene expression signature of
environmental geography in leukocytes of Moroccan amazighs. PLoS Genet. 2008; 4:e1000052. [PubMed: 18404217]
[53]. Whitehead A, Crawford DL. Neutral and adaptive variation in gene expression. Proc Natl Acad Sci USA. 2006; 103:5425–30. [PubMed: 16567645]
[54]. Mikkelsen TS, Ku M, Jaffe DB, Issac B, Lieberman E, Giannoukos G, et al. Genome-wide maps of chromatin state in pluripotent and lineage-committed cells. Nature. 2007; 448:553–60. [PubMed: 17603471]
[55]. Hager R, Cheverud JM, Leamy LJ, Wolf JB. Sex dependent imprinting effects on complex traits in mice. BMC Evol Biol. 2008; 8:303. [PubMed: 18976474]
[56]. Obermann C, Meyer E, Prager S, Tomiuk J, Wollmann HA, Eggermann T. Searching for genomic variants in IGF2 and CDKN1C in Silver-Russell syndrome patients. Mol Genet Metab. 2004; 82:246–50. [PubMed: 15234339]
[57]. Day T, Bonduriansky R. Intralocus sexual conflict can drive the evolution of genomic imprinting. Genetics. 2004; 167:1537–46. [PubMed: 15342496]
[58]. Van Cleve J, Feldman MW. Sex-specific viability, sex linkage and dominance in genomic imprinting. Genetics. 2007; 176:1101–18. [PubMed: 17435253]
[59]. Ellegren H, Parsch J. The evolution of sex-biased genes and sex-biased gene expression. Nat Rev Genet. 2007; 8:689–98. [PubMed: 17680007]
[60]. Good JM, Nachman MW. Rates of protein evolution are positively correlated with developmental timing of expression during mouse spermatogenesis. Mol Biol Evol. 2005; 22:1044–52.
[PubMed: 15647515]
[61]. Hovatta I, Zapala MA, Broide RS, Schadt EE, Libiger O, Schork NJ, et al. DNA variation and brain region-specific expression profiles exhibit different relationships between inbred mouse strains: implications for eQTL mapping studies. Genome Biol. 2007; 8:R25. [PubMed: 17324278]
[62]. Lemos B, Bettencourt BR, Meiklejohn CD, Hartl DL. Evolution of proteins and gene expression levels are coupled in Drosophila and are independently associated with mRNA abundance, protein length, and number of protein–protein interactions. Mol Biol Evol. 2005; 22:1345–54. [PubMed: 15746013]
[63]. Meiklejohn CD, Parsch J, Ranz JM, Hartl DL. Rapid evolution of male-biased gene expression in Drosophila. Proc Natl Acad Sci USA. 2003; 100:9894–9. [PubMed: 12907700]
[64]. Nuzhdin SV, Wayne ML, Harmon KL, McIntyre LM. Common pattern of evolution of gene expression level and protein sequence in Drosophila. Mol Biol Evol. 2004; 21:1308–17. [PubMed: 15034135]
[65]. Shapiro MD, Marks ME, Peichel CL, Blackman BK, Nereng KS, Jonsson B, et al. Genetic and developmental basis of evolutionary pelvic reduction in threespine sticklebacks. Nature. 2004; 428:717–23. [PubMed: 15085123]
[66]. Nagalakshmi U, Wang Z, Waern K, Shou C, Raha D, Gerstein M, et al. The transcriptional landscape of the yeast genome defined by RNA sequencing. Science. 2008; 320:1344–9. [PubMed: 18451266]
[67]. Morin R, Bainbridge M, Fejes A, Hirst M, Krzywinski M, Pugh T, et al. Profiling the HeLa S3 transcriptome using randomly primed cDNA and massively parallel short-read sequencing. Biotechniques. 2008; 45:81–94. [PubMed: 18611170]
Europe PMC Funders Author Manuscripts
[68]. Grabherr MG, Haas BJ, Yassour M, Levin JZ, Thompson DA, Amit I, et al. Full-length transcriptome assembly from RNA-Seq data without a reference genome. Nat Biotechnol. 2011; 29:644–52. [PubMed: 21572440]
[69]. Robertson G, Schein J, Chiu R, Corbett R, Field M, Jackman SD, et al. De novo assembly and analysis of RNA-seq data. Nat Methods. 2010; 7:909–12. [PubMed: 20935650]
[70]. Feldmeyer B, Wheat CW, Krezdorn N, Rotter B, Pfenninger M. Short read Illumina data for the de novo assembly of a non-model snail species transcriptome (Radix balthica, Basommatophora, Pulmonata), and a comparison of assembler performance. BMC Genomics. 2011; 12:317. [PubMed: 21679424]
[71]. Santure AW, Gratten J, Mossman JA, Sheldon BC, Slate J. Characterisation of the transcriptome of a wild great tit Parus major population by next generation sequencing. BMC Genomics. 2011; 12:283. [PubMed: 21635727]
[72]. Gilad Y, Rifkin SA, Bertone P, Gerstein M, White KP. Multi-species microarrays reveal the effect of sequence divergence on gene expression profiles. Genome Res. 2005; 15:674–80. [PubMed: 15867429]
[73]. Chang PL, Dunham JP, Nuzhdin SV, Arbeitman MN. Somatic sex-specific transcriptome differences in Drosophila revealed by whole transcriptome sequencing. BMC Genomics. 2011; 12:364. [PubMed: 21756339]
[74]. Chen C, Ai H, Ren J, Li W, Li P, Qiao R, et al. A global view of porcine transcriptome in three tissues from a full-sib pair with extreme phenotypes in growth and fat deposition by paired-end RNA sequencing. BMC Genomics. 2011; 12:448. [PubMed: 21906321]
[75]. Wilhelm BT, Marguerat S, Watt S, Schubert F, Wood V, Goodhead I, et al. Dynamic repertoire of a eukaryotic transcriptome surveyed at single-nucleotide resolution. Nature. 2008; 453:1239– 43. [PubMed: 18488015]
[76]. Pal S, Gupta R, Kim H, Wickramasinghe P, Baubet V, Showe LC, et al. Alternative transcription exceeds alternative splicing in generating the transcriptome diversity of cerebellar development. Genome Res. in press.
[77]. Wang Z, Gerstein M, Snyder M. RNA-Seq: a revolutionary tool for transcriptomics. Nat Rev Genet. 2009; 10:57–63. [PubMed: 19015660]
[78]. Churchill GA. Fundamentals of experimental design for cDNA microarrays. Nat Genet. 2002; 32:490–5. [PubMed: 12454643]
[79]. Bainbridge MN, Warren RL, Hirst M, Romanuik T, Zeng T, Go A, et al. Analysis of the prostate cancer cell line LNCaP transcriptome using a sequencing-by-synthesis approach. BMC
Genomics. 2006; 7:246. [PubMed: 17010196]
[80]. Hashimoto, S-i; Qu, W.; Ahsan, B.; Ogoshi, K.; Sasaki, A.; Nakatani, Y., et al. High-resolution analysis of the 5 -end transcriptome using a next generation DNA sequencer. PLoS One. 2009; 4:e4108. [PubMed: 19119315]
[81]. Marioni JC, Mason CE, Mane SM, Stephens M, Gilad Y. R.N.A-seq. An assessment of technical reproducibility and comparison with gene expression arrays. Genome Res. 2008; 18:1509–17. [PubMed: 18550803]
[82]. Mortazavi A, Williams BA, McCue K, Schaeffer L, Wold B. Mapping and quantifying mammalian transcriptomes by RNA-Seq. Nat Methods. 2008; 5:621–8. [PubMed: 18516045] [83]. Anders S, Huber W. Differential expression analysis for sequence count data. Genome Biol.
2010; 11:R106. [PubMed: 20979621]
[84]. Auer PL, Doerge RW. Statistical design and analysis of RNA sequencing data. Genetics. 2010; 185:405–16. [PubMed: 20439781]
[85]. Arbeitman MN, Furlong EEM, Imam F, Johnson E, Null BH, Baker BS, et al. Gene expression during the life cycle of Drosophila melanogaster. Science. 2002; 297:2270–5. [PubMed: 12351791]
[86]. Mank JE, Nam K, Brunström B, Ellegren H. Ontogenetic complexity of sexual dimorphism and sex-specific selection. Mol Biol Evol. 2010; 27:1570–8. [PubMed: 20142440]
[87]. Domazet-Loso T, Tautz D. A phylogenetically based transcriptome age index mirrors ontogenetic divergence patterns. Nature. 2010; 468:815–8. [PubMed: 21150997]
Europe PMC Funders Author Manuscripts
[88]. Kalinka AT, Varga KM, Gerrard DT, Preibisch S, Corcoran DL, Jarrells J, et al. Gene expression divergence recapitulates the developmental hourglass model. Nature. 2010; 468:811–4.
[PubMed: 21150996]
[89]. López-Maury L, Marguerat S, Bähler J. Tuning gene expression to changing environments: from rapid responses to evolutionary adaptation. Nat Rev Genet. 2008; 9:583–93. [PubMed:
18591982]
[90]. Hansen KD, Brenner SE, Dudoit S. Biases in Illumina transcriptome sequencing caused by random hexamer priming. Nucleic Acids Res. 2010; 38:e131. [PubMed: 20395217]
[91]. Zheng W, Chung LM, Zhao H. Bias detection and correction in RNA-sequencing data. BMC Bioinformatics. 2011; 12:290. [PubMed: 21771300]
[92]. Hafner M, Landgraf P, Ludwig J, Rice A, Ojo T, Lin C, et al. Identification of microRNAs and other small regulatory RNAs using cDNA library sequencing. Methods. 2008; 44:3–12. [PubMed: 18158127]
[93]. Robertson G, Hirst M, Bainbridge M, Bilenky M, Zhao Y, Zeng T, et al. Genome-wide profiles of STAT1 DNA association using chromatin immunoprecipitation and massively parallel sequencing. Nat Methods. 2007; 4:651–7. [PubMed: 17558387]
Europe PMC Funders Author Manuscripts
Fig. 1.
Mode of gene expression evolution inferred from levels of polymorphism and divergence, or within and between population variance respectively. This graph can be divided into regions where positive or purifying selection pressures prevail (quadrants I and II), or where neutral evolutionary processes drive changes in expression (quadrant III).
Europe PMC Funders Author Manuscripts
Fig. 2.
Affymetrix microarray and RNA-Seq expression estimates compared for identical RNA pools from Gallus gallus testes and ovaries. Each pool comprised four same-sex samples. Microarrays were run with standard hybridization, quality control, pre-processing and normalization procedures; RNA-Seq estimates are based on Illumina GAII 50 bp reads with approximately 17 million reads per sample. Male (A) and female (B) gonad expression data were combined for each technology in a comparison of male to female fold change (C).