1
Correlation and Capability of using Site Inspection Data and Small
Specimen Creep Testing for a Service-Exposed CrMoV Pipe Section
B. Cacciapuoti1*, A. Morris2, W. Sun1, D. G. McCartney1, J. Hulance3
1 Department of Mechanical, Materials and Manufacturing Engineering, University of Nottingham, Nottingham, NG7 2RD, UK
2 EDF Energy (UK), Coal Gas and Renewables, Central Technical Organisation, Barnwood, Gloucester GL4 3RS UK
3 RWE Generation SE, RWE npower, Moredon, Swindon, SN2 2NN, UK
Abstract
This paper presents for the first time an investigation on the creep damage evolution of an ex-service CrMoV pipe section through impression creep test and metallurgical inspection data. The study emphasises the importance of correlating the operating conditions (temperature and stress) of power plant components with the results from metallurgical examinations and small specimen creep tests.
The paper seeks for a correlation among micro- and macro-hardness measurements, surface replicas data and minimum creep strain rates (obtained by impression creep tests) of the parent material of the pipe section. Also, optical and SEM micrographs have been used to assess possible metallurgical differences through the thickness of the pipe section. This investigation shows how miniature creep test specimen data could be practically used in a holistic approach for the evaluation of life consumption of power plant components and concludes that the studied parent material could have been retired from service too early.
Keywords: CrMoV Pipe; Hardness; Impression Creep; Replica; Site Inspection Data.
*Corresponding Author: bia.cacciapuoti@gmail.com
1
Introduction
2 On-load monitoring comprises routinely recording of steam temperature and pressure data at selected key points in the process system, in order to evaluate the Creep Effective Temperature (CET), defined as the average temperature at which all of the creep damage can be equated to [1]. The calculation of the creep rupture life by means of CET gives a value of creep rupture life that depends on stress and temperature. This method can give the reduction in creep rupture life of the component due to variation in temperature or stress; however the analytical sensitivity to modest increases in operating conditions makes planning the scope of subsequent outages or replacement exercises, based on this information, fraught with uncertainty, which can lead to possible premature replacement of large sections of pipework [1].
It is clear that the current approach for the evaluation of life consumption is based on experiential knowledge and on a limited use of analytical methods [1, 4, 5].
Miniature specimen creep testing techniques could be successfully used together with the currently used condition assessment methods in order to provide a more predictive life assessment approach [1]. As opposed to the conventional uniaxial creep tests, miniature creep testing techniques require only a small volume of material to machine the specimen and can be successfully used to collect creep properties of critical regions of power plant components, including, for examples, welds with heat affected zones and around pipe bends. Moreover, miniature creep testing techniques can be treated as quasi-non-invasive methods and do not always require weld repair when samples are carefully removed (scooped) from in-service components as long as, for example, the maximum excavation depth does not exceed 10% of the wall thickness of the main steam pipe [6-8]. The location selected for the removal of the material requires careful consideration of past inspection findings and may require some level of re-inspection at subsequent outages.
3 discussed and conclusions are drawn with reference to the detailed examination of the 46-year-aged CrMoV pipe section.
2
Experimental work
2.1 Material
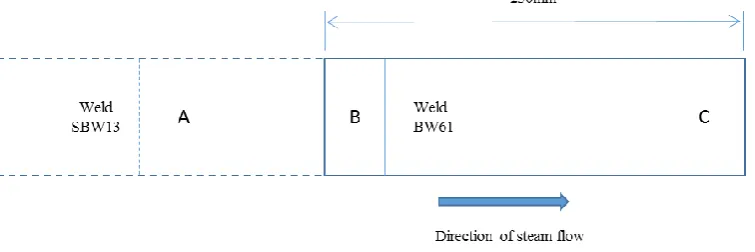
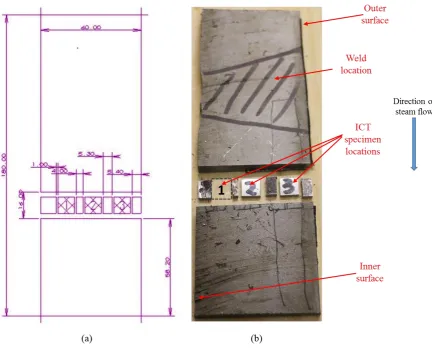
The tested material was removed from service in 2014, after initial installation in 1968. It is a plain, low-alloy steel CrMoV pipe section that also contains a weld, with a site reference designation BW61. The plain pipe material section, containing weld BW61, was removed from main steam leg B1, with orientation illustrated in Figure 1, where the dotted lines represent the pipe section upstream the pipe section studied in this paper. Hence, the straight piece of material removed is just upstream of a 90 degree vertical bend.
The material specimen was removed from service in 2014 for examination to help support limited continued operation of other operating units until a full pipework replacement could be undertaken. At the time of removal, the pipe section had undergone 271,770 hours and 2739 unit starts.
The pipe section has an internal radius of 120 mm and an outer radius of 180 mm, therefore the thickness of the pipe is 60 mm, which, for convenience, in the present study, is expressed in terms of the current radius, r, ranging from 0 to 60 mm.
[image:3.595.111.489.553.679.2]Section 2.2 provides further details on prior in-service examinations and operating history.
Figure 1. Pipe section orientation. Dotted lines represent the pipe section upstream the pipe section take into account in this
4 2.2 Operating history and prior examinations
Section 2.1 describes the position of the section in main steam leg B1 and age on removal. The last in-service inspection was undertaken in 2009, with a service duty of 242,773 hours and 2522 unit starts. The in service pressure was 168 bar; it may have varied a little in service, up to ~ 170bar, when the unit was on full load. These pressures are typical for all the large conventional plant designs in the UK. The only available in-service data related to the specimen operating conditions and in-service strain rate indicates that the creep effective operating temperature is slightly less than the design temperature and with a creep strain rate of ~ 4.2 x 10⁻⁸ h-1
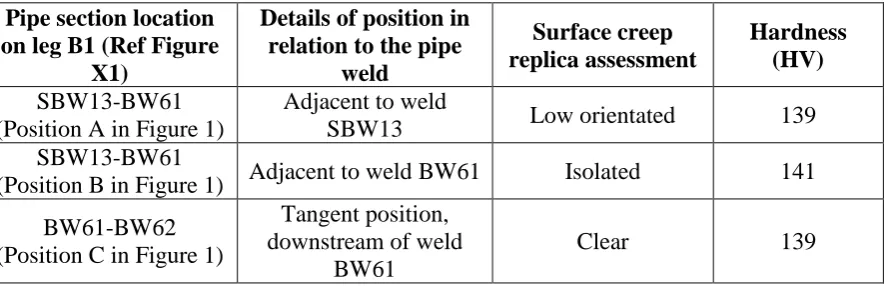
[image:4.595.81.526.419.562.2]Table 1 provides the metallurgical parent material assessments undertaken during the 2009 outage for the material specimen and a selection of adjacent pipe sections both upstream and downstream. In Figure 1, location SBW13-BW61 adjacent to weld SBW13 is indicated with A, location SBW13-BW61 adjacent to weld BW61 is indicated with B and location BW61-BW62 tangent position, downstream of weld BW61, is indicated with C.
Table 1. Outage parent material metallurgical assessment in 2009.
Pipe section location on leg B1 (Ref Figure
X1)
Details of position in relation to the pipe
weld Surface creep replica assessment Hardness (HV) SBW13-BW61
(Position A in Figure 1)
Adjacent to weld
SBW13 Low orientated 139
SBW13-BW61
(Position B in Figure 1) Adjacent to weld BW61 Isolated 141 BW61-BW62
(Position C in Figure 1)
Tangent position, downstream of weld
BW61
Clear 139
5
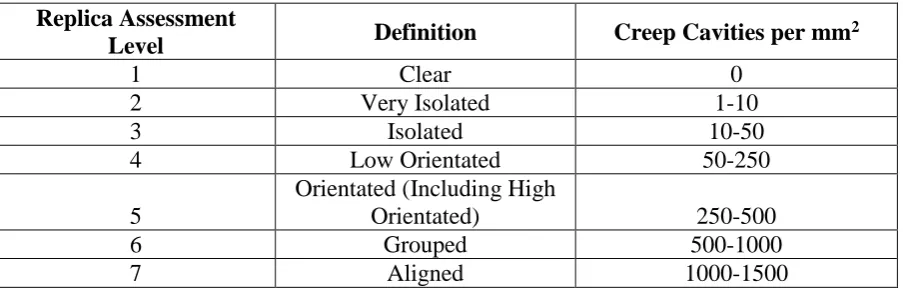
Table 2. Creep replica assessment level.
Replica Assessment
Level Definition Creep Cavities per mm
2
1 Clear 0
2 Very Isolated 1-10
3 Isolated 10-50
4 Low Orientated 50-250
5
Orientated (Including High
Orientated) 250-500
6 Grouped 500-1000
7 Aligned 1000-1500
The condition of the parent material adjacent to weld BW61 is of interest, considering the creep replica assessment of the weld that reports high orientated creep damage.
The adjacent straight section immediately upstream of BW61 was also removed in 2014 and subjected to a through section creep replica assessment.
Periodic assessments of the operating conditions are undertaken at various stages in life, typically this involves obtaining a six-month block of steam temperature and pressure data and computing the creep effective temperature (CET), which is explained in detail in [1]. For leg B1, the design temperature is 568 °C and the most recent CET estimates for this leg were 564
°C in 2005/2006 (operating duty 215,866 hours and 2295 unit starts) and 559 °C in 2010.
Diametral strain measurements are also periodically carried out at various strategic locations on the pipe system, usually targeting circa three locations on the pipe system, towards the top at the boiler outlet, a mid-section position and finally one towards the high pressure steam chests. These measurements, taken with a site micrometer over creep pips installed on the outer diameter, can be prone to inconsistency and error [1]. Various main steam diametral measurements on main steam leg B1 have been taken since first unit operation in 1968. For this data, taking the worst case two successive measurements, this converts to a strain rate over the period 1999 to 2009 (59,733 hours) of 4.2 x 10⁻⁸hr-1. This subsequently can be converted to a minimum creep life of ~ 310,000 hours. Other reviews [1] describe case studies with similar diametral measurements, along with the shortfalls.
6 is noted that based on very limited diametral strain measurements that the parent material may be > 85% creep life consumed (based on minimum creep properties).
Hence, the laboratory examination and testing of the selected section (weld BW61 and parent material indicated with B and C in Figure 1) is necessary, which aims to further assess the condition of the material status with a variety of techniques, to seek any realistic correlations, and to make practical recommendations on the use of the techniques on service aged materials. 2.3 Test program
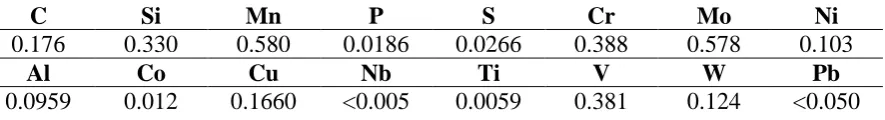
[image:6.595.81.524.416.476.2]The parent material composition, in wt%, is reported in Table 3 and it has been taken from the outer surface of the BW61 pipe section. This study only concerns the pipe section parent material. The test program aims to characterize the material behaviour through the thickness of the pipe and by the collection of room temperature data, such as hardness, surface replicas, and high temperature data from impression creep tests (ICTs). The impression creep tests have been carried out at a temperature of 575 °C, at three reference stresses of 110, 130 and 150 MPa.
Table 3. Material composition in wt% of the tested material.
C Si Mn P S Cr Mo Ni
0.176 0.330 0.580 0.0186 0.0266 0.388 0.578 0.103
Al Co Cu Nb Ti V W Pb
7
Figure 2. (a) Schematic representation of the pipe section from which the test samples have been machined (dimensions in
mm), and (b) the pipe section and location of weld and impression creep test specimens.
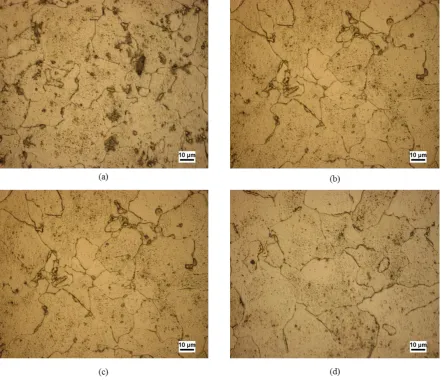
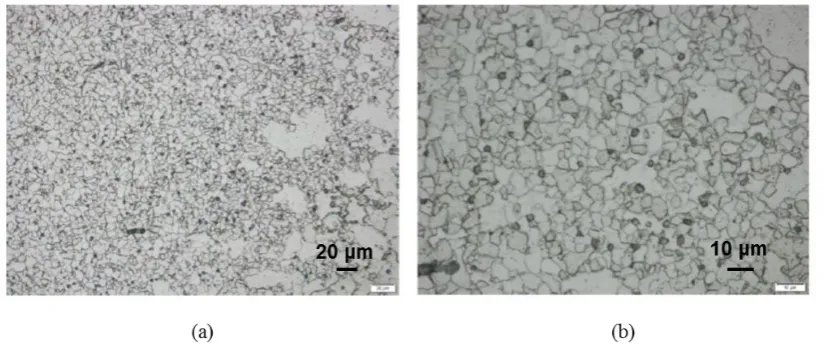
2.4 Microstructure
For the microstructure investigation of the as received material, four specimens, T1, T2, T3 and T4 (from the outer to the inner surface), have been machined through the thickness of the pipe section and away from the weld as far as possible. The samples dimensions are 10x10x2.5 mm. Optical micrographs and SEM images have been taken from the centre of each sample and are showed and descripted in Section 3.1.
2.5 Hardness and replica
2.5.1 Hardness tests
[image:7.595.79.512.70.420.2]8 at a distance of at least 3 or 4 times the length of the indentation diagonal (in μm) [12, 13]. Therefore, in order to assure enough distance among the indentations and between indentations and borders, only four measurements had to be considered for each position. The tester machine used for the tests was a Vickers-Armstrongs HTM 2000 and the load used was 20 kgf.
Micro-hardness tests have been carried out on the specimens T1 to T4 in order to assess a potential variation in hardness through the thickness of the pipe. In the axial direction 20 measurements were taken, while in the radial direction only 10 measurements were taken as the scatter in data was low (of the order of 10-20 HV). The tester machine used for the tests was a Buehler 1600-6400 and the load used was 0.5 kgf.
2.5.2 Surface replica for creep cavity count
9
Figure 3. Position of replicas.
Micrographs of typical cavity count are shown in Figure 4, which illustrates a surface replica of a 0.5CrMoV steel main steam line weld. In this example, a high creep cavity count was assessed at 842 cavities/mm2 (dark features in Figure 4) [1].
Figure 4. Weld Type IV region of a main steam pipework weld, surface replica taken 5 mm below the outer surface at (a)
x200 magnification and (b) x500 magnification, from Ref. [1].
2.6 Stationary state creep in thick cylinder
For an internally pressurized thick cylinder the principal stresses are the hoop stress, σϴ, the
radial stress, σr, and the axial stress σa, that depend on the internal pressure, p, the Norton’s
[image:9.595.93.510.387.565.2]10
{ 𝜎𝑟 𝜎𝜃
𝜎𝑎} =
𝑝
[(𝑅𝑅𝑜
𝑖) 2 𝑛
− 1]
{
1 − (𝑅𝑜
𝑟)
2 𝑛
1 +(2 − 𝑛)
𝑛 (
𝑅𝑜
𝑟)
2 𝑛
1 +(1 − 𝑛)
𝑛 ( 𝑅𝑜 𝑟) 2 𝑛 } (1)
𝜎𝑒𝑓𝑓 = 1
√2√(𝜎𝑟− 𝜎𝜃)
2+ (𝜎
𝑎− 𝜎𝜃)2+ (𝜎𝑟− 𝜎𝑎)2
(2)
The effective creep strain rate, 𝜀̇𝑒𝑓𝑓, for a material obeying the Norton creep law, is given in equation (3), where B is Norton’s material constant [14].
𝜀̇𝑒𝑓𝑓 = 𝐵(𝜎𝑒𝑓𝑓)
𝑛 (3)
During service, according to equation (3), the effective creep strain rate decreases through the thickness of the cylinder. Integration of equation (3) will give the effective creep strain curve, through the thickness of the cylinder, against time for primary and secondary creep.
2.7 Impression creep tests
11
Figure 5. (a) Impression creep test specimen adapted from ref. [16] and (b) schematic diagram showing the specimen
loading arrangement, adapted from ref. [15].
For impression creep test a Standard Code still does not exist, therefore these type of tests have been carried out following University of Nottingham’s practice. The tested material is assumed to obey Norton’s creep law, here given in equation (4), where B and n are material constants depending on the testing temperature, 𝜀̇𝑠𝑠𝑐 is the creep strain rate in the steady-state (minimum creep strain rate), and 𝜎 is the applied stress. Therefore, the reference stress method [17-19] can be adopted to calculate the reference stress parameters, η and β, that allow to establish a relationship between the equivalent uniaxial stress, σref, and the applied force during impression
creep test, P, and to establish a relationship between the equivalent creep strain rate in the steady state of the uniaxial test and the impression creep displacement rate Δ̇𝑠𝑠𝑐 , obtained by
impression creep test. These relationships are expressed in equations (5) and (6), where 𝑝̅ is the applied mean pressure and P is the applied load. The conversion parameters are non-dimensional constants, independent upon material and test temperature. Those used to convert the uniaxial creep reference stresses of 110, 130 and 150 MPa are η = 0.43 and β = 2.18, as suggested by Hyde et al. in 2009 [9]. Therefore, the applied loads for impression creep tests are 2558.14, 3023.26 and 3488.37 N.
𝜀̇𝑠𝑠𝑐 = 𝐵𝜎𝑛 (4)
ε̇ssc (𝜎
𝑟𝑒𝑓) = 𝐵𝜎𝑟𝑒𝑓𝑛 =
Δ̇𝑐𝑠𝑠
𝛽𝑑
[image:11.595.115.482.69.277.2]12
𝜎𝑟𝑒𝑓 = 𝜂𝑝̅, 𝑝̅ = 𝑃
𝑏𝑑
(6)
By representing equation (4) in an alternative form, such as equation (7), a plot of 𝐿𝑜𝑔(𝜀̇𝑠𝑠𝑐 )
versus 𝐿𝑜𝑔(𝜎) will produce a straight line [14]. The slope of the best linear fitting is the material constant n, and the intercept is Log(B).
𝐿𝑜𝑔(𝜀̇𝑠𝑠𝑐 ) = 𝐿𝑜𝑔(𝐵) + 𝑛𝐿𝑜𝑔(𝜎) (7)
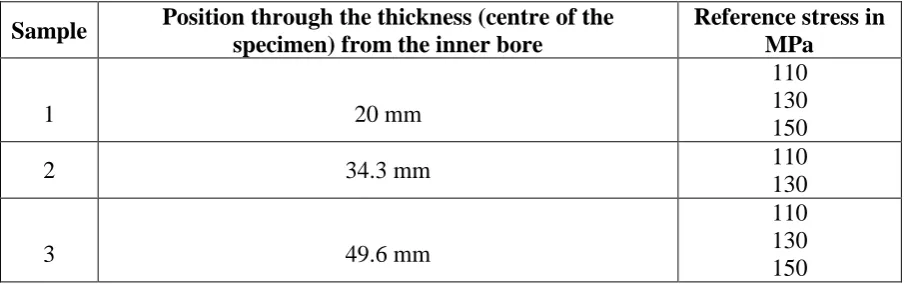
[image:12.595.72.525.375.517.2]For this work, impression creep test specimens have been machined through the thickness of the pipe section according to Figure 2 (a) and Figure 2 (b). A summary of the test program is collated in Table 4. All of the specimens have been tested at 575 °C.
Table 4. Impression creep test program.
Sample Position through the thickness (centre of the specimen) from the inner bore
Reference stress in MPa
1 20 mm
110 130 150
2 34.3 mm 110
130
3 49.6 mm
13
3
Characterisation of the pipe section material
3.1 Microstructure investigation
14
15
Figure 7. SEM images of specimens (a) T1 and (b) T4; details of the grain boundary precipitate of specimens (c) T1, (d) T4;
16
Figure 8. (a) SEM image of a cavity in specimen T1 and (b) detail of the cavity.
A sub-micron precipitate phase in the matrix of sample T2 and a rather coarse grain boundary precipitate, which might be an alloy carbide, have also been found, as shown in Figure 9 (a). The spectrum of the chemical composition of such precipitate is shown in Figure 9 (b) and reported in Table 5 for clarity. The concentration of heavy metals, excluding iron, results in 28.75%, which is higher than the 3% precipitates found in the outer surface of the pipe section (see Table 3). This means that the matrix surrounding the grain boundary precipitate is weaker than the matrix in the outer surface as, due to creep, it has lost most of the elements commonly used to strength a 0.5CrMoV material because of their migration to the grain boundary. However, this characteristic grain boundary precipitate was rarely observed in the analysed specimens.
[image:16.595.77.523.71.252.2] [image:16.595.77.522.521.710.2]17
Table 5. Chemical composition of precipitate in specimen T2.
Element Weight% Atomic%
O 2.25 7.73
Cr 8.56 9.06
Mn 8.40 8.42
Fe 69.01 68.03
Mo 11.79 6.76
Total 100.00 100.00
3.2 Hardness and replica investigation
Macro hardness values along the length of the pipe were found to be consistent in both the inner and the outer surfaces and are here plotted in Figure 10 (a) and Figure 10 (b), respectively. Standard deviation, mean, maximum and minimum values of the hardness data for each position are collated in Table 6. Very large scatter in hardness data at the weld position was observed, meaning that those data cannot be used in a predictive lifing model. This very large scatter in the readings in the weld are unusual based on macro hardness sampling of other similar weldments [1].
[image:17.595.76.522.404.633.2]18
Table 6. Standard deviation, mean, maximum and minimum values of the hardness data.
Inner Surface
Mean (HV) Std (HV) Min (HV) Max (HV)
3 mm 153.75 2.17 150.6 155.4
50 mm 150.43 1.76 148.6 152.3
97 mm 194.45 29.14 168 221.10
144 mm 152.73 3.85 148.20 157.60
191 mm 152.70 2.69 151.10 156.70
Outer Surface
3 mm 151.08 2.08 149.40 154.10
50 mm 152.73 2.75 150.70 156.70
97 mm 185.05 9.85 177.30 198.30
144 mm 194.45 8.81 182.80 203.50
191 mm 157.18 3.20 154.50 161.70
Table 7 shows the results of the cavitation assessment. The levels of cavitation in the Type IV region peaked at 240 cavs/mm2 at a distance of 5 mm below the outer surface of the pipe which is typical of that generally seen in service (cavitation usually initiates just below the weld capping bead at a depth of 2-3 mm below the pipe outer surface). A cavitation level of 240 cavs/mm2 is relatively low and could be managed in service with scheduled inspections before repair would be required.
The mid-weld position showed relatively low levels of cavitation close to the outer surface, in reality it is difficult to distinguish between reheat cavitation and genuine creep cavitation at these levels.
The levels of parent cavitation were much higher at position I when compared to position IV. It is also notable that the levels were consistent throughout the wall of the section, usually it would be expected that the levels would be higher at the outer surface of the pipe.
19
Table 7. Creep cavity count (in cavs/mm2) from the outer to the inner surfaces of the pipe section.
Replic a I Replica II Replica III Replica IV Position through the
thickness (mm)
Parent Weld Type
IV
Parent (10 mm from Type IV)
Parent
60 75 75 60 45 0
53 75 15 240 60 15
47 75 45 195 75 15
40 60 0 105 60 0
33 75 0 150 30 15
27 75 0 45 45 0
20 30 0 150 75 15
13 30 0 15 30 0
7 45 0 30 15 0
0 75 0 45 60 0
Replica I in Table 7 best correlates with the in-service inspection for location B of Figure 1, with creep cavity level assessed as isolated (10-50 cavities). Replica IV best correlate with the in-service inspection for location C. The in-service creep replica assessments for locations A, B and C were captured in 2009, and in the period until removal in 2014, the service duty accrued was an additional 28,997 hours. Hence, based on the surface replicas obtained in 2009 (Table 1) it is expected that replica position IV will have lower absolute cavity counts than replica position I. It is interesting that the intervening 28,997 hours of service has only increased the creep cavity assessment level at replica position I from isolated to low orientated. This has been summarized in Table 8. The slow rate of parent deterioration observed by replica assessment of the parent material in positions B and C suggests that the removal of parent material could be considered as premature.
20
Table 8. Summary of replica evolution between inspections in 2009 and 2014.
Age (hrs)
Position A Position B Position 10 mm from Type IV
Position C
242,773 Low orientated Isolated Unknown Clear
271,770 Unknown Low orientated Low orientated Isolated 3.3 Impression creep tests results
Figure 11 (a) presents the displacement versus time curves obtained by impression creep tests carried out through the thickness of the pipe section (positions 1, 2 and 3 are illustrated in Figure 2 (b)) at different stress levels at 575 °C, as summarized in Table 4. Figure 11 (b) shows minimum creep strain rates against stress from the impression creep tests and the linear best fit used to calculate Norton’s constants, n = 8.3361 and B = 1.009x10⁻²² (stress in MPa and time
in hours), which are in line with those found from uniaxial creep tests of similar material [20, 21].
Figure 11. (a) Impression creep test output through the pipe thickness at different stresses and under a temperature of 575 °C
and (b) relatively minimum creep strain rates versus stress.
[image:20.595.91.507.355.577.2]21 3.4 General comments on the through thickness behaviour
The through thickness behaviour of the pipe section is summarized in Figure 12, where hardness, replica and creep data are plotted against the pipe radius, r. Only parent material is considered. The macro-hardness values reported in the figure have been obtained by averaging data along the pipe section from Figure 10 (a) and Figure 10 (b) for the inner (r = 0 mm) and outer (r = 60 mm) surfaces, respectively. As shown in Figure 12, it is not possible to establish a definitive correlation between all of the disparate data collected.
The through section behaviour revels the following:
Creep cavity distribution at replica positions I and III are broadly similar (and relatively consistent through section), and reflect parent material regions relatively close to the main weld and HAZ which accumulates the greatest through section creep cavity distribution. Replica position IV, which is further downstream from the weld, is as expected showing a consistent low or clear response.
The hardness values through thickness are again relatively consistent, which is reflected in the impression creep MSR values taken at three different positions.
The impression creep MSR varies as expected in response to the applied stress.
22
Figure 12. Through thickness behaviour of the pipe section.
3.5 Other ex-service material through section examinations
Other, but more limited studies, on the through thickness extent of creep cavitation on similar age and pedigree parent CrMoV materials has been undertaken. These studies relate to two large conventional power plants (stations A and B) in operation in the UK, with original operation commencing in the 1968-1970 period.
23
Figure 13. Station A, Unit 1, 2014. Main steam pipe through thickness creep cavity distribution.
Sections SM23 and SM71 were last inspected in service in 2009 (242,536 hours and 3552 unit starts).
3.6 Summary of through section creep cavity counts
24
Table 9. Summary of extent of through section creep cavitation.
Station(1)
and Unit
Specimen Identification
At Removal Cavitation Extent Peak
(2)
Year Hours Starts Within outer 10% of wall (6 mm) Within first 50% of wall (~ 30mm)
Beyond mid-section
A: 1 Bend SM23 2014 268,827 4133 Yes 200
Straight SM71 Yes 80
A: 1 Straight A
(3) 2009 242,536 3552 Yes 184
Straight B(3) Yes 216
Notes
(1) Station origin defined in section 3.6
(2) Represents the peak value at any position, apart from the surface value
(3) Adjacent bends showed evidence of greater distress (onset of surface micro-cracking)
In terms of the magnitude and through section extent of creep cavitation, parent material in bends tends to lead straight sections in terms of risk. There is no discernible relationship between the creep cavitation levels observed and the general in-service age (hours and starts) logged for each specimen, which is a simplistic but often used measure of life consumed by the station. The examination described for specimens in 2009 from station A, Unit 1 (Section 3.6.4) illustrate not only the circumferential variation in creep cavity count but also the differences that can be observed from different and reputable service providers. Hence, in practice creep cavity counts are not used to provide a quantitative estimate of the remaining in-service life of components.
4
Discussion
25 could be safely managed for example by modestly de-rating the operating temperatures, by circa 5-10 °C.
Table 9 summarises examinations other ex-service CMV specimens, all of a similar age to the specimen examined in this paper. Pipe bends might be expected to show greater evidence of creep damage; however, the inspections undertaken are quite limited and focussed only on through thickness sections originating from the extrados and with no reference to the acting pipe system loads, which will likely be greater at bend positions. This emphasises the need to correlate any material examinations with measures or estimates of the active in-service loads, which can be obtained if periodic hot and cold pipe hanger surveys are undertaken in addition to regular surveys of operating temperature and pressure.
The impression creep tests used material at different positions through the pipe thickness (Figure 2) and located between the replica III and replica IV locations identified in Table 7. These show generally consistent creep cavity count and hardness values through the thickness, illustrated in Figure 12. Importantly the impression creep tests reveal a fairly consistent MSR through thickness, and at three different stress levels.
The condition of the parent CMV material examined is such that it could have been retained in service for at least another operating period.
4.1 Implications
The examination of the specimen has not identified a notable through section ‘damage’ gradient (Figure 12) by impression creep test, hardness test or surface replica. The material is in surprisingly good condition considering its long service duty. The comparison with data from prior outage examinations has identified a very gradual change in hardness and the level ascribed for creep cavitation. Other very extensive surveys of periodic surface hardness and creep replica [22] has confirmed a gradual (measurable) change over a typical operating period of ~ 20-25Khr for this material.
26 inspection data, coupled with targeted small specimen test results has been described in detail within the context of a new holistic life assessment framework [1].
The use of impression creep tests in this example, and in conjunction with scrutiny of the available information on operating conditions and prior inspections has emphasised the importance of adopting a more rigorous approach to condition assessment. This more rigorous approach can be facilitated by the use of small specimen testing and ideally coupled with more predictive capabilities provided by computational models [1] and use of on-load data from the operating plant.
5
Conclusions and future work
The study has emphasised the importance of correlating the operating conditions (temperature and stress) with the results from metallurgical examinations and small specimen creep tests. The specimen parent material is degrading at an unusually slow rate for this service age and can be considered to have been retired from service too early.
The use of traditional hardness and creep replica methods has revealed relatively uniform damage throughout the pipe section.
Impression creep tests have produced results in agreement with uniaxial tests of similar materials [20, 21]. Importantly, extrapolation of the MSR to plant stress levels confirms the slow rate of degradation observed from the limited operational data available and detailed examination of the parent material.
The thorough examination of this CMV specimen has confirmed the importance of also acquiring the fullest understanding of the operational conditions (temperature and stress). Operating stations will not necessarily have the luxury of being able to regularly remove pipe sections for through section examination of the nature described in this paper. They will rely on limited small specimen sampling from the component surface at various stages through life, which therefore provides a reference condition or measurement.
27 a best-fit equation by using data at higher stresses, however the design of a smaller testing machine is part of the future work of the present authors in order to increase the test reliability.
Acknowledgments
This work is supported by the Engineering and Physical Sciences Research Council (EPSRC) through the Flexible and Efficient Power Plant project (Flex-E-Plant, Grant number: EP/K021095/1). We also thank the following partners for their valuable contributions: GE Power, Doosan Babcock Limited, Centrica plc., EDF Energy (West Burton Power) Limited, Uniper Technologies Limited, Goodwin Steel Castings Limited, NPL Management Limited, R-MC Power Recovery Limited, RWE Generation UK plc., Scottish and Southern Energy (SSE) plc., Siemens Industrial Turbomachinery and TWI Limited.
The authors would like to acknowledge the Flex-E-Plant consortium and EDF Energy for permission to publish this paper. Acknowledges also go to Mr Shane Maskill (the University of Nottingham) for his expert assistance in experimental testing, and to Mr Mike Goodbun (RWE Generation UK plc), Mr Bin Azahari Ahmad (the University of Nottingham) and Dr Xu Xu (the University of Loughborough) for their help and support on material characterization of the present paper.
References
1. Morris, A., B. Cacciapuoti, and W. Sun, The Role of Small Specimen Creep Testing within a Life Assessment Framework for High Temperature Power Plant. International Materials Reviews, 2018. 63(2): p. 102-137.
2. Palmer, I.A., Condition Monitoring and Optical Strain Measurement for Power Industry Components. PhD Thesis, Imperial College London, April, 2011.
3. Bernd, H. and M. Bernd, Suitability of the various replica materials for use in surface replication on warm components. Steel Research, 1996. 67(9): p. 390-393.
4. Abson, D.J., 17 - Power plant welds and joints: materials management and performance improvement A2 - Oakey, John E, in Power Plant Life Management and Performance Improvement. 2011, Woodhead Publishing. p. 635-665.
28 6. Rolls-Royce Power Engineering Plc, Scoop Sampling – Extraction of Material Samples
for Examination and Analysis. 2010.
7. Brett, S.J., Small Scale Sampling and Impression Creep Testing of Aged ½CrMoV Steam Pipework Systems, in Proc. of ECCC Conf. on Creep and Fracture in High Temperature Components - Design and Life Assessment. April 2009: Dübendorf, Switzerland. p. 1088-1096.
8. Klevtsov, I. and A. Dedov. Impact of Small Specimens Sampling on Durability of In-Service Power Plant Components. in SSTT. Proceedings of the 2nd International Conference SSTT: Determination of Mechanical Properties of Materials by Small Punch and Other Miniature Testing Techniques. October 2-4, 2012. Ostrava, Czech Rep.
9. Hyde, T.H. and W. Sun, Evaluation of Conversion Relationships for Impression Creep Test at Elevated Temperatures. International Journal of Pressure Vessels and Piping, 2009. 86(11): p. 757-763.
10. Hyde, T.H. and W. Sun, Application of Impression Creep Test Data for the Assessment of Service Exposed Power Plant Components. Metallurgical Journal - Theme 3: Numerical Approach, 2010. Vol. LXIII: p. 138-145.
11. Hyde, T.H., B.S.M. Ali, and W. Sun, Analysis and Design of a Small, Two-Bar Creep Test Specimen. ASME. Journal of Engineering Materials and Technology, 2013. 135(4): p. 041006-041006-041009.
12. Tabor, D., The hardness of solids. Review of Physics in Technology, 1970. 1(3): p. 145. 13. Vander Voort, G.F. and G.M. Lucas, Microindentetion Hardness testing. Advanced
Materials and Processes, 2000. 9/98: p. 21-25.
14. Hyde, T.H., W. Sun, and C.J. Hyde, Applied Creep Mechanics. 2013: McGraw-Hill Professional.
15. Hyde, T.H., B.S.M. Ali, and W. Sun, On the Determination of Material Creep Constants Using Miniature Creep Test Specimens. Journal of Engineering Materials and Technology, 2014. 136: p. 021006-021001-021010.
16. Sun, W., T.H. Hyde, and S.J. Brett, Small Specimen Creep Testing and Application for Power Plant Component Remainig Life Assessment, in IRF2013 - 4th International Conference on Integrity, Reliability and Failure. 2013: Funchal, Portugal.
17. MacKenzie, A.C., On the use of a Single Uniaxial Test to Estimate Deformation Rates in Some Structures Undergoing Creep. International Journal of Mechanical Sciences, 1968. 10(5): p. 441-453.
18. Penny, R.K. and D.L. Marriott, Design for creep, ed. 2nd. 1995, London: Chapman and Hall.
19. Hyde, T.H., W. Sun, and A.A. Becker, Analysis of the Impression Creep Test Method Using a Rectangular Indenter for Determining the Creep Properties in Welds.
29 20. Hyde, T.H., W. Sun, and J.A. Williams, Creep behaviour of parent, weld and HAZ materials of new, service-aged and repaired 1/2Cr1/2Mo1/4V: 2 1/4Cr1Mo pipe welds at 640°C. Materials at High Temperatures, 1999. 16(3): p. 117-129.
21. Cacciapuoti, B., W. Sun, D.G. McCartney, A. Morris, S. Lockyer, N.A. Razak, C.M. Davies, and J. Hulance, An Evaluation of the Capability of Data Conversion of Impression Creep Test. Materials at High Temperatures, 2017. 34(5-6): p. 415–424. 22. Morris, A., B. Cacciapuoti, and W. Sun, The Role of Hardness on Condition Monitoring
and Lifing for High Temperature Power Plant Structural Risk Management.
![Figure 5. (a) Impression creep test specimen adapted from ref. [16] and (b) schematic diagram showing the specimen loading arrangement, adapted from ref](https://thumb-us.123doks.com/thumbv2/123dok_us/8553842.363630/11.595.115.482.69.277/figure-impression-specimen-adapted-schematic-diagram-specimen-arrangement.webp)