City, University of London Institutional Repository
Citation
: Al Arif, S.M.M.R. (2018). Fully automatic image analysis framework for cervical
vertebra in X-ray images. (Unpublished Doctoral thesis, City, University of London)This is the accepted version of the paper.
This version of the publication may differ from the final published
version.
Permanent repository link:
http://openaccess.city.ac.uk/19184/Link to published version
:
Copyright and reuse:
City Research Online aims to make research
outputs of City, University of London available to a wider audience.
Copyright and Moral Rights remain with the author(s) and/or copyright
holders. URLs from City Research Online may be freely distributed and
linked to.
Fully Automatic Image Analysis
Framework for Cervical Vertebra in
X-ray Images
S M Masudur Rahman AL ARIF
Department of Computer Science
City, University of London
A thesis submitted in partial fulfillment of the requirement for the degree of
Doctor of Philosophy
To my wonderful parents who have raised me to be the person I am today, for their
Declaration
I hereby declare that except where specific reference is made to the work of others, the
contents of this dissertation are original and have not been submitted in whole or in part
for consideration for any other degree or qualification in this, or any other university. This
dissertation is the result of my own work and includes nothing which is the outcome of
work done in collaboration, except where specifically indicated in the text. This dissertation
contains less than 65,000 words including appendices, bibliography, footnotes, tables and
equations and has less than 150 figures. I grant powers of discretion to the City, University
of London librarian to allow the dissertation to be copied in whole or in part without further
reference to myself (the author). This permission covers only single copies made for study
purposes, subject to normal conditions of acknowledgement.
S M Masudur Rahman AL ARIF
Acknowledgements
In the name of the God, the most beneficent, the most merciful. Praise be to Him, who
has enabled me to pursue this program and allowed me to complete my dissertation in due
time with good health.
My profound and hearty gratitude is to my supervisor Greg Slabaugh, for giving me
the opportunity to work on a topic of my passion and guiding me throughout my journey
as a researcher. I have been incredibly blessed to have a supervisor who was always
approachable, available, friendly and willing to help. His work ethic and dedication towards
his responsibilities are exemplary, which I would like to replicate in my future endeavors.
Special thanks to Karen Knapp, Michael Gundry, Andy Appelboam and Adam Reuben,
without their time and help with the datasets and clinical expertise, this dissertation would
not have been possible. I am grateful to Michael Phillips for his technical support.
I would also thank my examiners, Nasir Rajpoot and Tillman Weyde, for their time and
interest in my work, and for their feedback which influenced the quality of this dissertation.
Tillman Weyde has also examined my MPhil-PhD transfer, so has had a significant influence
on my journey. I would also like to extend my gratitude to Artur Garcez, Constantino Carlos
Reyes-Aldasoro and Vladimir Stankovic for their interest, advice, and suggestions that had a high impact on my research. Special thanks to the senior tutors for research, Evangelia
Kalyvianaki, for chairing my MPhil-PhD transfer, and Radu Jianu for approving my transfer
to write-up status and chairing my PhD oral examination.
This research would not have been possible without the three-year studentship from City, University of London. I would like to thank the university, graduate school and my supervisor
for supporting me financially to attend several international conferences. My experience at
City would not have been smooth and jolly without the help of the academic support staff.
My heartiest gratitude goes to Naina Bloom, Nathalie Chatelain, Mark Firman, Paula Green,
David Mallo-Ferrer, and Gill Smith, for their help on numerous occasions.
I have been fortunate to have worked alongside a group of enthusiastic researchers. I owe
a special thanks to Muhammad Asad for being a good friend, a mentor and an advisor, for
the last three years. Last but not the least, I gratefully acknowledge the valuable feedback
on my dissertation from Atif Riaz, Rilwan Remilekun Basaru, Nathan Olliverre and Aamir
Abstract
Despite the advancement in imaging technologies, a fifth of the injuries in the cervical spine remain unnoticed in the X-ray radiological exam. About a two-third of the subjects with unnoticed injuries suffer tragic consequences. Based on the success of computer-aided systems in several medical image modalities to enhance clinical interpretation, we have proposed a fully automatic image analysis framework for cervical vertebrae in X-ray images. The framework takes an X-ray image as input and highlights different vertebral features at the output. To the best of our knowledge, this is the first fully automatic system in the literature for the analysis of the cervical vertebrae.
The complete framework has been built by cascading specialized modules, each of which addresses a specific computer vision problem. This dissertation explores data-driven supervised machine learning solutions to these problems. Given an input X-ray image, the first module localizes the spinal region. The second module predicts vertebral centers from the spinal region which are then used to generate vertebral image patches. These patches are then passed through machine learning modules that detect vertebral corners, highlight vertebral boundaries, segment vertebral body and predict vertebral shapes.
In the process of building the complete framework, we have proposed and compared different solutions to the problems addressed by each of the modules. A novel region-aware dense classification deep neural network has been proposed for the first module to address the spine localization problem. The proposed network outperformed the standard dense classification network and random forest-based methods.
Location of the vertebral centers and corners vary based on human interpretation and thus are better represented by probability maps than single points. To learn the mapping between the vertebral image patches and the probability maps, a novel neural network capable of predicting a spatially distributed probabilistic distribution has been proposed. The network achieved expert-level performance in localizing vertebral centers and outperform the Harris corner detector and Hough forest-based methods for corner localization. The proposed network has also shown its capability for detecting vertebral boundaries and produced visually better results than the dense classification network-based boundary detectors.
Segmentation of the vertebral body is a crucial part of the proposed framework. A new shape-aware loss function has been proposed for training a segmentation network to encourage prediction of vertebra-like structures. The segmentation performance improved significantly, however, the pixel-wise nature of proposed loss function was not able to constrain the predictions adequately. To solve the problem a novel neural network was proposed which predicts vertebral shapes and trains on a loss function defined in the shape space. The proposed shape predictor network was capable of learning better topological information about the vertebra than the shape-aware segmentation network.
Table of contents
List of figures xvii
List of tables xxix
1 Introduction 1
1.1 Motivation . . . 1
1.2 Research Question and Objectives . . . 4
1.3 Original Contributions . . . 5
1.4 List of Publications . . . 9
1.4.1 Journals . . . 9
1.4.2 Conferences . . . 9
1.4.3 Clinical Abstracts . . . 10
1.4.4 Publications in Collaboration . . . 11
1.5 Dissertation Outline . . . 11
2 Background 13 2.1 Spine and Vertebrae . . . 13
2.1.1 Cervical Spine Injuries . . . 16
2.2 Literature Review . . . 18
2.3 The Dataset . . . 22
2.3.1 Manual Annotation . . . 26
2.4 Initial Framework . . . 27
2.4.2 ASM Search . . . 29
2.5 Machine Learning . . . 32
3 Spine Localization 33 3.1 Spine Localization using Random Forest . . . 34
3.1.1 Overview . . . 35
3.1.2 Training Data for Random Classification Forest . . . 35
3.1.3 Training Random Forest . . . 38
3.1.4 Spine Localization . . . 39
3.2 Deep Learning-based Spine Localization . . . 44
3.2.1 Overview . . . 44
3.2.2 Network Architectures . . . 46
3.2.3 Training . . . 47
3.3 Experiments and Metrics . . . 50
3.4 Results . . . 51
3.5 Conclusion . . . 56
4 Center Localization 59 4.1 Overview . . . 61
4.2 Ground Truth . . . 61
4.3 Methodology . . . 65
4.3.1 Network . . . 65
4.3.2 Training . . . 66
4.3.3 Inference and Post-processing . . . 68
4.4 Experiments and Metrics . . . 70
4.5 Results . . . 71
4.6 Conclusion . . . 77
Table of contents xiii
5.1.1 Vertebral Patch Extraction . . . 82
5.1.2 Edge and Corner Detection . . . 83
5.2 Hough Forest-based Vertebral Corner Detector . . . 85
5.2.1 Patch Extraction and Labels . . . 86
5.2.2 Feature Vector . . . 87
5.2.3 Training . . . 88
5.2.4 Prediction . . . 89
5.2.5 Parameters . . . 91
5.3 Deep Probabilistic Vertebral Corner Localization . . . 91
5.3.1 Ground Truth . . . 92
5.3.2 Framework . . . 93
5.3.3 Network . . . 94
5.3.4 Post-processing . . . 96
5.4 Results and Discussion . . . 98
5.5 Conclusion . . . 104
6 Boundary Detection and Segmentation 107 6.1 Introduction . . . 107
6.2 Overview . . . 110
6.3 Ground Truth . . . 110
6.4 Network and Training . . . 112
6.5 Experiments . . . 117
6.5.1 Test Patch Extraction . . . 118
6.5.2 Compared Algorithms . . . 119
6.5.3 Inference and Metrics . . . 120
6.6 Results . . . 122
6.6.1 Boundary Detection . . . 122
6.6.2 Segmentation . . . 130
6.6.3 Qualitative Results on NHANES-II Dataset . . . 134
7 Shape Prediction 139
7.1 Overview . . . 139
7.2 Ground Truth Generation . . . 141
7.2.1 Level-set Basics . . . 141
7.2.2 Conversion of Manual Annotations to SDFs . . . 142
7.2.3 Principal Component Analysis and Shape Parameters . . . 142
7.3 Methodology . . . 144
7.4 Experiments . . . 146
7.5 Results . . . 147
7.5.1 Corner Localization from Predicted Shapes . . . 154
7.6 Conclusion . . . 156
8 Fully Automatic Framework 159 8.1 Connecting the Dots . . . 159
8.2 Complete Framework . . . 161
8.3 Qualitative Evaluation . . . 164
8.4 Quantitative Evaluation . . . 172
8.5 Future Work and Conclusion . . . 174
9 Conclusion 177 9.1 Summary . . . 177
9.2 Outcomes . . . 178
9.2.1 Fully Automatic Framework . . . 180
9.3 Future Work . . . 181
9.3.1 Limitations . . . 181
9.3.2 Unsuccessful Attempts . . . 183
9.3.3 Directions for Future Research . . . 184
9.4 Personal Experience . . . 186
Table of contents xv
Appendix A Supplementary Experiments and Results 205
A.1 Dataset A . . . 205
A.2 Effect of ROI Selection on HarrisNB . . . 206
A.3 Additional Feature Vectors for HoughF . . . 206
A.4 Optimization of Parameters for HoughF . . . 209
A.5 Additional Results for HoughF . . . 211
Appendix B Random Forest and Deep Learning 213 B.1 Random Forest . . . 213
B.2 Deep Learning . . . 215
B.2.1 Perceptron . . . 216
B.2.2 Multi-layer Perceptron . . . 219
B.2.3 Convolutional Neural Network . . . 219
B.2.4 Fully Convolutional Network . . . 221
List of figures
1.1 (a) An example cervical spine radiograph. This patient has retrolisthesis
(displacement) of vertebra C3 onto C4 and C4 onto C5 (b) the conceptual
injury detection system performs analysis of the image and predicts
ver-tebral shapes (c) verver-tebral alignments are checked based on the predicted
shapes, and possible location of abnormalities are highlighted to draw the
radiologist’s attention to the detected injury. . . 3
1.2 Vertebra segmentation with manually clicked vertebral centers and active
shape model (a) input image and manually clicked vertebral center points
(+) (b) initialized active shape models on the vertebrae (−) (c) converged
vertebral shapes (−) (d) converged vertebral shapes (−) with ground truth
shapes (−). . . 6
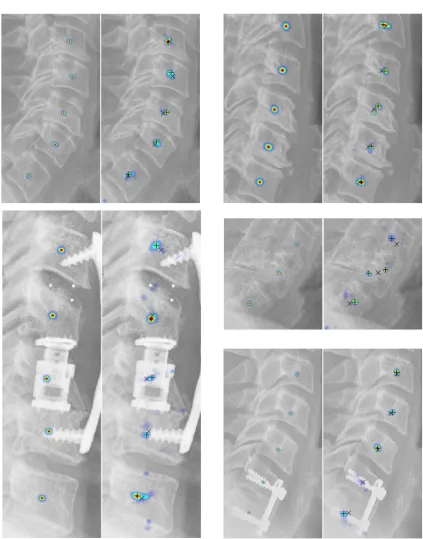
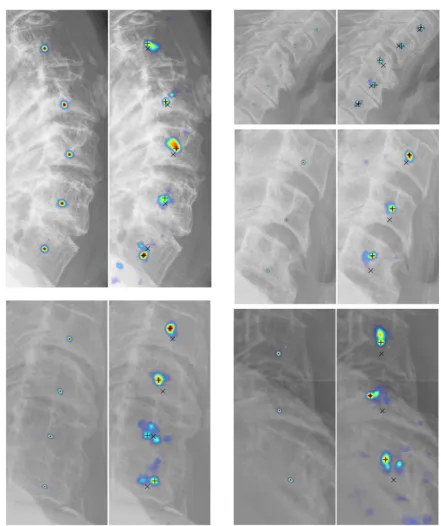
1.3 Fully automatic vertebral image analysis framework (a) input image (b)
localized spinal region (blue overlay) (c) localized vertebral centers (+)
(d) localized vertebral corners (×) (d) predicted vertebral boundaries (blue
overlay) with ground truth shape (−) (e) predicted segmentation masks (blue
overlay) with ground truth shape (−) (f) predicted vertebral shapes (−) with
ground truth shape (−). . . 8
2.1 Visualization of the vertebral column reproduced from [1]. . . 14
2.2 Standard views for cervical vertebrae (a) lateral (b) anterior-posterior (c)
odontoid process. . . 14
2.4 Sublaxation injuries (a) spondylolisthesis (b) retrolisthesis. . . 16
2.5 Vertebral fracture (a) normal vertebra (b) different types and grades of
com-pression fractures. . . 17
2.6 Degenerative changes (a) osteoporosis (b) osteophytes. . . 18
2.7 Intensity variation in the (a) training and (b) test dataset: Maximum intensity
(+), minimum intensity (+), mean intensity (×), length of the vertical blue
line indicates the standard deviation of the intensity distribution per image. . 23
2.8 (a) Distribution of image resolution in the dataset (b) variation of patient age
in the dataset. . . 24
2.9 (a) Variation of patient sex in the dataset (b) Radiography systems used for
X-ray image acquisition. . . 24
2.10 Examples of images in the dataset (a) bone loss (b) osteophytes (c)
degenera-tive changes (d) retrolisthesis (e) surgical implant (f) spondylolisthesis (g)
image artefacts (h) compression fracture (i) surgical implant (j) retrolisthesis. 25
2.11 Manual segmentation: manually demarcated center (×), corner (+) and
boundary (o) points. The blue curve (−) represents the splined vertebral
boundary. . . 26
2.12 Equally spaced reconfiguration of manually clicked points: original points
(+++) and reconfigured points (×××). . . 28
2.13 Procrustes registration (a) unregistered shapes (b) centered (translation) (c)
centered and scaled (d) centered, scaled and rotated (registered shapes) [2]. 28
2.14 (a) Unregistered and (b) registered vertebral shapes for vertebra C3. . . 29
2.15 The blue shape represents the mean shape. The green and the red shapes
represent variation in the positive and negative direction for the (a) first, (b)
second and (c) third modes of variation. . . 29
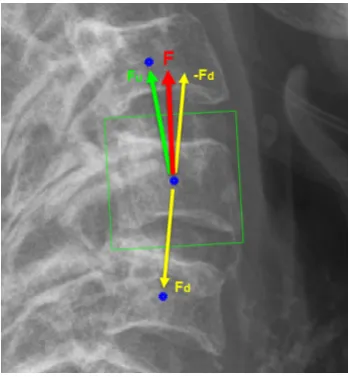
2.16 Computation of the orientation vector,FFF. Vertebrae centers (o). The green
List of figures xix
2.17 ASM search: on the left image, the mean shape is shown in magenta, points
on the mean shape are shown as blue circles and the normal profiles are
shown with green lines. An example of intensity profile in the normal
direction is shown on the right, with a dotted line demarcating a possible edge. 31
3.1 (a) Positive patch boundaries around a vertebra with different orientations
and sizes (b) the green box indicates the region from where the positive
patches collected and the blue boxes indicates the region from where 50% of
the negative patches are collected. . . 36
3.2 (a) Input image patch of size 16×16 (b) smoothed input image (c) gradient
magnitude at the original scale (d-g) gradient orientations with four different
directions at original scale (h) gradient magnitude after down-sampling (i-l)
gradient orientations with four different directions after down-sampling. . . 37
3.3 (a) Sparsely generated image patches to be fed into the trained random
forest (b) coarse bounding box (blue) with densely sampled patches for fine
localization of the spine (c) final bounding box localizing the spinal region.
For simplicity, multiple orientations, sizes, and overlapping patches have not
been demonstrated. . . 39
3.4 (a) Positive votes on the image (b) resultant distribution (H) (c) H after
binarization (d)Hafter elimination of invalid areas with the minimum bound
parallelogram (yellow). . . 40
3.5 Examples of X-ray images and corresponding ground truth. The ground
truth is in blue and overlaid on the original image in the right of each image
pair. The vertebrae are shown in green to highlight the difference between
the spine localization ground truth and the actual vertebrae. . . 45
3.6 (a) Legend (b) FCN (c) DeConvNet (d) UNet. . . 46
3.7 Boxplots of the quantitative metrics. . . 52
3.8 Qualitative results. The green represents true positive (TP), the blue
rep-resents false positive (FP), and the red reprep-resents the false negative (FN)
3.9 Qualitative results for challenging cases. The green represents true positive
(TP), the blue represents false positive (FP), and the red represents the false
negative (FN) pixels. . . 54
3.10 Localization results (blue overlay) on NHANES-II dataset using FCN-R
method. . . 56
4.1 Variation of manually clicked vertebral centers: ground truth center (+),
centers clicked by two experts (×, ×) multiple times. The yellow circle
represents a 3 mm distance from the ground truth center to illustrate the
extent of variation for the expert clicked centers. . . 62
4.2 (a) Different parameter required for probabilistic ground truth generation (b)
grid points for training patches. . . 63
4.3 Probabilistic distribution for vertebral centers. The heatmap overlay
repre-sents the probability of the manually clicked centers. . . 64
4.4 Patch-level ground truth for center localization. . . 65
4.5 Probabilistic spatial regressor UNet for center localization (a) network
archi-tecture (b) legend. . . 66
4.6 Test patch extraction process (a) localized spinal region (b) horizontal center
points of the localized area (.) (c) 15 uniformly distributed at the approximate
central axis of the region (o) (d) box drawn at the boundaries of each of the
45 extracted patches. Different colors indicate different patch sizes. . . 68
4.7 Center localization post-processing (a) predicted probability map on the
original image (b) thresholded map and potential centers (+) (c) filtered
centers after proximity analysis (d) five most probable centers. . . 69
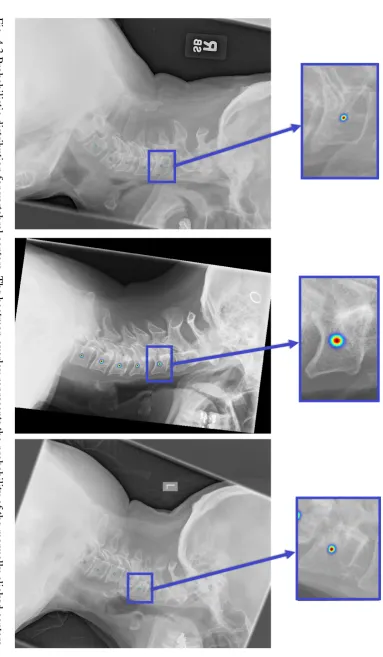
4.8 Image patch (left), ground truth probability (middle) and predicted
proba-bility (right) with corresponding Bhattacharyya coefficients: (a) 0.8285 (b)
0.7153 (c) 0.3304 (d) 0.6149 (e) 0.4353 (f) 0.3715. . . 72
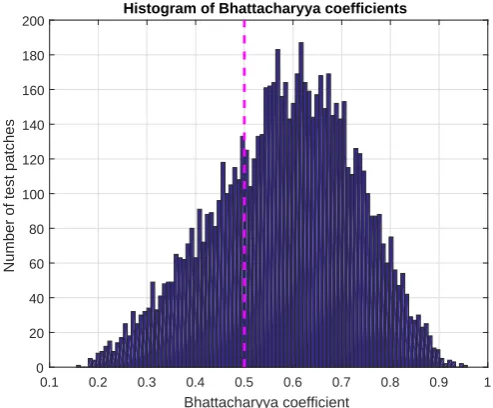
4.9 Histogram of Bhattacharyya coefficients. . . 72
List of figures xxi
4.11 Patch-level center localization results for vertebra patches collected from
NHANES-II dataset: input image patch (left) and predicted probability map
overlayed as a heatmap on the input image patch (right). The ground truth
information was not available for this dataset. . . 73
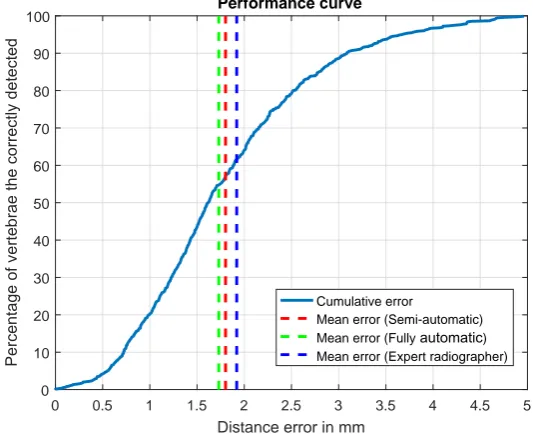
4.12 Performance curve for center localization. The blue curve (−−−) represents
what percentage of the correctly detected vertebrae (vertical axis) has a
distance error (horizontal axis) lower than specific values. . . 74
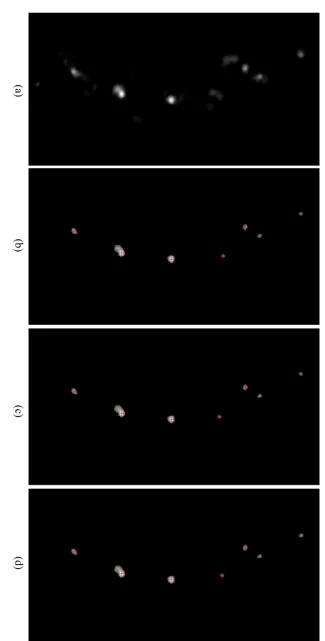
4.13 Qualitative center localization results. For each pair, ground truth distribution
is shown on the left, prediction distributions are shown on the right. On
the predicted image, the ground truth center is denoted as a cross (×) and
predicted centers are denoted as plus (+). . . 75
4.14 More qualitative center localization results. Refer to the caption of Fig. 4.13
for legend. . . 76
5.1 Vertebral corners detected by the Harris corner detector (+). . . 81
5.2 Harris-based vertebral corner detector (a) original X-Ray (b) cropped ROI
(c) ROI at different scales (d) Harris Corner detector output at each scale (e)
binary edge image (EIO) (f) output of Corner-Edge filter: P(C|I)(g)P(L|I)
(h) final distribution:P(C,L|I), corners are pointed out by red arrows. . . . 81
5.3 Vertebral patch/ROI extraction. . . 82
5.4 Normalized corner distribution in the dataset. . . 83
5.5 (a) Different ROIs: square (blue), rectangle (red), trapezoid (green) (b)
vertebra inside different ROI: square (top), rectangle (middle) and trapezoid
(bottom). . . 83
5.6 (a) Training and (b) test flowcharts for the Hough forest-based vertebral
corner detector. . . 85
5.7 Hough forest training (a) class labels and (b) vectors. . . 86
5.8 Appearance of intensity and gradient patches. . . 87
5.10 KDE: The heat map denotes the confidence of the aggregated probability
distribution p(ddd1_out). Red crosses indicate the positions of the inputddd1_in
vectors and green circle represents the maxima ofp(ddd1_out)and output vector
d
dd1_out. . . 90
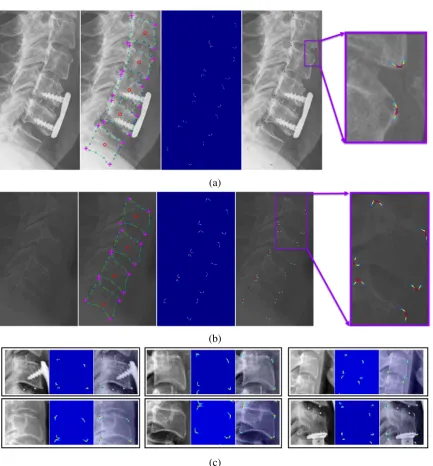
5.11 (a-b) Zoomed X-ray images (left), manual annotations (middle-left): center
(o), manually clicked boundary points (×), corner points (+) and splined
vertebrae curve (−), heatmap of the probability distributions for the corners
(middle-right) and heatmap overlayed on the X-ray image (c) training image
patches and corresponding patch-level ground truth probability distributions. 93
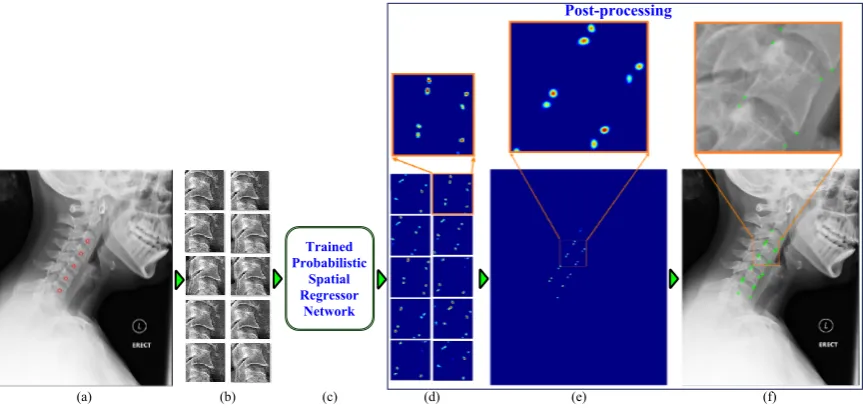
5.12 Framework block diagram (a) input image with manually clicked vertebral
centers (b) image patches (c) proposed network (d) patch-level predictions
(e) image-level prediction (f) localized corners. . . 94
5.13 (a) Network architecture (b) legend. . . 95
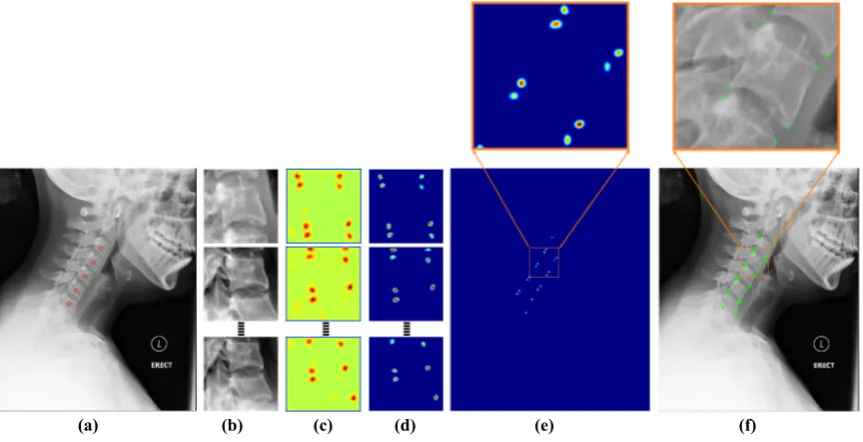
5.14 Post-processing (a) input image with manually clicked vertebral centers (b)
extracted image patches to be sent forward through the network (c)
patch-level prediction results from the network (d) patch-patch-level predictions after
removing residual probabilities (e) image-level prediction (f) localized corners. 97
5.15 Histogram plot of Bhattacharyya coefficients for patch-level predictions for
PSRN. . . 98
5.16 Qualitative analysis of the predictions from PSRN (a) patches from the test
dataset: input image patch - PSRN prediction (overlayed on the input patch)
- ground truth distribution (overlayed on the input patch) (b) vertebra patches
collected from NHANES-II dataset: input image patch - PSRN prediction. . 100
5.17 Cumulative error curve for different corner localization methods. . . 101
5.18 (a) Boxplot of the errors for different corners and (b) boxplot of the errors
for different vertebrae for PSRN-based corner localization method. . . 102
5.19 Vertebra-level corner predictions: ground truth (+), PSRN (o), HarrisNB
List of figures xxiii
5.20 Vertebral corner prediction using PSRN-based framework: ground truth (+),
PSRN-based corner prediction (o). The magenta circles (O) indicates the
subluxation injuries. . . 104
6.1 Ground truth for edge detection networks (a) input vertebrae (b) manually
annotated vertebral boundary (c) binary ground truth for boundary detection
and (d) probabilistic ground truth for boundary detection and (e) binary
ground truth for segmentation. . . 111
6.2 Network architectures (a) common architecture and (b) legend (c) end
mod-ules for dense classification networks for boundary detection and
segmenta-tion (d) end modules for probabilistic networks: PSRN and (e) PSRN-H. . . 113
6.3 Shape-aware loss (a) ground truth mask (b) prediction mask (c) ground truth
shape,CGT (green) and prediction shape, ˆC(red) (d) refined pixel space, ˆΩp:
false positive (purple) and false negative (red). . . 115
6.4 Histogram-based spatial normalization layer. (a)-(c) illustrate the
resid-ual probability problem of the previous chapter. (d)-(g) summarizes the
histogram-based solution to this problem. (a) input feature map (b)
fea-ture map after min subtraction (c) resulted probability distribution from the
original spatial normalization layer (d) histogram of the input feature map
(e) background value subtracted feature map (f) negative value replaced by
zeros (g) resulting probability distribution from the histogram-based spatial
normalization layer. . . 116
6.5 Test patch extraction process (a) manually annotated centers (×), orientation
vectors (↑) and patch boundaries in blue (b) extracted test patches. . . 118
6.6 Performance of the ASM-based initial framework (left) and performance
of the ASM-G method trained in this chapter (right). Converged vertebral
6.7 Dice similarity coefficient (DSC) with different matching distances for
bound-ary detection (a) binbound-ary ground truth (b) binbound-ary prediction (c) overlap
be-tween the ground truth and the prediction. Green indicates true positive, blue
false positives and red false negatives. With matching distance,d=0, the
DSC=0.53 and withd=1, theDSC=0.94. . . 121
6.8 Cumulative metric curves (a) Dice similarity coefficients (b) Bhattacharyya
coefficients. . . 123
6.9 Boxplots of quantitative metrics (a) Dice similarity coefficients (b)
Bhat-tacharyya coefficients. . . 124
6.10 Patch-level edge detection results 1. . . 125
6.11 Patch-level edge detection results 2. . . 126
6.12 Post-processing for reducing thickness of the predicted distribution (a)
in-put test vertebrae (b) probabilistic ground truth (c) thick prediction of the
probabilistic networks (d) eroded predictions (PSRN-He). . . 127
6.13 Image-level edge detection results 1. PSRN-Heindicates the eroded (thinned)
patch-level predictions are used. . . 128
6.14 Image-level edge detection results 2. . . 129
6.15 Cumulative distribution of point to curve (Ep2c) errors. . . 131
6.16 Boxplots of quantitative metrics (a) pixel-level accuracy (b) Dice similarity
coefficients (c) point to ground truth curve error,Ep2c. . . 132
6.17 Qualitative segmentation results: true positive (green), false positive (blue)
and false negative (red). . . 133
6.18 Comparison of segmentation performance for vertebrae with severe clinical
condition. . . 134
6.19 Qualitative boundary detection and segmentation results for vertebrae
col-lected from the NHANES-II: input image patch – predicted vertebral
bound-ary – segmented vertebral body. The predictions are displayed on the input
List of figures xxv
7.1 Examples of training vertebrae: original image (left), pixels at the zero-level
set of the SDF (center) and the SDF (right). Darker tone represents negative
values. . . 142
7.2 UNet for shape prediction (a) network layers (except the final layer) (b) legend.145
7.3 Final layer. . . 146
7.4 Cumulative error curves (a) average point to curve error (Ep2c) and (b)
Hausdorff distance (dH). . . 150
7.5 Boxplots of quantitative metrics (a) average point to curve error (Ep2c) and
(b) Hausdorff distance (dH) on the right. . . 150
7.6 Qualitative results for comparatively less challenging examples. The
pre-dicted shape is plotted in blue and the ground truth in green. . . 151
7.7 Qualitative results for challenging examples. The predicted shape is plotted
in blue and the ground truth in green. . . 152
7.8 Qualitative results for challenging examples. . . 153
7.9 Qualitative results from NHANES-II dataset using LS-UNet-18. . . 153
7.10 Computing curvature of a point. . . 154
7.11 Localization of corners from predicted shapes (a) predicted shape points (b)
shape points divided into four quadrants (c) curvature magnitude plotted as a
line in the normal direction (d) corners (×) localized based on the maximum
curvature magnitude in each quadrant. . . 155
8.2 Complete framework (1) spine localization: (1a) input image (1b) resized
and padded image of size 100×100 (1c) region-aware spine localization
network, FCN-R (1d) network output of size 100×100 (1e, 1f)
image-level spine localization result (2) center localization (2a) patch extraction
from localized spinal region (2b) extracted patches (2c) probabilistic spatial
regressor network (PSRN) (2d) patch-level center probabilities (2e)
image-level center probabilities (2f) localized centers (3a) vertebral image patch
extraction (3b) extracted vertebral image patches (4) corner localization (4a)
Bhattacharyya coefficient-based loss function equipped PSRN (4b)
patch-level corner probabilities (4c, 4d) post-processing and image-patch-level localized
corners (×) (5) boundary detection (5a) histogram-based normalization layer
equipped PSRN (5b) patch-level edge probabilities (5c, 5d) post-processing
and image-level vertebral boundaries (blue overlay) (6) segmentation (6a)
shape-aware SegNet-S (6b) patch-level segmentation results (6c, 6d)
post-processing and image-level segmented vertebrae (blue overlay) (7) shape
prediction (7a) LS-UNet-18 (7b) patch-level predicted shapes (7c, 7d)
post-processing and image-level predicted shape (blue) and localized corners
(×). . . 162
8.3 Qualitative results 1. Manually annotated vertebral boundaries are plotted in
green. . . 165
8.4 Qualitative results 2. Manually annotated vertebral boundaries are plotted in
green. . . 167
8.5 Qualitative results 3. Manually annotated vertebral boundaries are plotted in
green. . . 168
8.6 Qualitative results from NHANES-II dataset. . . 170
8.7 Qualitative results from NHANES-II dataset 2. . . 171
A.1 Example of images in Dataset A. . . 205
A.2 Appearance of intensity and gradient patches of different sizes. . . 207
List of figures xxvii
A.4 Bandwidth (BW), number of variables (nVar) and number of thresholds
(nT hresh) selection. . . 209 B.1 Decision tree: a tree starts with a set of training data at the root node. Based
on a cost function the data is divided into left and right child nodes. The
process is repeated at the split nodes. Each branch of the tree ends with a leaf
node. Leaf nodes are associated with a decision based on the set of training
data it contains. At test time, a new data point, X, starts at the root node and
follows a tree branch based on the splits learned during training. A decision
can be taken based on which leaf node it reaches. In this toy example, we
show a decision tree for a set of 32 characters containing two letters: ‘#’ and
‘%’. . . 214
B.2 Schematic of a biological neuron. . . 216
B.3 Schematic of Rosenblatt perceptron. . . 217
B.4 Sigmoid function. . . 217
B.5 Multiclass classification using perceptrons. . . 219
B.6 Multi-layer perceptron or fully connected network. . . 220
B.7 Convolutional Neural Network for digit classification (a) network
architec-ture (b) legend. . . 221
B.8 CNN (AlexNet) for large-scale image categorization (a) network architecture
(b) legend. . . 221
B.9 VGG-16 Net (a) network architecture (b) legend. . . 222
B.10 Fully convolutional network for image segmentation (VGG-16 FCN) (a)
network architecture (b) legend. . . 222
B.11 Deconvolutional network for image segmentation (a) network architecture
(b) legend. . . 223
B.12 UNet for medical image segmentation (a) network architecture (b) legend. . 223
B.13 Convolutional layer (a) input feature map (b) filters (c) output feature map
(d) legend. . . 225
B.15 Gaussian connection. . . 227
B.16 Rectified linear unit (ReLU). . . 228
List of tables
2.1 Literature review. . . 21
3.1 Optimized hyper-parameters for random forest. . . 39
3.2 Parameters and values for the random forest-based localization framework. 43
3.3 Average metrics for spine localization. . . 51
4.1 Performance of the center localization framework. The ‘semi-automatic’
patch creation process uses localization ground truth and the results reported
below are independent of the accuracy of the global localization framework.
Results from the fully automatic procedure which uses the localized spine
from the global localization framework are reported in the right under the
‘fully automatic’ patch creation process. . . 74
5.1 Euclidean distance between predicted and manually annotated corners. . . . 101
6.1 Dice similarity coefficients for binary boundary detection networks. . . 123
6.2 Bhattacharyya coefficients for probabilistic boundary detection networks. . 123
6.3 Average quantitative metrics for segmentation. . . 130
6.4 Average quantitative metric for shape prediction. . . 131
6.5 Comparison between SegNet and SegNet-S for cases with severe clinical
condition. . . 134
7.1 Dimensionality of different matrices and vectors. . . 144
7.3 Effect of number of eigenvectors on errors for LS-UNet. . . 148
7.4 Quantitative comparison of different methods. . . 149
7.5 Statistical significance test (t-test). . . 149
7.6 Corner localization from LS-UNet-18. . . 156
A.1 Effect of different ROIs on HarrisNB. . . 206
A.2 Optimized parameters for corner localization. . . 210
Chapter 1
Introduction
This dissertation explores a set of computer vision problems related to X-ray image analysis
of cervical vertebrae and proposes a fully automatic framework to be used as a supporting
tool for image interpretation by clinical experts. In this first chapter, we begin by addressing
the motivation behind the need for an automatic framework for the analysis of cervical
radiographs. The research objectives and questions are then stated, followed by a list of key
original contributions proposed in this dissertation. We end this chapter with a list of articles
published during the course of the research along with an outline of the remaining chapters.
1.1
Motivation
The cervical spine is a vital part of the human body, and due to its flexibility and position, is
particularly vulnerable to trauma. Post-traumatic delayed or incorrect diagnosis can result
in neurological deficit, paralysis or even death. Cervical spine injuries (CSIs) occur in a
significant percentage of all trauma patients due to high energy impacts like automobile
accidents, falls and dives into shallow water. Apart from these major accidents, minor injuries
may also lead to CSI in elderly people and people with pre-existing bone abnormalities.
About 43.9 to 61.5% of all spinal injuries occur in the cervical region, making it the most
common injury-prone region of the whole spine [3]. Among different imaging techniques,
the hospital emergency departments because of its quick results, low cost and availability.
There are typically three views taken of the cervical spine: lateral view, anterior-posterior
(AP) and odontoid process view. This dissertation focuses on the lateral view as it is most the
informative and diagnostic for injury [4]. Despite standardisation and advances in imaging
technologies, evaluation of a cervical spine X-ray image is a major radiological challenge for
an emergency physician, particularly those with less experience. Failure to establish a correct
diagnosis may result in death or serious disabilities. Clinical literature has reported up to 20%
of CSI patients suffer tragic extension of their injuries due to delayed or missed diagnosis [5].
Early and accurate detection of CSI is critical to plan appropriate care and to prevent any
tragic consequences. However, missed or delayed diagnosis of cervical spine injuries is still
a common problem in hospital emergency departments. In one study [5], the most common
cause (accounting for 44%) of missed cervical spine injuries was misinterpretation of the
images. Another study [6] resulted in a similar number (47%) of missed or delayed diagnosis
due to misinterpretation. Junior staff responsible for initial radiological examination failed
to diagnose the injuries until experienced staff later performed a second evaluation of the
radiographs. In [5], complications attributed to delayed or missed diagnosis ranged from
motor and/or sensory neurologic deficits to complete quadriplegia. In other studies, 67% of
patients with missed cervical fractures suffered neurological deterioration and nearly 30%
of delayed CSI diagnosis developed permanent neurological deficit [7]. These numbers are
alarming and the intention is to reduce these figures with the help of the state-of-the-art
advances in computer vision algorithms.
Computer-aided diagnosis (CAD) systems have been used in clinical environment as
a supporting tool for the experts for years. Most notably, CAD has been used for cancer
detection in breast mammography [8, 9], radiography and computer tomography (CT) of
lungs [10–12] and CT colonography [13, 14] with variable success rates. Other use of CAD
systems includes detection of coronary artery diseases [15, 16], pathological brains [17, 18]
1.1 Motivation 3
system in the clinical environment has improved the diagnostic performance [14, 21, 22].
An overview of a conceptual computer-aided injury detection system for the lateral
cervical X-ray image is shown in Fig. 1.1. From an input lateral cervical X-ray image, the
system detects and highlights injuries to aid in clinical interpretation of the image by a
physician.
(a) (b) (c)
Fig. 1.1 (a) An example cervical spine radiograph. This patient has retrolisthesis (displace-ment) of vertebra C3 onto C4 and C4 onto C5 (b) the conceptual injury detection system performs analysis of the image and predicts vertebral shapes (c) vertebral alignments are checked based on the predicted shapes, and possible location of abnormalities are highlighted to draw the radiologist’s attention to the detected injury.
Keeping this overarching goal in the horizon, in this dissertation,we limit our attention
towards solving the computer vision aspects of the fully automatic injury detection
system. The evaluation of the proposed system’s ability to improve human reading of images
is beyond the scope of this dissertation. The performance of the algorithms proposed in this
1.2
Research Question and Objectives
Many of the cervical spine injuries like vertebral displacement (retrolisthesis, and
spondy-lolisthesis), spinal fusion, degenerative changes, osteoporosis, osteophytes and fractures
(wedge, bi-concave and crush) can be detected by analyzing the size, shape, boundary and
corners of the vertebrae. From a medical image computing perspective, the major challenge
is to localize and detect different vertebral features in the image automatically. The main
research question is ‘Is it possible to develop a fully automatic image analysis framework
for cervical vertebrae in X-ray images?’. The quest for a complete and fully automatic
framework can be divided into several objectives:
1. Spine localization: Given an X-ray image, this algorithm will localize the spinal area
in the image. We explore this objective in Chapter 3.
2. Center localization: Given the localized spinal column, this algorithm will be able to
localize the vertebral centers. We explore the solution to this objective in Chapter 4.
3. Corner localization: Given the localized spinal column and centers, this algorithm
will localize vertebral corners. We propose and compare different solutions to this
algorithm in Chapter 5.
4. Vertebral boundary detection: Given localized vertebrae, this algorithm will detect
vertebral boundaries. We discuss this problem in Chapter 6.
5. Vertebra segmentation: Given localized vertebrae, this algorithm will segment vertebral
bodies. This algorithm has also been described in Chapter 6.
6. Vertebral shape prediction: Given localized vertebrae, this algorithm will predict
vertebral shapes. The shape prediction is described in Chapter 7.
Once we can localize the spine, vertebral centers and corners, track vertebral boundaries,
segment vertebral bodies and predict vertebral shapes, all these algorithms can be threaded
together to build a complete and fully automatic image analysis framework which is reported
1.3 Original Contributions 5
This dissertation explores data-driven machine learning-based solutions to the
above-mentioned objectives. The models learn from a training dataset of images which have been
annotated manually by clinical experts. Several random forest and deep learning-based
models have been used, compared, investigated and innovated to build solutions for different
vertebrae related computer vision problems in the objectives.
1.3
Original Contributions
The following are the key contributions of the work presented in this dissertation:
1. Region-aware deep convolutional neural network: A novel loss term has been included
in the training of a deep convolutional neural network to encourage prediction of a
single connected region. This region-aware network is used for the localization of the
spinal region in X-ray images.
2. Shape-aware deep convolutional neural network: A shape-based loss term has been
included in the training of a deep convolutional neural network to assist segmentation
of vertebra-like shapes.
3. Deep spatial probabilistic regressor network: An innovative deep convolutional neural
network is proposed for generating spatially distributed probabilistic maps. The
proposed network has been used for vertebral center and corner localization, and also
for vertebral boundary detection.
4. Deep spatial shape regressor network: A new convolutional neural network has been
designed for prediction of vertebral shapes. The proposed network has been trained
with a loss function defined in the shape space overcoming some of the limitations of
the standard pixel-wise error-based loss function.
5. A fully automatic image analysis framework for cervical vertebrae: A first-of-its-kind
fully automatic image analysis framework has been developed which is capable of
taking an X-ray image as input and highlighting several vertebral features without any
The work of this dissertation began with a vertebra segmentation framework that required
vertebral centers to be clicked by the user at test time. The framework then used an active
shape model to predict vertebral shapes. An example of this earlier framework is shown in
Fig. 1.2.
(a) (b) (c) (d)
Fig. 1.2 Vertebra segmentation with manually clicked vertebral centers and active shape
model (a) input image and manually clicked vertebral center points (+) (b) initialized active
shape models on the vertebrae (−) (c) converged vertebral shapes (−) (d) converged vertebral
shapes (−) with ground truth shapes (−).
The predicted shapes of this framework were sensitive to the variability of the manually
clicked vertebral centers. Also, because of the complexity and sheer diversity in our dataset
collected from real-life medical emergency rooms, the overall performance of this preliminary
framework was poor. To lessen the effect of the manually clicked center points, we began our
research by proposing two novel methods to localize the vertebral corners: a Harris corner
detector-based naive Bayes approach and a Hough forest-based approach. However, the
localized corners by these algorithms were not able to improve the overall performance of the
framework. We then moved forward with our research to build a fully automatic framework
by proposing a spine localization algorithm based on random classification forests. The
algorithm was applied in a two-stage dense to coarse manner and able to localize the spine in
a parallelogram box.
Deep learning has been at the center of the computer vision research since its outstanding
1.3 Original Contributions 7
of the training data was a roadblock for the deep learning methods to be applied to our
problems. With time, our dataset of 90 images increased to a dataset of 296 images and using
data augmentation techniques, we were able to use deep learning models on our problems.
Based on the success of the fully convolutional neural networks in the literature, we proposed
a novel spine localization algorithm using a region-aware deep fully convolutional neural
network which is a key contribution in the present work. This algorithm outperformed our
two-stage random classification forest-based spine localization algorithm.
After localizing spinal region robustly, we focused our attention to localize vertebral
centers. We modified the fully convolutional network to generate a spatially distributed
probability map indicating the location of the vertebral centers. The deep spatial probabilistic
regressor network is a key contribution in this dissertation. We further improved the proposed
deep spatial probabilistic regressor by introducing a novel loss function and a
normaliza-tion layer. The improved spatial probabilistic regressor network was capable of localizing
multiple image landmarks simultaneously. We applied this improved network to the corner
localization problem which outperformed our previous Harris corner detector-based naive
Bayes and Hough forest-based corner localization algorithms by a large margin. A final
improvement to the spatial probabilistic regressor network was proposed by improving the
normalization layer using a histogram-based approach. This network was applied on the
vertebral boundary detection problem.
Another key contribution of this dissertation is a novel shape-aware deep vertebrae
segmentation network. We proposed a novel shape-based loss term into the training of the
segmentation network. The shape-aware network performed significantly better than the
original segmentation network. However, the loss function was still a pixel-wise loss function
where the segmentation results were not constrained into possible vertebra-like structures.
This issue leads us to another key contribution presented in this work, a deep spatial shape
shape domain and predicts shapes directly instead of predicting segmentation masks.
After solving the spine localization, vertebral center and corner localization, vertebral
boundary detection, segmentation and shape prediction problems, we combine these
al-gorithms altogether in a seamless manner to build a complete and fully automatic image
analysis framework for cervical vertebrae. This framework takes as input an X-ray image
and highlights different vertebral features without any human input. An example of the fully
automatic framework is shown in Fig. 1.3. For comparison, the same input image has been
used in Fig. 1.2 where the earlier framework was illustrated.
(a) (b) (c) (d)
(e) (f) (g)
Fig. 1.3 Fully automatic vertebral image analysis framework (a) input image (b) localized
spinal region (blue overlay) (c) localized vertebral centers (+) (d) localized vertebral corners
(×) (d) predicted vertebral boundaries (blue overlay) with ground truth shape (−) (e) predicted
segmentation masks (blue overlay) with ground truth shape (−) (f) predicted vertebral shapes
1.4 List of Publications 9
1.4
List of Publications
The work in this dissertation is supported by articles published, or under review, in
interna-tional workshops, conferences, and journals. Specifically, publications in Sec. 1.4.1-1.4.3 are
directly related to this dissertation.
1.4.1
Journals
1. S M Masudur Rahman Al-Arif, Muhammad Asad, Karen Knapp, Micheal Gundry,
and Greg Slabaugh. "Patch-based corner detection for cervical vertebrae in X-ray
images." Elsevier Signal Processing: Image Communication, Volume 59, Page 27-36,
November 2017.
2. S M Masudur Rahman Al-Arif, Karen Knapp, and Greg Slabaugh. "Fully automatic
cervical vertebrae segmentation framework for X-ray images." Elsevier Computer
Methods and Programs in Biomedicine. (https://doi.org/10.1016/j.cmpb.2018.01.006)
1.4.2
Conferences
1. S M Masudur Rahman Al-Arif, Muhammad Asad, Karen Knapp, Micheal Gundry,
and Greg Slabaugh. Hough forest-based corner detection for cervical spine radiographs.
In Proceedings of the 19th Conference on Medical Image Understanding and Analysis
(MIUA), 2015, Lincoln, UK.
2. S M Masudur Rahman Al-Arif, Muhammad Asad, Karen Knapp, Micheal Gundry,
and Greg Slabaugh. Cervical vertebral corner detection using Haar-like features and
modified Hough forest. In Proceedings of the 5th International Conference on Image
Processing Theory, Tools and Applications (IPTA), 2015, Orléans, France.
3. S M Masudur Rahman Al-Arif, Michael Gundry, Karen Knapp, and Greg Slabaugh.
Global localization and orientation of the cervical spine in X-ray images. In
and Clinical Applications for Spine Imaging (CSI), 2016, Held in Conjunction with
MICCAI 2016, Athens, Greece. (Best Paper Award)
4. S M Masudur Rahman Al-Arif, Michael Gundry, Karen Knapp, and Greg Slabaugh.
Improving an active shape model with random classification forest for segmentation of
cervical vertebrae. In Proceedings of the 4th International Workshop and Challenge
In Computational Methods and Clinical Applications for Spine Imaging (CSI), 2016,
Held in Conjunction with MICCAI 2016, Athens, Greece.
5. S M Masudur Rahman Al-Arif, Karen Knapp, and Greg Slabaugh. Probabilistic
Spatial Regression using a Deep Fully Convolutional Neural Network. In Proceedings
of the British Machine Vision Conference (BMVC), 2017, London, UK.
6. S M Masudur Rahman Al-Arif, Karen Knapp, and Greg Slabaugh. Region-aware
Deep Localization Framework for Cervical Vertebrae in X-Ray Images. In Proceedings
of the workshop on Deep Learning in Medical Image Analysis (DLMIA), 2017, Held
in Conjunction with MICCAI 2017, Quebec City, Canada.
7. S M Masudur Rahman Al-Arif, Karen Knapp, and Greg Slabaugh. Shape-aware
Deep Convolutional Neural Network for Vertebrae Segmentation. In Proceedings of
the workshop on Computational Methods & Clinical Applications in Musculoskeletal
Imaging (MSKI), 2017, Held in Conjunction with MICCAI 2017, Quebec City, Canada.
1.4.3
Clinical Abstracts
1. Developing CSPINE CAD through machine learning algorithms: Inter-operator
pre-cision errors of user inputs, Watts V, Winzar C, Overington A, Rigby J, Gundry M,
Al-Arif SMMR, Phillips M, Slabaugh G, Appelboam A, Reuben A, Knapp K. UKRC
conference proceedings. P63, Liverpool, 29 June - 1 July, 2015.
2. Student radiographer perceptions of using CSPINE CAD software to assist cervical
spine image interpretation and diagnosis, Watts V, Winzar C, Overington A, Rigby
1.5 Dissertation Outline 11
Knapp K. UKRC conference proceedings. P108:P008, Liverpool, 29 June - 1 July,
2015.
3. Can CSPINE-CAD software increase diagnostic accuracy and confidence in c-spine
imaging? Gundry M, Knapp K, Slabaugh G, Appelboam A, Reubens A, Al-Arif
SMMR, Phillips M, UKRC conference proceedings. P186, Liverpool, 6 - 8 June,
2016.
1.4.4
Publications in Collaboration
1. Tim Albrecht, Gregory Slabaugh, Eduardo Alonso andS M Masudur Rahman
Al-Arif. Deep Learning for Single-Molecule Science. Nanotechnology, Volume 28 (42),
Page 423001, September 2017.
2. Atif Riaz, Muhammad Asad, S M Masudur Rahman Al-Arif, Eduardo Alonso,
Danai Dima, Philip Corr and Greg Slabaugh. FCNet: A Convolutional Neural Network
for Calculating Functional Connectivity from functional MRI. In Proceedings of the
International Workshop on Connectomics in NeuroImaging (CNI), 2017, Held in
Conjunction with MICCAI 2017, Quebec City, Canada.
3. Atif Riaz, Muhammad Asad, S M Masudur Rahman Al-Arif, Eduardo Alonso,
Danai Dima, Philip Corr and Greg Slabaugh. Deep fMRI: An end-to-end deep network
for classification of fMRI data. In Proceedings of the IEEE International Symposium
on Biomedical Imaging (ISBI), 2018, Washington, D.C., USA.
1.5
Dissertation Outline
This dissertation is structured as followed: Chapter 2 provides a comprehensive literature
review, an overview of the dataset used throughout the work and a brief discussion on some
of the key concepts and algorithms. Chapter 3 deals with the spine localization problem and
compares two proposed algorithms. The center localization method has been discussed in
boundary detection and segmentation problems have been addressed in Chapter 6. This
is followed by the shape prediction framework in Chapter 7. Finally, in Chapter 8, all the
algorithms are threaded together to build a complete and fully automatic image analysis
framework for the cervical vertebrae. This leads to the conclusion of the dissertation in
Chapter 9 where we discuss the limitations of the current framework, possible ways for
Chapter 2
Background
This chapter is divided into four sections. We start by describing some of the key concepts
related to the spine and the vertebrae. In the second section, we present a literature review by
discussing the state of the research in related fields. The section ends with a table summarizing
the most related articles. The dataset used for training and testing the proposed methods
throughout this dissertation are reported in the next section highlighting the complexity and
diversity of the images. We end this chapter by describing the initial framework from which
the work of this dissertation evolved and with a brief introduction to the random forest and
deep learning methods, both of which are extensively used in this dissertation.
2.1
Spine and Vertebrae
The vertebral column, or the spine, is a collection of bones that support the head and act as
an attachment point for the ribs and muscles of the back and neck. An adult human vertebral
column consists of 26 bones: the 24 vertebrae, the sacrum, and the coccyx bones [1]. The
vertebrae are further divided into the seven cervical vertebrae, 12 thoracic vertebrae, and five
lumbar vertebrae based on their position in the column (see Fig. 2.1 reproduced from [1]).
In this dissertation, we focus on the cervical vertebrae. As mention earlier, for X-rays,
Fig. 2.1 Visualization of the vertebral column reproduced from [1].
odontoid process view [4]. Examples of these views are shown in Fig. 2.2. For general
evaluation of the cervical spine, the lateral view is the most diagnostic. The other views
are usually taken to focus on specific areas of the spine. For example, vertebra C1 and C2
overlap in the lateral view. Thus the odontoid peg view is appropriate to visualize these
vertebrae. Similarly, the AP view is needed if specific focus on the anterior (right-side of
Fig. 2.2a) and/or posterior (left-side of Fig. 2.2a) side is required. The work presented in this
(a) (b) (c)
2.1 Spine and Vertebrae 15
dissertation deals with the most diagnostic lateral view of the cervical spine and vertebra
C3-C7 (C1 and C2 are not considered because of their overlap, similar to other studies related
to the cervical spine [24, 25]).
Fig. 2.3 Cervical spine at flexion and extension.
The cervical spine is a highly flexible anatomy, capable of flexion, extension, lateral
flexion, and rotation [26]. Fig. 2.3 shows examples of lateral X-ray taken with the cervical
spine in flexion and extension. Flexion is a movement by which subject’s chin attempts to
touch the chest whereas extension is a movement in the opposite direction. Lateral flexion is
a similar movement but sideways, where the subject’s ear tries to reach the shoulder. The
lateral view can also be taken with subject’s face rotated sideways.
Due to this wide range of motion, the cervical spine is particularly vulnerable to injury.
Automobile related injuries are the most common in the cervical spine. These injuries occur
as the head and neck hit the dashboard, due to either being hit by another car or as the
vehicle comes to a sudden stop. This causes either hyperflexion or hyperextension to the
cervical spine. These mostly result in partial dislocation (subluxation) of the vertebral body.
resulting in compression injuries [27]. Apart from these, the cervical spine can also sustain
injuries due to sudden distraction, rotational movement and age-related reasons. The next
subsection describe some of the most common injuries related to the cervical spine.
2.1.1
Cervical Spine Injuries
2.1.1.1 Subluxation
Luxation is defined as the abnormal separation in the joint where two or more bones meet. A
partial dislocation is referred to as a subluxation. In the cervical spine, subluxation of the
vertebral body can occur on the anterior side or on the posterior side. The anterior
displace-ment of one vertebral body on the adjacent vertebral body is termed as spondylolisthesis
whereas the displacement in the posterior side is termed as retrolisthesis. Example of these
subluxations are shown in Fig. 2.4.
(a) (b)
Fig. 2.4 Sublaxation injuries (a) spondylolisthesis (b) retrolisthesis.
2.1.1.2 Compression Fracture
The collapse of a vertebral body is identified as a compression fracture. A compression
2.1 Spine and Vertebrae 17
as a wedge fracture whereas a posterior collapse is called a crush fracture. A collapse of the
vertebral body in the center is termed as a biconcave fracture. The severity of these fractures
is often computed based on the anterior, medial and posterior heights of the vertebral body.
A quantitative method, called Genant method, is widely used in clinical literature for the
determination of the type and the severity of the compression fracture [28]. Different type of
fractures are shown in Fig. 2.5.
(a)
(b)
Wedge Biconcave CrushType of compression fracture Severity
Grade 1
Grade 1
Grade 2
Grade 3
Fig. 2.5 Vertebral fracture (a) normal vertebra (b) different types and grades of compression fractures.
2.1.1.3 Osteoporosis and Osteophytes
Vertebral osteoporosis is a condition characterized by gradual weakening vertebral bones,
making them fragile. It develops over several years and usually not painful until a fracture
occurs. Osteoporosis is often only diagnosed when a minor impact causes a fracture in
the weakening bones. Fig. 2.6a shows an example of a cervical spine with osteoporosis.
Osteophytes are another common anomaly in the cervical spine. Osteophytes are usually
identified as bony projections that form along the vertebral boundaries. Both osteophytes
and osteoporosis are sometimes categorized as degenerative changes of the spine and often
(a) (b)
Fig. 2.6 Degenerative changes (a) osteoporosis (b) osteophytes.
In this subsection, we have presented a selection of clinical conditions most common to
the cervical spine. The list is not exhaustive and there exist more complex and uncommon
conditions. It should also be noted that the cervical spine injuries often come in a subtle form.
Due to the difficulty in assessing the subtle injuries in X-ray images, a correct diagnosis can
be delayed. Clinical literature suggests 61% of all cervical vertebra fractures and 36% of the
subluxations remain unnoticed in X-rays [29].
2.2
Literature Review
The vertebral column is an important part of the human body. It can be imaged with different
types of modalities. Two major types of image modalities used are radiographic imaging
and magnetic resonance (MR) imaging. Radiographic imaging includes X-ray, computer
tomography (CT) and dual energy X-ray absorptiometry (DXA). While MR and CT produce
3D volumetric scans, X-ray and DXA produce 2D images. Amongst the reviewed
litera-ture [24, 25, 30–42] work on X-ray images, [38, 43–49] use DXA scans, while CT and MR
2.2 Literature Review 19
different areas of the spine being studied i.e., cervical, thoracic and lumbar vertebra.
There are seven cervical vertebrae (C1-C7), 12 thoracic vertebrae (T1-T12) and five
lumbar vertebrae (L1-L5). The column ends with the sacrum and the coccyx bone. Some
of the literature works on the whole vertebrae column [37, 39, 50, 51], while most papers
focus only on particular regions: cervical [24, 25, 30, 31, 33–36, 40, 41, 58],
thoracolum-bar [38, 42–44, 46, 48, 49, 52, 54, 56], lumthoracolum-bar [31, 32, 45, 47, 53, 59]. Our work is focused
on five cervical vertebrae, C3-C7, in X-ray images. Like most of the reviewed articles
concerning cervical vertebrae, C1 (atlas) and C2 (axis) are not considered in the current study
because of their overlap in lateral X-ray images. These vertebrae are better visualized in 3D
techniques like CT.
Different types of problems have been addressed in the reviewed literature. These
ob-jectives can be classified broadly into four classes: localization of the vertebral centers, end
plates or spinal column [30, 38, 41, 42, 49, 51, 53, 54, 58], identification of the vertebral
bone [39, 50, 51], segmentation [24, 25, 31, 32, 38, 40, 43–48, 50, 52, 55, 56] and fracture
detection or morphometry [33, 36, 37, 43, 44, 48, 59]. The literature can also be categorized
based on the type of methodology used. A few articles use non-data driven methods [34]
while all other reviewed literature uses data-driven methods (statistical shape models (SSM),
random forest (RF), AdaBoost, mean template etc.) which consists of an offline training
phase and an online testing or prediction phase.
There is no gold standard dataset available publicly. Most of the research has been
done on privately collected datasets. For X-ray images, a public dataset of cervical and
lumbar vertebrae with manual segmentation, NHANES-II [60], has been used throughout the
literature [24, 25, 30, 31, 33–36, 40]. This dataset consists of scanned analogue X-ray scans
which often includes unnecessary artefacts and also missing information about the resolution
of the data. These images were collected during second national health and nutrition
from 1976 to 1980 in the USA. As the dataset was not collected from hospital emergency
departments, the images were not diverse in terms of injuries and other clinical conditions.
Another publicly available CT dataset has been set up recently at SpineWeb [61, 62], which
has been used in recent literature [52, 54, 56]. Our data is described in Sec. 2.3. The reviewed
literature is summarized in Table 2.1.
Based on the reviewed literature, it can be understood that data-driven methods are more
common than non-data driven methods. Among different methodologies, statistical shape
model (SSM)-based methods (active shape model (ASM), active appearance model (AAM),
deformable model (DM) and constrained local model (CLM)) have performed consistently
well over different spinal regions and image modalities. As stated earlier, our goal in this
dissertation is to solve different computer vision problems like localization of spinal region,
localization of vertebral centers, corners and vertebral boundary detection, segmentation and
shape prediction for cervical vertebrae in X-ray images. Concentrating on these objectives
and selecting the work on 2D radiographic images, most of the related literature comes mainly
from two groups: Benjelloun et al. [24, 25, 34, 35, 41, 42] and Cootes et al. [38, 44–49]. The
first group works with the NHANES-II dataset of cervical X-ray images while the second
group works on their own dataset of DXA images of the whole spine.
Earlier work of Benjelloun et al. [34, 35] address vertebral boundary detection and
region selection using a polar signature and template matching, respectively. They
imple-mented a semi-automatic segmentation framework based on ASM in [25, 49]. Our initial
framework, described in the Sec 2.4, is a simplified version of this work. Their latest work
on X-ray images [42] uses generalized Hough transform (GHT) to identify cervical vertebrae.
From the latter group, automatic segmentation and morphometry computation of vertebra
on DXA images have been addressed by Robert et al. in [44–46] using an AAM. An improved
segmentation is obtained with a part-based graph with AAM in [47]. Their method also
2.2 Literature Review 21
Reference No Modality Vertebra
Region Objective Key Methodology Dataset
Smyth 1999 [43] DXA Thoraco-Lumbar Segmentation
Morphometry ASM Own
Tezmol 2002 [30] X-Ray Cervical Localization Hough Transform (HT)
Template Matching NHANES-II
Zamora 2003 [31] X-ray Cervical Lumbar Segmentation GHT, ASM, DM NHANES-II
Bruijne 2004 [32] X-ray Lumbar Segmentation
k-NN classification PDM Particle filtering
Own
Chamarathy 2004 [33] X-Ray Cervical Morphometry K-means
SOMs NHANES-II
Roberts 2005 [44] DXA Thoraco-Lumbar Segmentation
Morphometry AAM Own-Cootes
Roberts 2006 [45] DXA Lumbar Segmentation AAM Own-Cootes
Roberts 2006 [46] DXA Thoraco-Lumbar Segmentation AAM Own-Cootes
Benjelloun 2006 [34] X-ray Cervical Edge detection Polar signature (NDD) NHANES-II
Benjelloun 2006 [35] X-ray Cervical Region selection Template matching NHANES-II
Aouache 2007 [36] X-Ray Cervical Morphometry ASM NHANES-II
Casciaro 2007 [37] X-Ray Whole Morphometry Local Phase symmetry Own
Bruijne 2007 [59] X-Ray Lumbar Morphometry Conditional ASM Own
Roberts 2009 [47] DXA Lumbar Segmentation AAM, Part-based Graph Own-Cootes
Klinder 2009 [50] CT Whole Identification
Segmentation Generalized HT (GHT) Own
Roberts 2010 [48] DXA Thoraco-Lumbar Segmentation
Morphometry AAM Own-Cootes
Mahmoudi 2010 [25] X-Ray Cervical Segmentation ASM NHANES-II
Dong 2010 [39] X-Ray Whole Identification Probabilistic Graphical Model Own
Benjelloun 2011 [24] X-Ray Cervical Segmentation ASM NHANES-II
Xu 2012 [40] X-Ray Cervical Segmentation AAM NHANES-II
Glocker 2012 [51] CT Whole Localization
Identification
Random regression forest
Hidden Markov Model Own
Larhmam 2012 [41] X-Ray Cervical Localization GHT Own
Roberts 2012 [49] DXA Thoraco-Lumber Localization Regression forest, AAM Own-Cootes
Larhmam 2014 [42] X-Ray Cervical Localization GHT, K-means Own
Larhmam 2014 [58] MR Thoraco-Lumber Localization Ellipse fitting, curve detection own
MICCAI 2014 [52] CT Thoraco-Lumber Segmentaion M1: Atlas-based
M2,3,4,5:Statistical Shape Model SpineWeb
Bromiley 2015 [38] DXA Thoraco-Lumber Localization
Segmentation CLM with RFRV Own-Cootes
Ibragimov 2015 [53] CT Lumber Localization
Rough Segmentation
Interpolation-based detection
mean shape model Own
Korez 2015 [54] CT Thoraco-Lumber Localization
Rough Segmentation
Interpolation-based detection
Mean shape model SpineWeb, Own
Korez 2015 [55] CT Lumber Segmentation Shape Constrained DM Own
Korez 2015 [56] CT Thoraco-Lumber Segmentation Shape Constrained DM SpineWeb
Embrahimi 2016 [63] X-ray Lumber Localization Corner detection using
Haar-based features Own
Bromiley 2016 [57] CT Thoraco-Lumber Localization
Segmentation CLM with RFRV Own-Cootes
Mehmood 2017 [64] X-ray Cervical Localization GHT, Fuzzy c-means NHANES-II
Yang 2017 [65] CT Whole Identification Convolutional Neural Network SpineWeb, Own
Table 2.1 Literature review.
Forest Regression Voting (RFRV) in [49]. Along with geometric constraints, AAM-RFRV
performed better than the original AAM. Bromiley et al. [38, 57] is the latest work by their