City, University of London Institutional Repository
Citation:
Miao, X., Zhang, Q. ORCID: 0003-0982-2986, Atkin, C.J. ORCID: 0000-0003-2529-1978, Sun, Z. and Li, Y. (2018). Improving Purge Air Cooling Effectiveness by Engineered End-Wall Surface Structures-Part I: Duct Flow. Journal Of Turbomachinery, 140(9), 091001. doi: 10.1115/1.4040853This is the accepted version of the paper.
This version of the publication may differ from the final published
version.
Permanent repository link:
http://openaccess.city.ac.uk/id/eprint/20898/Link to published version:
http://dx.doi.org/10.1115/1.4040853Copyright and reuse: City Research Online aims to make research
outputs of City, University of London available to a wider audience.
Copyright and Moral Rights remain with the author(s) and/or copyright
holders. URLs from City Research Online may be freely distributed and
linked to.
City Research Online: http://openaccess.city.ac.uk/ [email protected]
1
Improving Purge Air Cooling Effectiveness
by Engineered End-Wall Surface Structures
–
Part I: Duct Flow
Xin Miao e-mail: [email protected] Qiang Zhang e-mail: [email protected] Chris Atkin e-mail: [email protected] Zhengzhong Sun e-mail: [email protected]
Department of Mechanical Engineering & Aeronautics City University London
Northampton Square, London, EC1V 0HB, United Kingdom
Y S Li
e-mail: [email protected]
Siemens Industrial Turbomachinery Limited Lincoln LN5 7FD, UK
ABSTRACT
Motivated by the recent advances in Additive Manufacturing (AM), this study investigated a new turbine
end-wall aerothermal management method by engineered surface structures. The feasibility of enhancing
purge air cooling effectiveness through a series of small-scale ribs added onto the turbine end-wall was
explored experimentally and numerically in this two-part paper. Part I presents the fundamental working
mechanism and cooling performance in a 90-degree turning duct (Part I), and Part II of this paper validates
2
In Part I, the turning duct is employed as a simplified model for the turbine passage without introducing the
horseshoe vortex. End-wall heat transfer and temperature were measured by the infrared thermography.
CFD simulation was also performed using ANSYS FLUENT to compliment the experimental findings. With the
added end-wall rib structures, purge air flow was observed to be more attached to the end-wall and cover
a larger wall surface area. Both experimental and numerical results reveal a consistent trend on improved
film cooling effectiveness. The practical design optimization strategy is also discussed in this paper.
INTRODUCTION
Efficient cooling techniques have been essential for modern gas turbines to safely operate at the extremely high temperature environment [1]. In the turbine stage, the high pressure hot gas may enter the cavity between the stator and rotor, which causes over-heating, thermal fatigue, and dilatation of the discs. A stream of cold air from the compressor is introduced to eject through the rim seal to prevent hot gas ingestion. Recently, purge air cooling also becomes one of the widely used methods to effectively protect the turbine end-wall.
3
Girgis et al. [7] tested a transonic turbine with various secondary air injection conditions. They found that cavity flows with a large tangential component allow an improvement of
10.3% efficiency compared to the case of flow injected radially. Reid et al. [8] reported that the turbine efficiency decreases with increasing purge flow rate, but this penalty is reduced by swirling the purge flow.
A substantial amount of effortshave been made to investigate turbine blade end-wall cooling with the purge air. The study of Roy et al. [9] showed that the heat transfer near the leading edge region is reduced due to the upstream purge air injection and a higher purge air mass ratio is also beneficial in weakening the passage vortex. Similar results were also observed by Burd et al. [10] and Oke et al. [11]. Dénos and Paniagua [12] studied the purge air effect in a high-pressure transonic turbine stage. They found the purge air effectively reduces the heat flux around the rotor leading edge. Wright et al. [13-14] measured film cooling effectiveness of different purge slot geometries by pressure sensitive paint technique. Their results show that the large purge air ratio could not only offer cooling protection to the rear of the blade passage, but also result in a large aerodynamic penalty. In addition, combining both upstream purge air and downstream film holes can efficiently increase film cooling effectiveness. Popovic and Hodson [15] investigated a highly-loaded rotor blade with purge air injection, and observed that the purge air mainly concentrates around the blade suction surface, resulting in a higher heat transfer coefficient, however, the overall heat load is not reduced.
4
aerothermal management. Engineered surface features now could be efficiently fabricated and applied, providing a good physical understanding on the flow-structure
interaction. Previous study of Miao et al. [16-17] reported that adding small-scale ribs with streamline shapes on the turbine end-wall could be very effective in reducing the passage secondary flow. The concept was verified both in a 90-degree turning duct and a linear cascade condition. The near wall low momentum fluids can be aligned by the engineered surface “guides” and the over-turning can be alleviated effectively.
5
EXPERIMENTAL APPARATUS AND PROCEDURES
Low-Speed Wind Tunnel and Test Section
A low-speed wind tunnel facility was used in the present study. The flow is driven
by a 25 kW air blower. A settling chamber with mesh screens is located upstream of the
contraction section. This wind tunnel was also equipped with a heating mesh powered by
a 100 kW DC power supply to generate a step increase in temperature in the flow. The
heating mesh was made of stainless steel with a sieve mesh number of 200. The outlet of
the contraction is 100 mm in height (H) and 50 mm in width (D), and delivers a velocity of
20 m/s. Note that the duct height H was chosen to be 2D to avoid the interaction between
the induced passage vortex and the top wall. The Reynolds number based on the duct width D is 69,000.
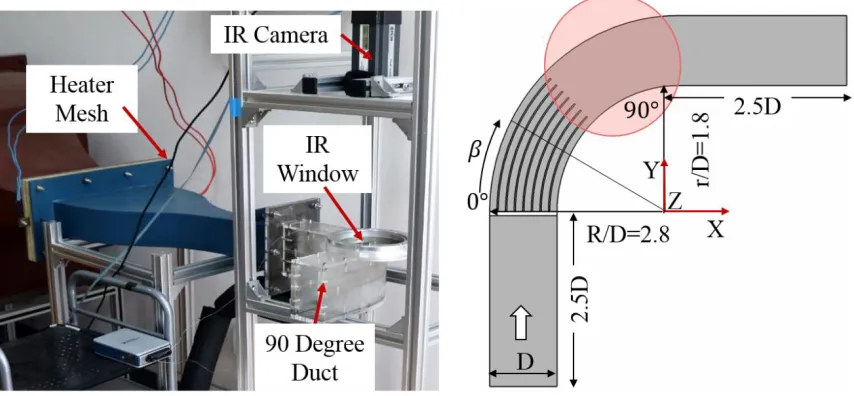
A schematic of the test section is shown in Fig.1. The non-dimensional radius ratio
of the duct was kept the same as that in Camci et al. [18]. The inner and outer radius ratios
(𝑟𝑖/𝐷 and 𝑟𝑜/𝐷) are 1.8 and 2.8, respectively. The turning duct was equipped with straight
inlet and outlet sections, whose lengths are 2.5D. The bottom end-wall on the duct
channel was designed with inter-changeable blocks. Two types of end-wall blocks were
employed: one smooth wall and one with seven small-scale ribs. The end-wall block with
ribs were manufactured through 3D printing and the ribs cover the angular range from 0°
to 45°, namely the first half of the turning duct. The rib array geometry is summarized in
6 Transient Infrared thermal measurement was conducted on the end-wall surface.
A zinc selenide window was fitted into the duct top wall and an infrared camera was
installed perpendicularly with respect to the IR window. The distance from IR camera to
the window was adjusted to ensure the field of view covers an angular region between
45 ° to 90 °, namely the latter half of the turning duct, as shown in Fig.1.
Two fast-response thermocouples were placed in the inlet section and purge
cavity respectively to monitor their temperatures. The thermocouple has a wire diameter
of 76 µm and response time of less than 80 ms. The temperature was recorded by a
National Instrument data acquisition system.
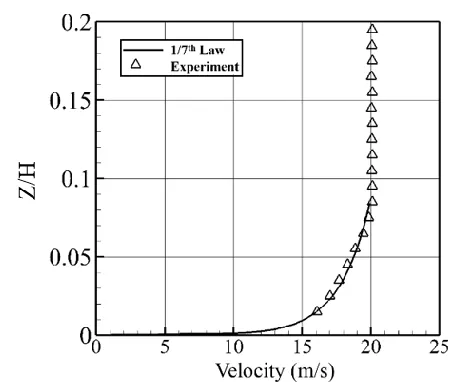
Figure 2 presents the inlet boundary layer profile measured by using a boundary
layer probe with a flat tip. A typical turbulent boundary layer characteristic can be
observed. The Inlet boundary layer thickness and shape factor are 6mm and 1.3
respectively. The turbulence level of the flow is about 1%. The stagnation and static
pressures of the test section inlet were measured by a pitot tube.
A vortex tube was used to generate the cold air sent through the purge cavity. The
vortex tube was connected to a compressed air supply. The cold end of the tube connects
to a stabilizing cavity with a steady temperature of 278 K throughout the transient tests.
An inclined slot on top of the cavity injects the cold air into the turning duct, thus forming
the purge air flow. The slot outlet has an inclination angle of 30-degree with respect to
the wall. The slot spans along the entire duct width and has a width of 0.06 D. The
volumetric flow rate of the purge air was measured by using a digital flow meter. The ratio
7 dimensions and flow conditions was based on an early experiment work by Wright et al.
[14].
In-Situ Calibration of Infrared Camera
In-situ calibration of the IR camera similar to previous research by Schulz [19],
O’Dowd et al [20], and Zhang et al. [21] was conducted in the present study. A fast-response thermocouple was imbedded in the middle of the end-wall to record
temperature variation. Its location is a good representative of the nearby region which
should share similar emissivity, view factor, IR window transmissivity, etc. Figure 3
presents a linear calibration relationship between the 16-bit grayscale values from the
infrared camera and the temperature readings obtained by the thermocouple during a
transient run. The temperature to grayscale resolution of the IR camera is 0.002 ℃ per
grayscale value. The systematic error should mainly come from the thermocouple (1K)
reading.
Transient Thermal Measurement and Data Processing
Figure 4a presents the time histories of the cold purge air, end-wall and inlet
temperatures during a typical transient experiment. After a step heating by the heater
mesh, the mainstream temperature (red color) and the temperate of cold purge air (blue
color) were maintained at a relatively constant value for a short period of time.
For an established flow field near the end-wall surface, the heat transfer
8 𝑞′′ = ℎ(𝑇
𝑎𝑑− 𝑇𝑤) (1)
where 𝑞′′ is the heat flux, 𝑇𝑎𝑑 is adiabatic wall temperature, 𝑇𝑤 is end-wall
temperature.
For the solid side, it is reasonable to assume one dimensional semi-infinite
conduction due to the low conductivity material employed for the end-wall surface. The
local heat flux can be calculated based on the transient wall temperature history. In this
study, a well-established Impulse Response Method, developed by Oldfield [24] and
further implemented by a series of research by O’Dowd et al. [20], Zhang et al. [21-23],
and Ma et al [24], was employed. This method uses discrete deconvolution and a pair of
nonsingular analytical solutions to the convective heat transfer equation to derive a
digital filter impulse response, then the heat flux can be determined from temperature
traces based on the convolution integral. The measured thermal product √𝜌𝐶𝜅 of the
end-wall material is 564 √𝑠/m2K (previously reported by Ma et al [25]).
Figure 4b shows the time history of local heat flux (calculated) and wall temperature
(measured) for a sample location on the end-wall during one transient measurement.
Both heat flux and temperature values were non-dimensionalized. All the data points in
Fig. 4b follow a linear trend, which indicates and proves the validity of the convection
equation (1) and satisfactory accuracy of the transient experiments. Both heat transfer
coefficient and adiabatic wall temperature can be obtained from linear regression: the
slope of the regression line is the Nusselt number and the x-axis interception is the
adiabatic wall temperature.
9 Uncertainty Analysis
A jitter analysis described by Moffat [26] was used to determine the overall
uncertainty in the experimental study. The sources of experimental uncertainty include
measured wall temperature, material properties, the calibration of the IR camera,
mainstream and coolant temperature variations and measurement, etc. For transient
thermal measurement and the Impulse method employed in the present work, the linear
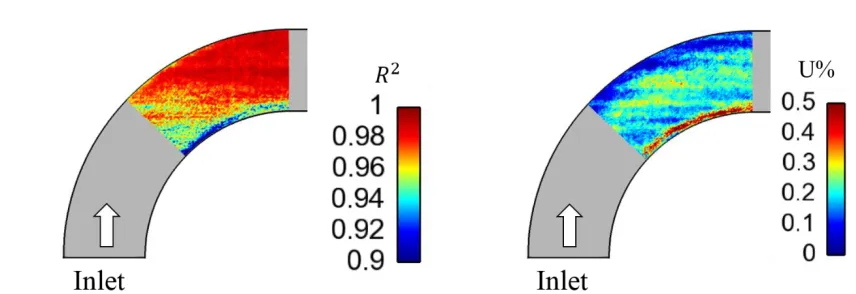
regression error also needs to be considered. A coefficient of determination 𝑅2 , defined
by Devore [26], is calculated to assess the linear regression performance. Figure 5
presents a detailed distribution of R2 in the measurement area for the smooth end-wall
case. For the majority of the measurement region, R2 is well above 0.9.
The 95% confidence level was used to estimate the uncertainty in the transient
thermal measurement. Four repeated transient tests were taken for each type of
end-wall surface. Figure 5b shows the contour of relative uncertainty in adiabatic end-wall
temperature. The relative uncertainty in Tad is below 0.5% for most of the test surface.
In the present experimental study, the element systematic error sources mainly come
from the wall temperature measurement and the determination of end-wall material
property (also reported previously by O’Dowd et at. [20]).
Table 2 presents a summary of uncertainty values for various measurement
10 CFD METHOD and Validation
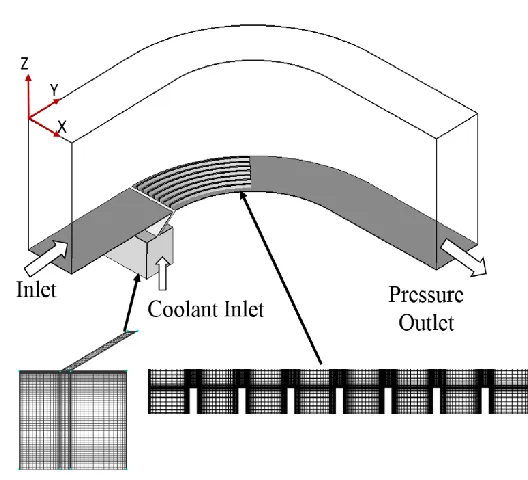
The flow in the present turning duct was simulated by using the commercial CFD
software ANSYS FLUENT. The computational domain is shown in Fig. 6. The geometry and
the duct inlet flow condition were set the same as the experiments. The measured inlet
velocity profile shown in Fig. 2 was implemented by a User Defined Function (UDF) code
programmed in C language. An ambient pressure was set as the duct outlet boundary
condition. Isothermal boundary conditions were set on the end-walls. The heat transfer
coefficient and adiabatic wall temperature were calculated from two cases with different
end-wall temperature values (290 K and 300 K).
Structured grids, generated through the commercial software Pointwise, were
employed for the entire flow domain. Figure 5 presents an enlarged view of the
hexahedra mesh around the purge air slot and wall ribs. The first grid point immediately
above the wall has y+ value of less than 1.
The flow solver uses the finite volume method to solve the Steady
three-dimensional Reynolds-Averaged Navier-Stokes (RANS) equations. The k-ω shear stress
transport (SST) turbulence model was chosen for all the numerical studies. The simulation
was carried out in the double-precision mode to improve the level of convergence.
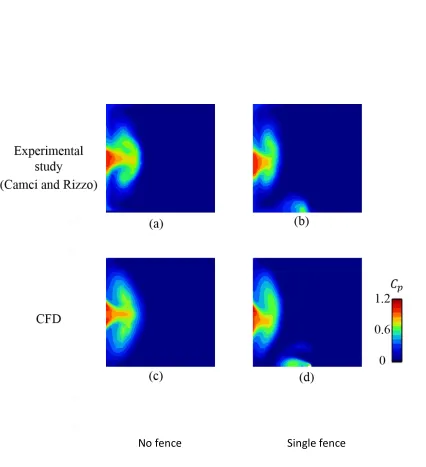
The simulation strategy is validated through the comparison with the
experimental data from Camci and Rizzo [18]. In their study, a similar 90-degree turning
duct with a single fence on the end-wall was used. Note that this case study is only for
validation purpose, and the aspect ratio of the duct is different from all the other cases
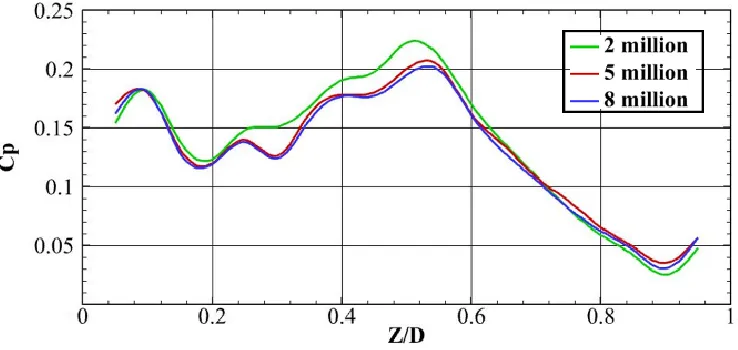
11 Grid independence was first checked in this single fence case through three grids
with different density, namely 2 million, 5 million and 8 million nodes. Figure 7 compares
the spanwise-averaged total loss coefficient 𝐶𝑝 at the exit of turning passage (90-degree
plane). The grid of 5 million nodes is chosen for all other simulation cases since the
maximum difference between results from the grids of 5 million and 8 million nodes is
less than 5%.
Figure 8 presents the coefficient of total pressure loss at the exit plane. An overall
agreement can be observed. In the plane without rib fence, the region with larger total
pressure loss is associated with the passage vortex pair, and it features a symmetric
mushroom-type due to the interaction of fluids between top and bottom walls. Because
of the presence of rib fence and the resulted smaller vortex, the total pressure loss is
alleviated in the lower half of the “mushroom”. As such, the present CFD methodology is
able to qualitatively demonstrate the detailed secondary flow structure in a curved
channel flow, with acceptable quantitative accuracy. Further comparison with thermal
measurement will be discussed in later sections.
RESULTS AND DISCUSSIONS
In this section, the purge air flow structure and its interaction with the passage
secondary flow are firstly shown based on CFD analysis. The cooling enhancement
mechanism with the ribbed surface is then discussed, after which experimental data of
cooling effectiveness, heat transfer coefficient and Net Heat Flux Reduction (NHFR) are
12 Purge Air Flow Structure
The working mechanism of purge air cooling is quite similar to conventional film
cooling technique. A thin layer of low temperature air is expected to effectively cover the
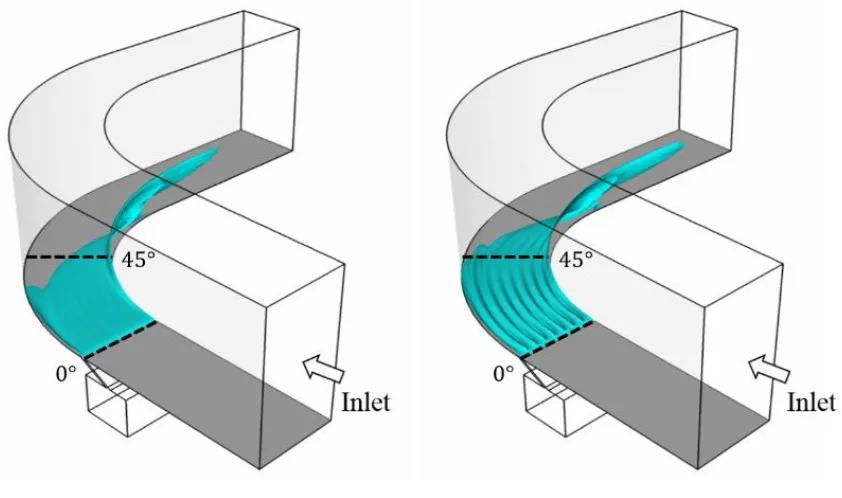
end-wall surface. To visualize the cold purge air coverage area, Figure 9 shows an
iso-temperature surface 𝜃, defined as,
𝜃 = 𝑇−𝑇𝑐
𝑇∞−𝑇𝑐= 0.6 (2)
where 𝑇𝑐 is the cold purge air temperature, 𝑇∞ is mainstream temperature and 𝑇 is the
local temperature. The parameter 𝜃 also represents the purge air concentration (a lower
𝜃 value indicates a colder local fluid temperature).
For the smooth end-wall case, driven by radial pressure gradient, the
iso-temperature surface associated with cold purge air quickly sweeps towards the duct inner
side. Figure 9b shows that the ribbed surface effectively extends the iso-temperature
further downstream from about 45° to about 60°, after which the three-dimensional
vortical motion occurs.
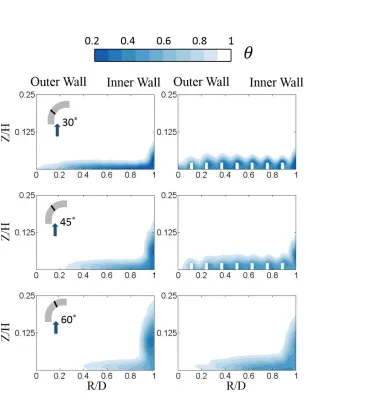
Figure 10 shows the non-dimensional fluid temperature 𝜃 distribution at three
angular cross sections along the duct passage. The cross sections are located at 30°, 45°
and 60° of the turning duct. In the duct with smooth end-wall surface, the low
temperature air gradually moves from the outer wall to inner wall as the fluid travels
along the passage. At the 60° plane, most of the cold air lifts off away from the end-wall
and the passage vortex contains a majority of the purge air. In contrast, for the ribbed
surface, most purge air can stay near the end-wall and fully occupies the rib channels at
13 Compared with the smooth case, the near end-wall fluid temperature with ribs is much
lower.
The secondary flow in the turning duct is associated with the streamwise
component of vorticity. Three typical radial cross-sectional planes at 30°, 45° and 60°
were extracted to reveal the evolution of the secondary flow, as shown in Fig. 11. The
streamwise vorticity is defined as the tangential component in a cylindrical coordinate
system, and it can be calculated by,
𝛺𝑠 = 𝛺𝑥𝑠𝑖𝑛𝛽 + 𝛺𝑦𝑐𝑜𝑠𝛽 (3)
Where 𝛽 is labeled in Fig. 1. In Fig. 11, the streamwise vorticity is further
nondimensionalized by 𝐷/𝑉∞. The negative vorticity (red in color), is associated with the
secondary flow vortex, while the positive vorticity (blue in color) represents the vortex
with an opposite direction of rotation to the secondary flow vortex. Figure 11a shows
that, in the duct with smooth end-wall, concentration of negative vorticity gradually
builds up at the lower inner-corner within the selected angular range, suggesting the
growth of the secondary flow vortex. In Fig. 11b, the ribs on the end-wall surface modify
the vorticity distribution throughout the angular range. Apparently, the intensity of
negative vorticity associated with the secondary flow vortex is reduced. In the smooth
surface duct, the secondary flow accumulates in the inner-end-wall corner and gradually
extends along the inner vertical wall; however, the presence of the ribs effectively
eliminates this accumulation of secondary flow. The ribs also introduce vortices with an
14 flow vortex. Since the ribs only extend from 0° to 45° in the present design, the array of
positive vorticity associated with these ribs disappears in the cross section at 60°.
Next, the overall aerodynamic performance is evaluated for cases with and
without end-wall ribs. In order to account for all the contributions due to viscous effects
and heat transfer between the mainstream and purge flow, the aerodynamics loss
coefficient is defined as
𝜁 = 1 −
(𝑚̇ ∙𝐶𝑐 𝑝,𝑐∙𝑇0,𝑐+𝑚𝑖𝑛̇ ∙𝐶𝑝,𝑖𝑛∙𝑇0,𝑖𝑛)(1−(𝑃 𝑃0)
(𝛾−1𝛾 ) )
𝑚𝑖𝑛̇ ∙𝐶𝑝,𝑖𝑛∙𝑇0,𝑖𝑛∙(1−(𝑃𝑚𝑖𝑑 𝑃0,𝑖𝑛)
(𝛾−1𝛾 ) 𝑖𝑛)+𝑚
𝑐
̇ ∙𝐶𝑝,𝑐∙𝑇0,𝑐∙(1−(𝑃𝑚𝑖𝑑 𝑃0,𝑐)
(𝛾−1𝛾 ) 𝑐)
(4)
Figure 12 shows the distribution of aerodynamics loss coefficient at the 90-degree
plane in the smooth and ribbed cases. It can be observed that the loss core of the passage
vortex is close the end-wall with the addition of ribs. In the corner region between inner
wall and end-wall the loss is increased slightly. The mass-averaged loss coefficient
between smooth and ribbed cases is less than 2%. The additional aerodynamic penalty
introduced by the small ribs is negligible.
Cooling Effectiveness and Net Heat Flux Reduction (NHFR)
Film cooling effectiveness measured for both types of end-walls is presented and
further compared with CFD analysis in this section. The calculation of film cooling
effectiveness ƞ follows the relation below
𝜂 =𝑇∞− 𝑇𝑎𝑑
15 where 𝑇𝑐 is the cold purge air temperature, 𝑇∞ is the mainstream temperature and 𝑇𝑎𝑑 is
the adiabatic wall temperature.
Figure 13 presents the contours of 𝜂 obtained in the experiments for both
end-walls. The region of higher ƞ, namely ƞ>0.5, can be clearly observed in Fig. 13a. At the
angular position of 45°, the high film cooling efficiency only covers about half of the duct
width, while the highest 𝜂 is close to the inner side wall. The region of high 𝜂 quickly
shrinks in size further downstream and it fully disappears after 70°. The rapid decay of
cooling effectiveness is caused by the sweeping effect of the secondary flow vortex, which
carries the cold purge air flow away from the end-wall towards the inner curved wall
through its vortical motion. In contrast, the ribbed surface has improved the cooling
performance significantly, as shown in Fig. 13b. The region of ƞ>0.5 covers the entire duct
width at angular position of 45°, whilst the high 𝜂 region extends further downstream till
80° near the inner wall. The total area with good cooling air coverage over the ribbed
surface is about twice of that over the smooth surface. Some very high 𝜂 regions with
ƞ>0.7 can still be observed, and they are aligned with the grooves formed between
adjacent ribs. This discrete distribution of high cooling effectiveness region is due to the
near wall small scale vortex array generated by the ribs (previously shown in Fig. 11). It
seems that these small vortices are very efficient in maintaining the purge air flow close
to the end-wall surface. On the other hand, Fig. 13b also shows a few discrete blue stripes
aligned with the rib locations, which indicate a poor coolant coverage over the top
16 Figure 14 shows film cooling effectiveness calculated by numerical simulation. The
qualitative trend is consistent. The simulation has a reasonably good agreement with the
experimental data in terms of the overall cooling effectiveness distribution and the
enhancement by the ribs is also quite similar in terms of the increased coverage area.
Very high cooling performance inside the rib grooves can be observed by the simulation.
both experiment and CFD results confirm that the ribbed surface enables cooling
enhancement by maintaining the cold purge air attached to the end-wall to a much larger
extent. Quantitively, the CFD data are less diffused than the measurement results. Nearly
no cooling flow can be observed from some of the grooves near the outer wall, while
there is more cooling coverage near the inner wall region. Such discrepancy is a common
performance from a standard RANS solver. The interaction between secondary flow and
cooling fluid needs to be better resolved by CFD solvers with high-fidelity.
Figure 15 further illustrate the laterally-averaged film cooling effectiveness along
the duct passage by comparing results from the smooth (black color) and ribbed surfaces
(red color). The CFD result is shown as dash lines, while the experimental data is
presented as solid lines. After the 20° location, a rapid decline of the 𝜂̅ value can be
observed because the passage vortex sweeps the purge air from outer wall to inner wall.
For ribbed surface, the 𝜂̅ starts from about 0.85 since the purge air is not able to fully
cover the tip surface of the rib structure (this can also be observed in Fig. 14b, and will be
further discussed later). Due to the blockage effect of rib structure, the early overturning
of the purge air is largely reduced, and more cooling air can stay near the end-wall.
17 surface decreases more gradually. The experimental data have very good agreement with
CFD results both qualitatively and quantitatively in the region where test data is available.
Figure 16 shows a quantitative comparison of the local film cooling effectiveness
variation along the radial direction at the angular position of 50°. Solid lines and dash lines
are used to represent the experimental data and CFD result, respectively. Consistent Figs.
13 and 14, a significant increase of film cooling effectiveness can be observed at r/R>0.5
due to the guidance effect of ribs. The underprediction of coolant coverage near the outer
wall region from CFD can also be consistently found for both smooth and ribbed walls.
The contours of heat transfer coefficient on the smooth and ribbed surfaces are
shown in Fig. 17. Some stripes with high values of heat transfer coefficient can be
observed near the end of the ribs, where the flow is dominant by small vortices developed
earlier in the rib grooves. But there is a significant reduction of heat transfer coefficient
for the majority of the after-rib region due to the relatively slower convection speed of
the near wall coolant. Figure 18 presents the heat transfer coefficient distribution
obtained by CFD simulation. There is a consistent agreement with the experimental data
at the 45o to 90 o region. For the smooth surface case, a low the heat transfer coefficient
region from 20 o to 45 o can be observed. This is related to the lift-off of the passage vortex
from the end-wall. With the addition of ribs, the heat transfer coefficient is largely
increased within the grooves due to small vorticies previously shown in Fig. 11.
To assess the overall cooling performance, the net reduction in heat flux relative
18 previously defined by Sen et al. [28], is the fractional decrease in heat flux due to film
cooling,
𝑁𝐻𝐹𝑅 = 1 −𝑞𝑓 ′′
𝑞0′′ (6)
In the present study, 𝑞𝑓′′ represents the heat flux for ribbed surface with film cooling, and
𝑞0′′ represents the heat flux for smooth surface without film cooling.
For end-wall region without ribs, the NHFR can be further written as:
∆𝑞𝑟 = 1 − ℎ𝑓 ℎ0
(1 − 𝜂𝜑) (7)
The non-dimensional metal temperature 𝜑 is defined as:
𝜑 =𝑇∞− 𝑇𝑐
𝑇𝑟− 𝑇𝑏 (8)
where 𝑇∞ is the mainstream temperature, Tc is the coolant total temperature, Tb is the
blade metal temperature, Tris the recovery temperature. A value of 1.6 is used for typical
engine conditions (Sen et al. [28]).
The NHFR distributions on the smooth and ribbed surfaces in the experiments are
shown in Fig. 19. The blue color represents the region with low heat flux reduction, while
the red color corresponds to the region benefiting from purge air cooling. CFD results in
Figure 20 shows a similar pattern as the experimental data. With the addition of rib
structure, more area of the end-wall region can benefit from purge air cooling.
Practical Considerations and Design Optimization Strategy
For practical application in turbine system, the ribbed surface has to be fully
19 improvement in NHFR, the rib design has to be carefully optimized to achieve a
reasonable level of cooling effectiveness near the rib structures for their long-term
survival.
As pointed out in the previous discussions, there is a poor coolant coverage over
the rib top surface near the duct entry region. The non-dimensional temperature 𝜃
distribution near entry region is shown in Fig.21a for the previous ribbed end-wall design.
The purge air injected through the slot blocks the cooling fluid and it cannot reach the top
surface the rib. Apparently the rib height selected needs to be further optimized.
An improved cooling performance is achieved from another optimized CFD case
with 40% reduction of overall rib height, as illustrated in Fig. 21b and Fig. 22. The film
cooling effectiveness near the upstream region is significantly enhanced by adding ribs
with an optimal height.
Another region which deserves further attention is the ribs close to outer wall.
The discrete blue stripes shown from the experimental data in Fig. 13b, as well as the low
ƞ region near the duct outer wall in Fig. 22, indicate the ribs could be vulnerable for hot
gas. Figure 23 presents fluid streamlines colored by temperature which illustrate the
development of purge air flow within the grooves of the ribbed end-wall. Apparently, the
ribs cannot completely stop the radial migration of the purge air flow, especially near the
outer wall region. According to many previous study related to purge air cooling (Wright
et al. [14], Knost and Thole [29], Nicklas [30], and Wright et al.[31]), additional film cooling
is always needed to provide sufficient coverage to the end-wall. The ribbed end-wall
20 overcome its limitation. However, results from the present study indicates that the needs
from conventional end-wall cooling design should be greatly reduced.
For end-wall region with ribs, the heat load introduced by additional surface area
needs to be taken into account. To fully assess the performance of ribbed structure, it
may be more sensible to compare the total heat load rather than heat flux. A Net Heat
Load Reduction (NHLR) can be expressed as,
𝑁𝐻𝐿𝑅 = 1 −
∫ ℎ𝐴 𝑓(𝑇𝑎𝑑− 𝑇𝑤)𝑑𝐴𝑓
𝑓
∫ ℎ𝐴0 0(𝑇∞− 𝑇𝑤)𝑑𝐴0
= 1 −
∫ ℎ𝑓(𝑇𝑎𝑑 𝑇
𝑤
⁄ − 1) 𝑑𝐴𝑓
𝐴𝑓
∫ ℎ𝐴0 0(𝑇∞⁄𝑇𝑤− 1) 𝑑𝐴0
(9)
where the temperature ratios 𝑇∞/𝑇𝑤, 𝑎𝑛𝑑 𝑇𝑎𝑑/𝑇𝑤 can be replaced by typical values at
engine conditions. The NHLR definition can be further simplified as follows:
𝑁𝐻𝐿𝑅 = 1 −
∫ ℎ𝑓𝐴 (1 − 𝜂𝜑)𝑑𝐴𝑓
𝑓
∫ ℎ0𝐴 𝑑𝐴0
0
(10)
Distributions of NHLR along the duct passage is shown in Fig.24. As expected, the
case with larger rib height (h/δ=0.25) does not show an overall improvement in heat load
reduction due to some local poor coolant coverage. However, the case with reduced rib
height (h/δ=0.15) gives consistent improvement for all the duct locations. An overall 11%
improvement in NHLR is obtained.
In terms of practical design optimization strategy, the surface feature should be
determined according to the incoming flow boundary layer characteristics, the purge air
blowing ratio, blade loading, etc. Rib structure with variable heights along the flow
passage should be able to achieve a better performance. Instead of protrusion, groove
21 flexibility from the aerothermal perspective are being made feasible by the advances in
Additive Manufacturing.
SUMMARY AND CONCLUSIONS
This paper presents the feasibility study of a novel end-wall flow control and
thermal management concept. Purge air cooling performance with both smooth and
ribbed end-wall was investigated in a simplified 90° turning duct through a combined
experimental and numerical study. Transient thermal measurement was conducted in a
low speed wind tunnel. Further analysis on the detailed flow structure was carried out by
using a commercial CFD code.
The CFD analysis reveals that a ribbed end-wall can guide the purge air flow further
to cover more end-wall surface. The secondary flow vortex can be reduced by the ribs
blockage for cross-flow migration and the vortices generated in the rib grooves maintain
the purge air attached to the end-wall. The film cooling effectiveness, heat transfer
coefficient and NHFR obtained in transient thermal measurement consistently validate
the numerical findings. With the addition of engineered surface structure, the film cooling
effectiveness is significantly increased, the overall heat load can also be reduced even
with the extra rib surface area.
It is suggested that the design of small-scale surface feature needs to be carefully
optimized to ensure sufficient coolant coverage and avoid being burnt out in practical
22 This novel engineered surface structure concept proposed in the present study
provides a much improved design space and new research dimension in turbine end-wall
cooling.
NOMENCLATURE
D Duct width
d Rib distance
H Duct height
h Rib height, Heat transfer coefficient
HTC Heat transfer coefficient (W/(m2-K))
n Rib number
𝑞′′ Heat flux (W/m2)
𝑟𝑖 Duct inner radius
𝑟𝑜 Duct outer radius
𝑅2 Coefficient of determination
R/D Radial-wise measurement location normalized by duct width
SSE Sum of square error
23
T Local temperature
𝑇𝑎𝑑 Adiabatic wall temperature
𝑇𝑏 Blade metal temperature
𝑇𝑝 Purge air temperature
𝑇𝑟 Recovery temperature
𝑇𝑤 End-wall temperature
𝑇∞ Mainstream temperature
𝑉∞ Inlet velocity
w Rib width
Y/P Pitch-wise measurement location normalized by pitch
y+ Non-dimensional wall distance: y uty
Z/H Span-wise measurement location normalized by duct height
NHFR Net heat flux reduction
NHLR
Net heat load reduction 𝑁𝐻𝐿𝑅 = 1 −
∫𝐴𝑓ℎ𝑓(1−𝜂𝜑)𝑑𝐴𝑓
∫ ℎ0𝑑𝐴0
𝐴0
β Relative angle between streamwise direction and x-axis
𝜃 Non-dimensional fluid temperature
δ Boundary layer thickness
24 𝜂 Film cooling effectiveness
Ω Vorticity
REFERENCES
[1] Han, J.C., 2004, “Recent studies in turbine blade cooling,” International Journal of
Rotating Machinery, 10(6), pp.443-457.
[2] Bunker, R.S., Metzger, D.E. and Wittig, S., 1992, “Local Heat Transfer in Turbine Disk
Cavities: Part I—Rotor and Stator Cooling with Hub Injection of Coolant,” Journal of
Turbomachinery, 114, p.211.
[3] Bunker, R.S., Metzger, D.E. and Wittig, S., 1992, “Local Heat Transfer in Turbine Disk
Cavities: Part II—Rotor Cooling with Radial Location Injection of Coolant,” Journal of
Turbomachinery, 114(1), pp.221-228.
[4] Wilson, M., Arnold, P.D., Lewis, T.W., Mirzaee, I., Rees, D.A.S. and Owen, J.M., 1997,
“Instability of flow and heat transfer in a rotating cavity with a stationary outer casing,”
Eurotherm 55 (Heat Transfer in a Single Phase Flow).
[5] McLean, C., Camci, G., and Glezer, B., 2001, "Mainstream aerodynamic effects due to wheelspace coolant injection in a high-pressure turbine stage," Journal of Turbomachinery, 123(4), pp.687-703.
[6] McLean, C., Camci, C., and Glezer, B., 2001, "Mainstream Aerodynamic Effects Due to Wheelspace Coolant Injection in a High-Pressure Turbine Stage: Part II—Aerodynamic
25
[8] Reid, K., Denton, J., Pullan, G., Curtis, E. and Longley, J., 2006, “The effect of
stator-rotor hub sealing flow on the mainstream aerodynamics of a turbine,” ASME Paper No.
GT2006-90838.
[9] Roy, R.P., Squires, K.D., Gerendas, M., Song, S., Howe, W.J. and Ansari, A., 2000, “Flow
and Heat Transfer at the Hub Endwall of Inlet Vane Passages—Experiments and
Simulations,” ASME Paper No. 2000-GT-0198.
[10] Burd, S.W., Satterness, C.J. and Simon, T.W., 2000, “Effects of Slot Bleed Injection
Over a Contoured End Wall on Nozzle Guide Vane Cooling Performance: Part II—Thermal
Measurements,” ASME Paper No. 2000-GT-0200.
[11] Oke, R., Simon, T., Shih, T., Zhu, B., Lin, Y.L., and Chyu, M., 2001, “Measurements over
a Film-Cooled Contoured Endwall with Various Coolant Injection Rates,” ASME Paper No.
2001-GT-0140.
[12] Dénos, R. and Paniagua, G., 2002, “Influence of the Hub Endwall Cavity Flow on the
Time-Averaged and Time-Resolved Aero-Thermodynamics of Axial HP Turbine Stage,”
ASME Paper No. GT2002-30185.
[13] Wright, L.M., Gao, Z., Yang, H. and Han, J.C., 2008, “Film Cooling Effectiveness
Distribution on a Gas Turbine Blade Platform with Inclined Slot Leakage and Discrete Film
Hole Flows,” Journal of Heat Transfer, 130(7), p.071702.
[14] Wright, L.M., Blake, S.A., and Han, J.C., 2006, “Film Cooling Effectiveness
Distributions on a Turbine Blade Cascade Platform with Stator-Rotor Purge and Discrete Film Hole Flows,” In ASME 2006 International Mechanical Engineering Congress and
Exposition (pp. 489-498). American Society of Mechanical Engineers.
[15] Popovic, I. and Hodson, H.P., 2010, “Aerothermal Impact of the Interaction Between
Hub Leakage and Mainstream Flows in Highly-Loaded HP Turbine Blades,” ASME Paper
No. GT2010-22311.
[16] Miao, X., Zhang, Q., Atkin, C. and Sun, Z., 2016, “End-Wall Secondary Flow Control
Using Engineered Residual Surface Structure,” ASME Paper No. GT2016-57347
[17] Miao, X., Zhang, Q., Wang, L., Jiang, H., & Qi, H, 2015, “Application of riblets on turbine blade endwall secondary flow control,” Journal of Propulsion and Power, 31(6),
1578-1585.
26 [19] Schulz, A., 2000, "Infrared Thermography as Applied to Film Cooling of Gas Turbine Components." Measurement Science and Technology, vol. 11, no. 7, pp. 948.
[20] O’Dowd, D.O., Zhang, Q., He, L., Ligrani, P.M. and Friedrichs, S., 2011, “Comparison of heat transfer measurement techniques on a transonic turbine blade tip,” Journal of
Turbomachinery, 133(2), p.021028.
[21] Zhang, Q., He, L., Wheeler, A.P.S., Ligrani, P.M. and Cheong, B.C.Y., 2011, “Overtip shock wave structure and its impact on turbine blade tip heat transfer,” Journal of
Turbomachinery, 133(4), p.041001.
[22] Zhang, Q., O’Dowd, D.O., He, L., Oldfield, M.L.G. and Ligrani, P.M., 2011, “Transonic
Turbine Blade Tip Aerothermal Performance with Different Tip Gaps—Part I: Tip Heat
Transfer,” Journal of Turbomachinery, 133(4), p.041027.
[23] Zhang, Q., He, L., Cheong, B.C.Y. and Tibbott, I., 2013, “Aerothermal performance of
a cooled winglet at engine representative Mach and Reynolds numbers,” Journal of
Turbomachinery, 135(1), p.011041.
[24] Oldfield, M.L., 2008. Impulse response processing of transient heat transfer gauge signals. Journal of Turbomachinery, 130(2), p.021023.
[25] Ma, H., Zhang, Q., He, L., Wang, Z. and Wang, L., 2017, “Cooling Injection Effect on a
Transonic Squealer Tip—Part I: Experimental Heat Transfer Results and CFD Validation,”
Journal of Engineering for Gas Turbines and Power, 139(5), p.052506.
[26] Moffat, R. J., 1988, “Describing the Uncertainties in Experimental Results,”
Experimental Thermal and Fluid Science, vol. 1, pp. 3–17.
[27] Devore, J.L., 2011, “Probability and Statistics for Engineering and the Sciences,”
Cengage learning.
[28] Sen, B., Schmidt, D.L., and Bogard, D.G., 1996, “Film Cooling with Compound Angle Holes: Heat Transfer”, ASME J. of Turbomachinery, Vol. 118.
[29] Knost, D. and Thole, K., 2005, “Adiabatic effectiveness measurements of endwall film -cooling for a first-stage vane,” Journal of turbomachinery, 127(2), pp.297-305.
[30] Nicklas, M., 2001, “Film-cooled turbine endwall in a transonic flow field: Part ii—heat transfer and film-cooling effectiveness,” Journal of Turbomachinery, 123(4), pp.720-729.
[31] Wright, L.M., Blake, S. and Han, J.C., 2007, “Effectiveness Distributions on Turbine
Blade Cascade Platforms Through Simulated Stator-Rotor Seals,” Journal of
27 Figure Captions List
Fig. 1 A schematic of the experiment facility employed in the present study.
Fig. 2 Inlet end-wall turbulent boundary layer velocity profile.
Fig. 3 IR camera calibration curve.
Fig. 4 (a) Time histories of the cold purge air, end-wall and inlet temperatures,
and (b) variations of wall heat flux and surface temperature for one
selected location, during one typical transient measurement.
Fig. 5 (a) R2 distribution for linear regression, and (b) Relative uncertainty (%U)
in 𝑇𝑎𝑑 distribution.
Fig. 6 The computational domain and grids employed in the present study.
Fig. 7 Spanwise-averaged total pressure loss coefficient 𝐶𝑝
Fig. 8 Total pressure loss coefficient 𝐶𝑝 distributions for cases with and without
single fence obtained at 90-degree plane of the duct.
Fig. 9 An iso-temperature surface with 𝜃 = 0.6.
Fig. 10 Non-dimensional temperature 𝜃 distribution at three angular cross
sections.
Fig. 11 Streamwise vorticity distributions at three angular cross sections.
Fig. 12 Distributions of Aerodynamic loss coefficient at the exit plane.
28 Fig. 14 Film cooling effectiveness (CFD results).
Fig. 15 Laterally film cooling effectiveness 𝜂̅ along the duct passage for both
experimental and CFD results.
Fig. 16 Film cooling effectiveness variation along the radius direction
Fig. 17 Heat transfer coefficient (experimental data).
Fig. 18 Heat transfer coefficient (CFD).
Fig. 19 Distributions of NHFR (experimental data).
Fig. 20 Distributions of NHFR (CFD results).
Fig. 21 Non-dimensional temperature 𝜃 distribution near the purge air entry
region for ribbed surface.
Fig. 22 Distributions of film cooling effectiveness.
Fig. 23 Cooling fluid streamlines near the end-wall ribs.
29 Table Caption List
Table 1 Geometry of ribs array on the end-wall.
33
Figure 4. (a) Time histories of the cold purge air, end-wall and inlet temperatures, and (b)
variations of wall heat flux and surface temperature for one selected location, during one
[image:34.612.154.510.143.489.2]34 Figure 5. (a) R2 distribution for linear regression, and (b) Relative uncertainty (%U) in 𝑇
𝑎𝑑
[image:35.612.90.518.214.361.2]37
[image:38.612.98.524.100.567.2]
No fence Single fence
38 (a) Smooth surface (b) Ribbed surface
39 (a) Smooth surface (b) Ribbed surface
40 (a) Smooth surface (b) Ribs surface
41 (a) Smooth surface (b) Ribbed surface
42 (a) Smooth surface (b) Ribbed surface
43
(a) Smooth surface (b) Ribbed surface
44 Figure 15. Laterally film cooling effectiveness 𝜂̅ along the duct passage for both
46 (a) Smooth surface (b) Ribbed surface
47 (a) Smooth surface (b) Ribbed surface
48 (a) Smooth surface (b) Ribbed surface
49 (a) Smooth surface (b) Ribbed surface
50 (a) h/δ=0.25 (b) h/δ=0.15
51
[image:52.612.111.515.184.377.2](a) h/δ=0.25 (b) h/δ=0.15
52 (a) Smooth surface (b) Ribbed surface h/δ=0.25 (c) Ribbed surface h/δ=0.15
55 Table 2. Measurement uncertainties
Measurement Relative uncertainty 95% confidence Material property 5% (564±28√𝑠/m2K)
Measured wall temperature 1K
h 8.7%