1
Physical Mechanism of Ice-Structure Interaction
1
Xu Ji*, Erkan Oterkus** 2
* Department of Naval Architecture, Ocean and Marine Engineering, University of Strathclyde 3
100 Montrose Street Glasgow G4 0LZ, United Kingdom 4
Phone: +44 (0)141 5484094 5
e-mail: [email protected] 6
** Department of Naval Architecture, Ocean and Marine Engineering, University of Strathclyde 7
100 Montrose Street Glasgow G4 0LZ, United Kingdom 8
Phone: +44 (0)141 5483876 9
e-mail: [email protected] 10
11
ABSTRACT.To obtain the effect of velocity and structural natural frequency (structural stiffness) on ice 12
failure, an extended dynamic Van der Pol based single degree-of-freedom ice-structure interaction model 13
is developed. Three basic modes of response were reproduced: intermittent crushing, frequency lock-in 14
and continuous crushing. Further analysis on physical mechanism of ice-structure interaction is presented 15
on the basis of feedback mechanism and energy mechanism, respectively. Internal effect and external 16
effect from ice and structure were both explained in the feedback branch. Based on reproduced results, 17
energy exchanges at different configurations are computed from the energy conservation using the first 18
law of thermodynamics. A general conclusion on the predominant type of vibration when the ice velocity 19
increases during the interaction process is forced, self-excited and forced in each three modes of responses. 20
Ice force variations also shows that there is more impulse energy during the lock-in range. Moreover, ice-21
induced vibration (IIV) demonstrates an analogy of friction-induced self-excited vibration. Finally, the 22
similarity between strain-stress curve and Stribeck curve shows that static and kinetic friction force 23
variations are attributed to ice force characteristic, and can be used to explain the lower effective pressure 24
magnitude during continuous crushing than the peak pressure during intermittent crushing. 25
KEYWORDS: Physical mechanism; Ice-structure interaction; Ice-induced vibrations; Van der Pol equation; 26
Frequency lock-in. 27
28
NOMENCLATURE 29
L Correlation or ice failure length (m)
H Ice thickness (m)
0
v Reference velocity (m s-1)
,
2
d Segment width (m)
D Structural width (m)
n Number of segments
0
K
Reference structural stiffness (kN m-1) K Structural stiffness (kN m-1)n
ω
Angular natural frequency of structure (rad s-1)n
f Natural frequency of the structure (Hz)
0
f Reference frequency (Hz)
M Mass of the structure (kg)
C Structural damping coefficient (kg s-1)
X Structural acceleration (m s-2) X Structural velocity (m s-1)
X Structural displacement (m)
F Ice force (kN)
T Time (s)
A Magnification factor
σ
Ice stress (kPa)q Dimensionless fluctuation variable
,
a ε Scalar parameters that control the q profile
i
ω
Angular frequency of ice force (rad s-1)i
f Ice failure frequency (Hz)
B Coefficient depending on ice properties
Y Ice displacement (m)
Y Ice acceleration (m s-2)
ε Strain rate (s-1)
r
v Relative velocity between ice and structure (m s-1)
λ Dimensionless coefficient
max
σ
Maximum stress at ductile-brittle range (kPa),
d b
σ σ
Minimum stress at ductile and brittle range (kPa) ,α β Positive and negative indices to control the envelope profile
t
v Transition ice velocity approximately in the middle of transition range (m s-1)
ξ Damping ratio
t
W
Δ
Incremental work done by ice forcem
E
Δ
Incremental change of mechanical energy in the structured
E
Δ
Incremental heat dissipated by the structural dampingp
E
Δ Incremental change of potential energy in the structure
k E
3 s
f Frequency of structural displacement
s
µ
Static friction coefficientk
µ
Kinetic friction coefficient1.
INTRODUCTION
1
Ice-structure interaction drew people’s attention since the oil exploration and exploitation in Cook Inlet, 2
Alaska, 1962. Large variations of ice properties (Peyton, 1966) and large amplitude ice-induced vibration (IIV) 3
phenomenon (Blenkarn, 1970) were noticed and discussed from the data collected from this area. Although 4
global warming had a negative effect on ice research activities during the past decade or two, there is an 5
increasing interest on the possibility of using a new route in the Arctic Ocean from Far East to Europe and oil 6
and gas explorations in this area. Hence, it is essential to design ships and offshore structures which are 7
resistant to possible ice impacts on the structure. However, because of the complex nature of ice and limited 8
full-scale data, ice models and experiments show differences (Sodhi, 1988) which makes the ice related 9
research still a challenging area. 10
Even after around half a century, the basic physical mechanism of the severest vibrations during ice-11
structure interaction, IIV, is still not fully understood. Blenkarn (1970) and Määttänen (2015) argued that it 12
was the reason of self-excited vibration because of the negative damping theory. On the other hand, Sodhi 13
has forced vibration from resonance opinion as in Sodhi (1988) because negative damping explanation is not 14
rigorous. Besides, Sodhi (1991a) found that energy is always dissipating into ice, which rules out the chance 15
of negative damping to occur. 16
In this study, before providing further explanations of ice mechanics, an extension of Ji and Oterkus (2016) 17
model will be introduced first. This model is based on substituting an empirical parameter to include 18
structural stiffness and ice velocity effects. Then, a series of reproduced numerical results based on the 19
experiments done by Sodhi (1991b) will be presented. Finally, physical mechanism of ice-structure 20
interaction process and ice force frequency lock-in during IIV will be discussed from both Määttänen and 21
Sodhi’s point of view by analysing negative damping phenomena, energy exchanges and stress variations 22
based on the reproduced numerical results. 23
2.
MODEL DESCRIPTION
24
2.1 Ice failure / correlation length parameter
25
Ice failure length is an idealised concept for numerical calculation based on the damage zone or crushing 26
zone concept in experimental tests. Ice failure length is taken as a constant 1/3 of ice thickness in Ji and 27
Oterkus (2016), which means ice fails at a certain length if ice thickness does not vary. However, it ranges 28
from 1/2 to 1/5 of ice thickness according to the tests by Sodhi and Morris (1986) covering an area when it 29
is used for ice force predominant frequency calculations. It is the reason that ice damage zone becomes 30
smaller by increasing ice velocity (Kry, 1981, Sodhi, 1998). At low ice velocity, there is a large damage zone 31
with radial cracks along from the contact area. When the velocity reaches high level, the damage zone 32
becomes much smaller with only microcracks near the interaction surface. 33
Sodhi (1998) proposed another concept, i.e. correlation length parameter L, to describe the size and the 34
amount of damage zone of ice in relation to ice velocity. He proposed an equation to estimate this parameter 35
4 the number of segments used as 1, 3, 5 or 7 to control the structural width D, and d H/ ratio is in the 1-3 1
range. It can be seen that the correlation length is decreasing with increasing ice velocity. In this paper, 2
structural width is considered as one whole segment, i.e. n=1. Thus, the equation is used in the form of 3
0
/ ( / )( / )
L H = v v D H . Assuming D H/ =2, then L H/ =2 /v v0 which is done under the assumption that 4
the ice failure length has a relationship to ice thickness and not to structural width (Sodhi, 1998). 5
In addition to ice velocity, structural stiffness has a linear relationship with ice failure length in ice force 6
frequency calculation (Määttanen, 1975, Sodhi and Nakazawa, 1990). Experimental test conducted by Sodhi 7
(1991b) also shows this relationship. These are Test 63, Test 66 and Test 67 under almost the same conditions 8
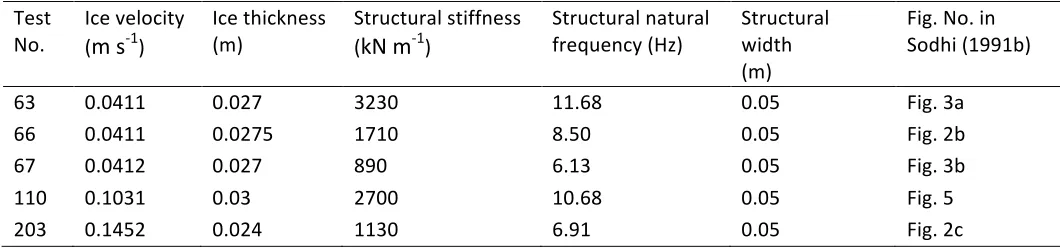
except that the structural stiffness in each test was 3230, 1710 and 890 kN m-1, respectively. As listed in 9
Table 1, the ice velocity, ice thickness and structural width are nearly the same. Time-history plotting of ice 10
force in Sodhi (1991b) showed that the average maximum value was around 15 kN in all tests. However, the 11
frequency showed an approximately linearly decreasing trend when the structural stiffness decreases, with 12
the value of 3.33 Hz, 2.17 Hz and 1.25 Hz, respectively. 13
Table 1. Test configurations from Sodhi (1991b) 14
Test No.
Ice velocity (m s-1)
Ice thickness (m)
Structural stiffness (kN m-1)
Structural natural frequency (Hz)
[image:4.595.40.570.275.399.2]Structural width (m)
Fig. No. in Sodhi (1991b)
63 0.0411 0.027 3230 11.68 0.05 Fig. 3a
66 0.0411 0.0275 1710 8.50 0.05 Fig. 2b
67 0.0412 0.027 890 6.13 0.05 Fig. 3b
110 0.1031 0.03 2700 10.68 0.05 Fig. 5
203 0.1452 0.024 1130 6.91 0.05 Fig. 2c
15
Following the effect of ice velocity on ice failure from correlation length parameter and by adding up the 16
linear structural stiffness effect, the general form of ice failure length can be written as 17
0 0
2 L v K
H = v K (1)
18
where
K
0 is the reference structural stiffness and K is the structural stiffness. Constant value of 2 also 19satisfies the ratio of structural width to ice thickness in the range of 1.67 and 2.08 as listed in Table 1. If the 20
mass of the structure remains the same, the natural frequency of the structure will be proportional to the 21
structural stiffness as ωn = K M/ , where
ω
n is the angular natural frequency of the structure and M is 22the mass of the structure. Besides, the ISO 19906:2010 tends to use the structural natural frequency to 23
define the highest ice velocity that lock-in condition can occur, v=
γ
v nf , whereγ
v =0.06 m. Hence, (1) can 24be rewritten in the form of 25
0 0
2
n
v f L H
v f
= (2)
26
by substituting the stiffness with the frequency, where f0 is the reference frequency and fn is the natural
27
frequency of the structure. 28
2.2 Main equations
29
In this study, governing equations and ice stress-strain rate relationship are adopted directly from Ji and 30
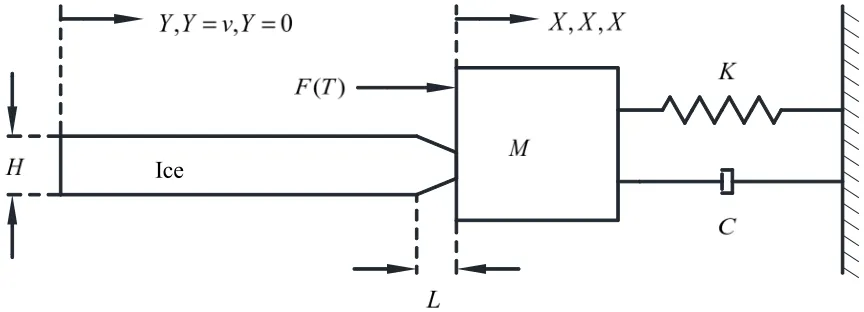
5 sheet, in the current numerical model ice is moving against a stationary structure. The ice-structure 1
interaction model is taken as a mass-spring-damper system as illustrated in Fig. 1. There are “internal effect” 2
and “external effect” regarding to ice and structure. Internal effect corresponds to ice own failure 3
characteristic and is represented by Van der Pol oscillator without forcing term. On the other hand, external 4
effect corresponds to structural effects including structural displacement and structural velocity, i.e. relative 5
displacement and relative velocity between ice and structure. The Van der Pol oscillator and ice stain-stress 6
function are coupled as ice force variations. Relative velocity is considered in ice strain rate-stress 7
relationship and the right-hand side of Van der Pol oscillator. Relative displacement between ice and 8
structure is also considered within the oscillator. Compressive stress results in ice deformation and when 9
the deformation exceeds the natural ice failure length, ice failure occurs. Therefore, ice will fail under both 10
internal and external effects. The model consists of equation of motion and Van der Pol equation, i.e. 11
2 2
( ) ( )
( 1) i( )
i i
MX CX KX F T ADH q a B
q q q q Y X
H σ ω εω ω ⎧ + + = = + ⎪ ⎨ + − + = −
⎪⎩ (3)
12
in conjunction with the ice stress-strain rate relationship given in (4). In (3), X is the displacement of the 13
structure, the “dot” symbol represents the derivative with respect to time T , A is the magnification factor 14
adjusted from experimental data, D is the structural width, q is the dimensionless fluctuation variable,
a
15and
ε
are scalar parameters that control the lower bound of ice force value and saw-tooth ice force profile, 16respectively,
ω
i=
2
π
f
i is the angular frequency of ice force, B is a coefficient depending on ice properties 17and Y is the displacement of ice. 18
[image:5.595.84.516.382.538.2]19
Fig. 1. Schematic sketch of dynamic ice-structure model. 20
2.3 Ice stress-strain rate equation
21
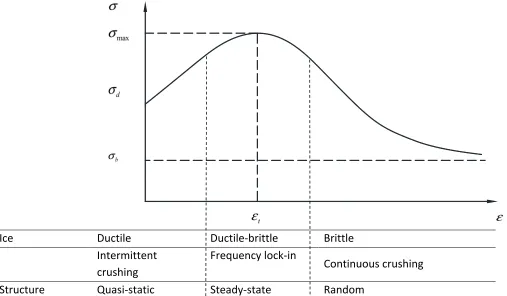
It is found and proved that ice uniaxial stress or indentation stress is a function of the strain rate as shown 22
in Fig.2 (Blenkarn, 1970, Michel and Toussaint, 1978, Palmer and others, 1983, Sodhi and Haehnel, 2003). 23
The strain rate is defined by
v
r/
λ
D
, where the dimensionless coefficient λ varies from 1 to 4 and D is 24the structural width (Yue and Guo, 2011). It can be expressed by two separate dimensional power functions: 25
max
max
( )( / ) , / 1 ( )( / ) , / 1
d r t d r t
b r t b r t
v v v v
v v v v
α
β
σ σ σ
σ
σ σ σ
⎧ − + ≤
⎪ =⎨
− + >
⎪⎩ (4)
26
where
σ
max is the maximum stress at ductile-brittle range,σ
d andσ
bare the minimum stress at ductile 276 envelope profile, respectively, and vt is the transition ice velocity approximately in the middle of transition 1
range. 2
3
Ice Ductile Ductile-brittle Brittle
Intermittent crushing
Frequency lock-in
Continuous crushing
[image:6.595.42.549.88.384.2]Structure Quasi-static Steady-state Random
Fig. 2. Strain rate vs. uniaxial or indentation stress corresponding to ice failure and structural response mode. 4
2.4 Parameter values
5
Each parameter in the (3) and (4) is determined from the tests conducted by Sodhi (1991b) and summarised 6
in Table 1. In the equation of motion, A=0.22 is the magnification factor adjusted by any one of the cases 7
to determine the upper bound of the ice force except for the Test. 110 which is 0.15. a=2 is set to assume 8
that all force will drop to zero after each cycle of loading. D=0.05 m and M =600 kgare from the test 9
configuration. ξ =0.1 is not given but found in Fig.5 of Sodhi (1994). In the Van der Pol equation, ε =4.6 is 10
adjusted for better force envelope behaviour. B=0.1 is calibrated by the results from Test. 63 and Test. 67. 11
In the ice stress-strain rate equation,
σ
d=
8800 kPa
because the maximum pressure is 8.8 MPa from Test. 1264. In Test. 66, the effective failure pressure varies from 8-13 MPa under intermittent crushing. Therefore, 13
max 13000 kPa
σ
= is used for maximum value and α =0.35. In Test. 67, the pressure is 4.4 MPa. Therefore, 144400 kPa
b
σ
= and β =−6 except for Test. 203 at high velocity, i.e.σ
b =1700 kPa from the data provided. 15Transition ice velocity is set to 0.05 m s 1
t
v = − because high velocity range described by Sodhi was above 0.1 16
m s-1 and the middle value is estimated. In the ice failure length equation, 1 0 0.03 m s
v = − is used as suggested
17
by Sodhi (1998). K0 =710 kN m-1, i.e.
0 5.47
f = Hz, is adjusted by the results from Test. 63 and Test. 67. 18
Summary of all parameter values is listed below: 19
7 1 1 0 0 ma 0 x
0.05 m, 600 kg, 0.1, 0.22 (0.15 for Test.110), 2;
4.6, B 0.1, 0.03 m s , 710 kN m , ;
8800 kPa, 4300 kPa (1700 kPa for Test. 203), 13000 kPa, 0.35, 6, 0
5.47 Hz
d b t
D M f A a v K v ξ ε
σ σ σ α β
− − = = = = = = = = = = = = = =− = = 1
.05 m s .−
1
2
3.
RESULTS
3
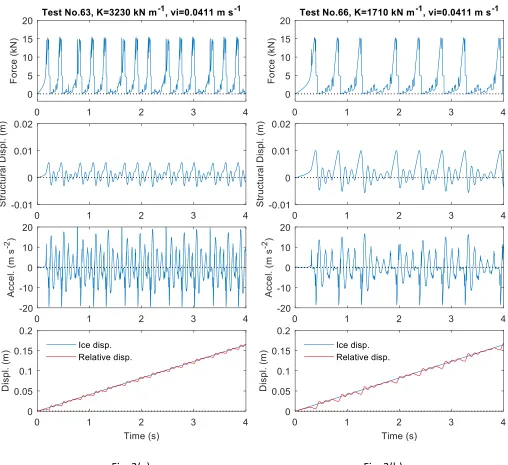
Based on the experimental results, reproduced results generated from the numerical model are shown in 4
Fig. 3, which are in a pretty good match with those from experiments. In these figures, records of variables 5
are plotted with respect to time, such as ice force, displacement of the structure, acceleration of the 6
structure and structural displacement with respect to the ice. Relative displacement is calculated by 7
subtracting the structural displacement from ice displacement. Positive direction of the structural motion, 8
i.e. the same direction as ice motion, is in the opposite direction with respect to Sodhi’s results since the ice 9
is assumed to move against the structure in the model whereas the indenter is set to move against the ice 10
sheet in the Sodhi’s experiments. 11
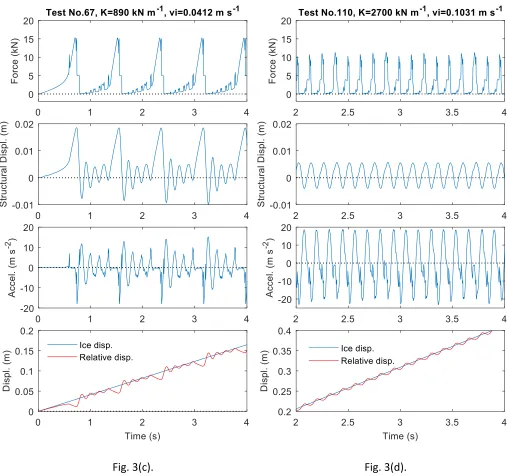
Fig. 3(a), Fig. 3(b) and Fig. 3(c) show results for Test. 63, Test. 66 and Test. 67, respectively, where all 12
parameters are the same apart from the structural stiffness. The values of stiffness are 3230, 1710 and 890 13
kN m-1, respectively. Amplitude and frequency of ice force and displacement are almost the same as those 14
in experiments, reaching at 15 kN, with around fourteen, eight and five cycles of ice loading in four seconds, 15
respectively. Although the ice failure forces are approximately the same, the ice failure frequency in each 16
figure shows a clear dependence on the stiffness, because structural stiffness has a linear relationship with 17
ice failure length as controlled by (1). 18
Acceleration in Fig. 3(a) shows around fifty percent bigger than that in the test because there are some 19
drops during loading phases. Moreover, there are some drops around the peak values, which are realistic 20
since the stress varies with the relative velocity. When the force reaches the maximum, the relative velocity 21
will become zero leading the force to drop to the corresponding stress value. In addition, this difference may 22
be the reason of filtering process in experimental data that eliminates some sharp peak fluctuations and 23
lowers the acceleration amplitude significantly. 24
If we take the Fig. 3(c) as an example in which force and displacement are plotted more clearly, there is 25
almost no acceleration of the structure during loading phase in the detailed plot. At the instant of ice failure, 26
the structure is in the maximum excursion place and the potential energy stored in the spring is then 27
transformed into kinetic energy, moving the structure backwards against ice motion. The interaction force 28
then drops to a much lower level suddenly at around 1/3 of the value at the instant of failure. It is the reason 29
that crushed ice is in contact with and extruded by the backwards motion of the structure. After the extrusion, 30
ice lost contact with the structure for a short time while the force is almost zero, which is called as separation 31
phase according to Sodhi. 32
It can be noticed that there is some sudden unloading of ice force in Fig. 3(a) and (b) because of the 33
external effect appearance. It occurs when the structure is moving backwards with respect to ice motion at 34
first. The compressive stress between ice and structure results in ice deformation and failure occurs when 35
the deformation exceeds the natural ice failure length 𝐿 can tolerate. So, relative displacement is subtracted 36
by the amount of 𝐿 additionally leading to a negative value. Moreover, this external effect occurs after three 37
8 all run in sixteen seconds but plotted in four seconds only. The reason that there is no such external effect 1
in Test No. 67 is because structural stiffness, i.e. structural natural frequency, has an impact on the lock-in 2
condition range as the ISO 19906:2010 revealed. As defined in (2), the higher the structural stiffness, the 3
smaller the ice failure length. Therefore, lock-in condition will occur even under the same ice velocity if 4
structural stiffness is high enough. 5
Fig. 3(d) shows a steady-state vibration of the structure with a frequency close to its natural frequency. 6
The ice force shows almost exactly the same periodic “spike” like loading envelope profile as that in the test, 7
in which the maximum amplitude of force is around 11 kN and a frequency of 9 Hz approximately. It can be 8
noticed that range and amplitude of structural displacement and acceleration are different from those in the 9
test. There are two reasons for this difference because of ice force. The first reason is that ice force is 10
controlled to drop to zero during each cycle of loading. The second is only the maximum value is considered 11
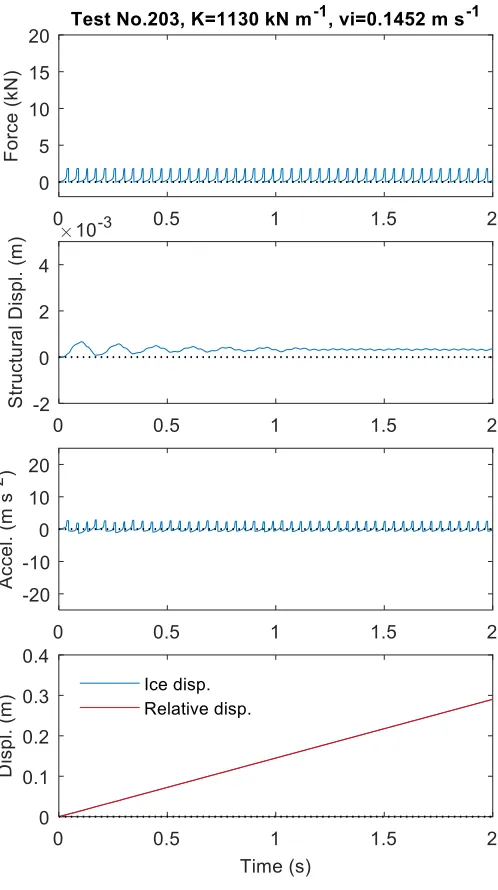
and predicted. Similar difference can also be found in Fig. 3(e), which shows the continuous crushing 12
behaviour under high ice velocity. Ice force is matching at around 2.5 kN with the test and no obvious 13
vibration of the structure is found. 14
15
Fig. 3(a). Fig. 3(b).
[image:8.595.39.547.294.759.2]9 1
Fig. 3(c). Fig. 3(d).
[image:9.595.38.545.38.514.2]10 1
[image:10.595.41.290.41.486.2]Fig. 3(e). 2
Fig. 3. Time history of ice force, structural displacement, acceleration, and ice displacement with relative 3
displacement at different structural stiffnesses and ice velocities. (a) Test. 63, K=3230 kN m-1, v=0.0411 m s -4
1. (b) Test. 66, K=1710 kN m-1, v=0.0411 m s-1. (c) Test. 67, K=890 kN m-1, v=0.0412 m s-1. (d) Test. 110, K=2700 5
kN m-1, v=0.1031 m s-1. (e) Test. 203, K=1130 kN m-1, v=0.1452 m s-1. 6
4.
PHYSICAL MECHANISM
7
According to the definition from Den Hartog (1947): 8
• In self-excited vibration, the alternating force that sustains the motion is created or controlled by the 9
motion itself. When the motion stops, the alternating force disappears. 10
• In forced vibration, the sustaining alternating force exists independently apart from the motion and 11
persists even when the vibratory motion is stopped. 12
Sodhi (1988) discussed ice-induced vibrations (IIV) as forced vibration because ice force persists when the 13
11 frequency (Neill, 1976, Sodhi and Morris, 1986, Kärnä and others, 1993, Sodhi, 2001). So, the situation will 1
be different if the analysis of ice failure process is restricted to just one single failure cycle, when there is no 2
feedback coming from the structure. There is a time interval after the first amount of ice fails and before 3
another piece of ice approaches, which is a process for ice fragments to be removed. Both Sodhi (1988) and 4
Määttänen (2015) pointed out this process and named “clearing process” and “gap”, respectively, since ice 5
force will vanish if the structure is stopped from moving. Therefore, it is not a forced vibration but self-6
excited vibration in this situation. 7
Depending on the number of ice elements in the system of interest, these two mechanisms can be 8
converted. A similar statement can also be found in Ding (2013). If the studied system is extended to a macro 9
scale, the external excitation caused forced vibration will be converted into the internal excitation that leads 10
to self-excitation vibration, and vice versa. Taking ice as an example, if the ice and structure are coupled as 11
one dynamic system, the IIV should belong to self-excited vibration category. On the contrary, if the structure 12
is isolated from the ice and is considered as one dynamic system, the fluctuating force caused by ice failure 13
would be an external excitation and IIV should be categorised as forced vibration. Therefore, there are 14
internal and external effects from the structure point of view. 15
From the ice point of view, there are internal and external effects too. Internal from ice is the original ice 16
failure characteristic. It is the behaviour under the assumption that ice fails against a theoretically rigid 17
structure, which means there is no vibration or feedback coming from the external structure. But structure 18
does vibrate in real cases. Hence, the structural vibration or oscillation effect is the external effect to the ice 19
failure. Back in numerical modelling, the external effect is represented in the stress variations and the forcing 20
term on the right-hand side of Van der Pol equation. If the stress is a constant and the forcing term is zero, 21
then ice will fail under purely internal effect. Otherwise, relative velocity and relative displacement from 22
structure will be effective in ice failure and lead to different ice force and structural movement behaviours, 23
i.e., the general three responses shown in the Fig. 3(c), 3(d) and 3(e). 24
Further explanations can also be given from the ice point of view in analysing ice failure. If the ice velocity 25
is slow, ice force will drop to almost zero after each failure which means that time interval for clearing 26
process is relatively long. If the velocity increases, the time interval will consequently become shorter. At the 27
intermediate velocity range, ice fails under the structural oscillation effect besides the original failure nature 28
which means that when the structure moves backwards against the ice, compressive stress arises due to 29
external structure feedback and lead to ice deformation and failure more predominantly. 30
4.1 Reasons of lock-in
31
Even though ice force frequency tends to increase with increasing ice velocity, it still locks in around the 32
structural natural frequency because of the external structural oscillation feedback effect and related stress 33
variations. The change of stress depends on the strain, i.e. relative velocity between ice and structure. When 34
the structure and ice move in the same direction during IIV, the relative velocity is low and the value of stress 35
is high. The increasing ice resistance decelerates the structure moving with respect to ice and results in ice 36
failure frequency lagging behind the originally supposed frequency if the structure is considered as rigid 37
without vibration. The lagging frequency is called hysteresis frequency. Once ice failure occurs, ice and 38
structure start moving in opposite directions and the relative velocity becomes high. Hence, low ice stress 39
value reduces the ice resistance and accelerates the structure backwards against ice (Määttänen, 2015) 40
12 frequency than the originally supposed frequency. At the same time, during each interaction with the 1
structure the oncoming ice sheet will also decelerate the structural velocity and raise the stress value 2
because of lower relative velocity. Once the structural deceleration and acceleration oscillation process are 3
in a stable feedback condition when restoring force is equal to the ice force, the structure will be in a self-4
excited oscillation condition. Therefore, the structural natural frequency will be predominant of the 5
oscillation and ice force predominant frequency locks in the structural natural frequency. 6
When ice velocities are above the IIV lock-in range, relative velocity will stay at higher range resulting in very 7
small time interval for the structure to give feedback to ice. Consequently, ice original failure characteristic 8
becomes predominant and ice force frequency will increase with increasing ice velocity. At the same time, 9
the response amplitude is decreasing with lower ice stress leading to the structure vibrating at the natural 10
frequency with small amplitude or even diminish (Huang and others, 2007). 11
4.2 Damping
12
Damping cannot be negligible when the structure is oscillating, especially in IIV. Yue and Guo (2011) and 13
Kärnä and others (2013) noticed that vibrating frequencies during IIV are slightly below the natural frequency. 14
It is the reason when damping force is large compared to the spring or inertia forces that differ from the 15
natural frequency appreciably (Den Hartog, 1947). 16
Mathematically, self-excited vibration occurs when there is an equilibrium between damping energy and 17
external excitation energy during a full cycle of vibration (Ding, 2013) so that the structure vibrates by itself 18
without input from external excitation energy to the mechanical system. In other words, the excitation 19
energy is totally dissipated by damping, i.e. zero net input energy in a cycle of vibration. Therefore, an 20
alternative way of understanding for this mechanism is by adding the negative damping to free vibration 21
(Den Hartog, 1947). It is therefore called “self-excited” because there is no external excitation during a cycle 22
of vibration. 23
Negative damping, in essence, is used as an external source of energy to increase the amplitude of 24
vibration. As the characteristic of decreasing ice stress with increasing loading rate, Blenkarn (1970) 25
proposed ice force as a function of relative velocity and explained the increased vibration amplitude in IIV 26
as negative damping theory: 27
( )
MX CX K+ + X =F v−X (5)
28
For small motions, forcing term can be written as: 29
( )
( X) ( ) X F v
F v F v
v
∂
− = −
∂ (6)
30
Hence, (5) becomes: 31
( F) ( )
MX C X KX F v
v
∂
+ + + =
∂ (7)
32
Sodhi (1988) expressed some disagreement even though he thought negative damping was realistic under 33
some conditions. General reason was that the forcing term was not only controlled by relative velocity but 34
13 velocity needs to be justified. Because of this reason relative displacement effect is also considered in the 1
current numerical model during ice force calculation. As Sodhi mentioned, a plot of ice force vs. relative 2
velocity can be more persuasive. For instance, Fig. 4 is the result from Test. 110 in which ice force can be 3
taken as a function of relative velocity. It is clear that the slope, ∂F/∂vr, is sometimes positive and 4
sometimes negative. The negative value can lead to net negative damping in (7) which will then lead the 5
system to unstable condition. The blue line is the first cycle of loading which has higher negative slope 6
comparing with other stable conditions such as the red line in a cycle of “spike” like ice loading under steady-7
state vibration and others in black dashed lines. 8
[image:13.595.116.478.193.497.2]9
Fig. 4. Relative velocity vs. ice force in four seconds (black dashed): the first cycle of loading (blue) and “spike” 10
like loading (red). 11
4.3 Energy conservation
12
It is certain that energy is always conservative during ice-structure interaction process. The ultimate reason 13
of increased structural vibration is due to more net energy input to structure. Force increases when “negative 14
damping” occurs and more energy transmits into the structure leading to increased vibration amplitude (Den 15
Hartog, 1947). Note that the negative damping proposed by Blenkarn (1970) is actually moving the external 16
structural velocity related forcing term from the right-hand side of the equation of motion to the left-hand 17
side. 18
Sodhi (1991a) presented further evidence that there is no real negative damping based on his 19
experimental results given in Sodhi (1991b). Instead, he found that the cumulative work done by the indenter 20
is a non-decreasing function. According to the first law of thermodynamics, frictional and damping force of 21
14 work. In the present model, the energy relationship satisfies the following equation during the interaction 1
process: 2
t m d
W E E
Δ =Δ +Δ (8)
3
where
Δ
W
t is the incremental work done by ice,Δ
E
mis the incremental change of mechanical energy in 4the structure and
Δ
E
dis the incremental heat dissipated by the structural damping since friction between 5ice and structure is not considered in the model. The incremental change of mechanical energy in the 6
structure can be written as 7
m p k
E E E
Δ =Δ +Δ (9)
8
where ΔEp and ΔEk are the incremental change of potential energy and kinetic energy in the structure, 9
respectively. The computation of
Δ
W
t between any two instants of time is through multiplying the average 10force by the corresponding incremental structural displacement, i.e. F XΔ . The change of kinetic energy 11
and potential energy are obtained from 0.5M XΔ 2 and 0.5K XΔ 2, respectively. The energy dissipated due to 12
damping can be computed from (8). The cumulative form and integral form of (8) and (9) are 13
t d
W PE KE E
ΣΔ = + +ΣΔ (10)
14
0 0 0 0
T T T T
d
FdX = KXdX + MXdX + dE
∫
∫
∫
∫
(11)15
Each parameter in (10) is shown in Fig. 5 at four different tests such as total cumulative energy done by 16
ice force (ΣΔWt) in red, potential energy (PE) in purple, kinetic energy (KE) in green, mechanical energy 17
of the structure (PE KE+ ) in black, and dissipated energy due to damping (ΣΔEd) in blue. It can be noticed 18
that most of the energy arises from ice force dissipated by the damping of structure which is different from 19
what Sodhi (1991a) found, i.e. energy supplied by carriage was dissipated mostly by the indenter. Because 20
in the tests of Sodhi (1991b), an indenter, i.e. structure, was attached to a carriage to move against the ice 21
in a basin. To simplify the modelling and understanding, ice is moving towards the structure in the current 22
numerical model. Therefore, subtracting the work done by carriage from indenter in the experiment is the 23
same work done by the ice force in the present model. 24
According to the numerical results, there are three different energy exchange characteristics because of 25
three different types of ice-structure interactions at different ice velocities which capture the general similar 26
pattern with those in Sodhi (1991a). Fig. 5(a) and 5(b) show the failure under intermittent crushing. During 27
each cycle of loading, the structure moves with the increasing force, resulting in large displacement but 28
relatively small velocity of the structure. Energy supplied by ice is mostly stored in the structural spring. After 29
the failure of ice, the stored potential energy is then transferred to kinetic energy leading to the backwards 30
movement of the structure and extrusion of ice. Damping mechanism consumes the energy all the time 31
when the velocity of the structure increases and reaches a balance condition with the energy from ice force 32
at the end of each cycle of ice failure. Fig. 5(c) shows the energy exchange at steady-state vibration. From 33
the enlarged detail of the dashed box, it can be seen that potential and kinetic energy are in a sinusoidal 34
exchange relationship similar to what Sodhi (1991a) found. After the first few cycle of loading, the energy 35
15 crushing at high velocity, as shown in Fig. 5(d), most of the mechanical energy are in the form of potential 1
energy remaining at around a constant and kinetic energy remains at almost zero. Because the structure is 2
pushed by ice to a relatively static position, it vibrates at much lower amplitude. 3
[image:15.595.52.544.108.492.2]4
Fig. 5. Time vs. total energy (red), potential energy (purple), kinetic energy (green), mechanical energy (black) 5
and damping energy (blue) at different test configurations. (a) Test. 67, K=890 kN m-1, v=0.0412 m s-1. (b) 6
Test. 63, K=3230 kN m-1, v=0.0411 m s-1. (c) Test. 110, K=2700 kN m-1, v=0.1031 m s-1. (d) Test. 203, K=1130 7
kN m-1, v=0.1452 m s-1. 8
4.4 Stress and force variations
9
Since 0.0412 m s-1 and 0.1452 m s-1 in Sodhi (1991b) was defined as intermediate and high velocity, 10
respectively, estimated range of ice velocity at the test condition is between 0.01 m s-1 and 0.165 m s-1 11
approximately. Five sets of tests for the configurations in Table 1 were conducted except that ice velocities 12
were used from 0.01 m s-1 to 0.165 m s-1 at 0.005 m s-1 intervals. Histograms of time history plotting of stress 13
values and ice force values in each set of tests show similar pattern with each other as the ice velocity 14
increases. Two sets of tests, Test. 67 and Test. 110, are chosen as shown in Fig. 6(a) and Fig. 6(b), respectively. 15
During each 0.005 m s-1 ice velocity, time history plotting of stress and ice force points are counted and 16
accumulated at 0.725 MPa and 0.5 kN intervals, i.e. 0.3625 MPa and 0.25 kN from both sides of each 17
histogram, respectively. Ranges of stress and force are determined by the minimum and maximum values of 18
16 accumulated amplitude in each set of tests. Stress variations show a trend from low velocity high stress to 1
high velocity low stress. Ice force variations show a concentration at around intermediate velocities range, 2
i.e. IIV range, which means there is more integral of force over the same time interval, i.e. impulse energy, 3
applied to increase the momentum of the structure. This situation occurs at the condition when stress values 4
are relatively evenly distributed. These patterns may be worthwhile to be noticed from an energy 5
conservation point of view. 6
7
Fig. 6(a). 8
9
[image:16.595.41.555.151.686.2]Fig. 6(b). 10
Fig. 6. Histogram of stress and ice force variations at different ice velocities (a) Test. 67, K=890 kN m-1. (b) 11
17
4.5 Type of vibration
1
It is debatable that whether IIV is forced vibration from resonance or self-excited vibration from negative 2
damping as introduced earlier. One thing is certain that forced vibration does not need an initial condition. 3
However, self-excited vibration needs to be trigged by forced vibration and it needs energy from an external 4
source to sustain (Den Hartog, 1947). 5
No matter which type of vibration, both of them has the following relationship, fi = =fs fn, in which 6
frequency of ice force, structural displacement and structural natural frequency are all equal. Commonly 7
speaking, resonance is a special type of forced vibration which occurs when the external excitation frequency 8
is equal to the structural natural frequency. For instance, making one fork to vibrate first will cause another 9
identical fork to automatically vibrate. So, it is controlled by the external source. If the excitation frequency 10
is different from the structural natural frequency, resonance will disappear. On the other hand, in self-11
excited vibration, vibrating frequency is equal to the natural frequency and the exciting force should be a 12
function of the motion variables, such as displacement, velocity or acceleration (Rao, 2004). 13
In IIV, vibration is self-excited predominantly because feedback from external structure makes more effect 14
on ice failure and ice will affect the structure in return, like lock-in phenomenon. The reason of the increased 15
vibration amplitude can be explained by the “negative damping” theory in an alternative way by keeping in 16
mind that the damping is not negative in reality. The increased vibration is attributed to more energy into 17
the structure when there is higher ice force and the stress value is concentrated mainly in the higher range 18
of stress values. 19
For vibrations below and above the IIV range, structure vibrates at forced vibration mechanism 20
predominantly because the time interval between each cycle of vibration is so short that there is no time for 21
the structure to give feedback to ice. So, the internal ice failure characteristic makes more effect with lower 22
stress and ice force. 23
4.6 Friction-induced vibration
24
Frictional force is another important effect that builds up the ice force characteristic. With the formation of 25
micro cracks inside ice when it is interacting with structure, the static ice force is building up at the same 26
time with the trend of sliding up and down motion along the vertical direction of interaction surface. Ice 27
failure occurs when the crack propagates till a certain level that cannot hold the force perpendicular to the 28
interaction surface. At the same time, the maximum static frictional force along the vertical direction of 29
interaction surface is reached. 30
After the failure, ice force shows a typical transition instant from static friction to kinetic friction, which 31
can be found at all ice velocity ranges in the tests from Sodhi (1991a), such as the creep deformation at very 32
low ice velocity in Test. 64, the extrusion phase at intermittent crushing under intermediate velocity in Test. 33
204 and transition from intermittent crushing to continuous crushing at high velocity in Test. 206. 34
Sodhi (1991b) found that effective pressure during continuous crushing is in an order of magnitude lower 35
than the peak pressure during intermittent crushing from both full-scale and small-scale experiments. It can 36
also be explained that kinetic friction occurs at higher velocities leading to much lower pressure. Sukhorukov 37
(2013) found that the mean value of static and kinetic friction coefficients of ice on steel are 0.50 and 0.11 38
on dry surface, and 0.40 and 0.09 on wet condition, respectively, as shown in Table. 2, where
µ
s andµ
kare18 the static and kinetic friction coefficients, respectively. Although values of steel on ice have lower static 1
[image:18.595.41.342.107.209.2]friction coefficient, they are still much higher than the kinetic friction coefficients. 2
Table 2. Static and kinetic friction coefficients from ice-steel experiments (Sukhorukov, 2013). 3
Sliding
configuration Surface condition
µ
sµ
kIce on steel Dry 0.50 ± 0.12 0.11 ± 0.02 Ice on steel Wet 0.40 ± 0.05 0.09 ± 0.02 Steel on ice Dry 0.43 ± 0.09 0.12 ± 0.03 Steel on ice Wet 0.36 ± 0.09 0.13 ± 0.04
Ice stress variations in IIV is very similar to frictional coefficient variations in friction-induced vibration 4
when considering relative velocity only as shown in the three-region Stribeck curve in Fig. 7. A typical 5
example is the self-excited vibration of a bowed violin string. The bow and string are moving in the same 6
direction at first when the bow drags the string aside. The coefficient of friction is high because relative 7
velocity is low and potential energy is storing in the string. When the maximum static force cannot hold the 8
restoring force from string, the string will slip back releasing the energy to kinetic energy in the form of 9
backward velocity. The decrease in coefficient of friction yields lower frictional force, which will then 10
accelerate the velocity further to a certain level. However, the coefficient will raise again due to the 11
coefficient curve shown in Fig. 7 and the system will be in a stable feedback condition when restoring force 12
is equal to the frictional force. Less energy is lost than the input at first and the difference is enough to 13
overcome the damping and sustain the vibration (Schmitz and Smith, 2011), like the energy exchange in 14
steady-steady state shown in Fig. 5(c). The sound of vibrations is produced at its natural frequency since it 15
determines the restoration of the string. 16
17
Fig. 7. Stribeck curve. 18
Sliding velocity
Co
ef
fic
ie
nt
o
f f
ric
tio
[image:18.595.52.346.449.678.2]19
5.
CONCLUSIONS
1
To obtain the effect of velocity and structural natural frequency (structural stiffness) on ice failure, an 2
extended model based on the previous work of Ji and Oterkus (2016) was developed. A series of validation 3
cases were conducted and compared with the results from Sodhi (1991b) which show the typical three kinds 4
of response; intermittent crushing, lock-in and continuous crushing and both numerical and experimental 5
results are in a good agreement with each other. 6
Physical mechanism during ice-structure interaction process under different velocities were discussed 7
based on the general branch of feedback mechanism and energy mechanism, respectively. Internal effect 8
and external effect from ice and structure were both explained in the feedback branch. Energy exchanges of 9
each type of energy were reproduced and coincided with analyses in Sodhi (1991a). 10
Reasons of the increased vibration amplitude during IIV and lock-in were presented and discussed starting 11
from the disagreement between Sodhi and Määttänen and analyses were given from both perspectives. In 12
addition, a study on the stress and force variations in full range of velocities showed that there was more 13
impulse energy during IIV range which can be an explanation for the increased vibration amplitude from the 14
energy point of view. 15
IIV is in a resonant type of self-excited vibration because the structural effect is more predominant. Even 16
though negative damping is not negative in reality, it can be used to explain the self-excited vibration in an 17
alternative way. A general conclusion on the predominant type of vibration during the interaction process is 18
forced, self-excited and forced in each three types of responses. 19
Similar variations between ice stress and coefficient of friction shows that there is a likelihood to use static 20
and kinetic friction force to explain the pressure difference at high and low velocities as well as the unstable 21
and stable conditions during ice-induced vibration. 22
REFERENCES
23
Blenkarn, K (1970) Measurement and analysis of ice forces on Cook Inlet structures. Offshore Technology Conference, 24
Offshore Technology Conference. 25
Den Hartog, J (1947) Mechanical Vibrations. 3rd ed.New York, McGraw-Hill. 26
Ding, W (2013) Self-Excited Vibration: Theory, Paradigms, and Research Methods. Springer Science & Business Media. 27
Huang, Y, Shi Q and Song A (2007) Model test study of the interaction between ice and a compliant vertical narrow 28
structure. Cold Regions Science and Technology, 49(2): 151-160. 29
Ji, X and Oterkus E (2016) A dynamic ice-structure interaction model for ice-induced vibrations by using van der pol 30
equation. Ocean Engineering, 128: 147-152. 31
Kärnä, T, Andresen H, Gurtner A, Metrikine A, Sodhi D, Loo M, Kuiper G, Gibson R, Fenz D and Muggeridge K (2013) 32
Ice-Induced Vibrations of Offshore Structures–Looking Beyond ISO 19906. 22nd International Conference on Port and 33
Ocean Engineering Under Arctic Conditions (POAC), Espoo, Finland, 1673-1684. 34
Kärnä, T, Muhonen A and M. S (1993) Rate effects in brittle ice crushing. Conf. Port Ocean Eng. under Arctic Conditions. 35
(POAC´93), Hamburg, 59-71. (2). 36
Kry, PR (1981) Scale effects in continuous crushing of ice. Proceedings of the Fifth International Association Hydraulic 37
Research Symposium on Ice Problems, 27-31. 38
Määttanen, M (1975) Experiences of ice forces against a steel lighthouse mounted on the seabed, and proposed 39
constructional refinements. Proc. of the Third Int. Conf. on Port and Ocean Engineering under Arctic Conditions POAC, 40
Fairbanks. 41
Määttänen, M (2015) Ice induced frequency lock-in vibrations - Converging towards consensus. Proceedings of the 42
20 Michel, B and Toussaint N (1978) Mechanisms and theory of indentation of ice plates. Journal of glaciology, 19: 285-1
300. 2
Neill, CR (1976) Dynamic ice forces on piers and piles. An assessment of design guidelines in the light of recent research. 3
Canadian Journal of Civil Engineering, 3(2): 305-341. 4
Palmer, A, Goodman D, Ashby M, Evans A, Hutchinson J and Ponter A (1983) Fracture and its role in determining ice 5
forces on offshore structures. Annals of glaciology, 4: 216-221. 6
Peyton, HR (1966) Sea ice forces. Ice pressures against structures, 117-123. 7
Rao, SS (2004) Mechanical vibrations. India,Upper Saddle River: Pearson Education. 8
Schmitz, TL and Smith KS (2011) Mechanical vibrations: modeling and measurement. Springer Science & Business 9
Media. 10
Sodhi, DS (2001) Crushing failure during ice–structure interaction. Engineering Fracture Mechanics, 68(17): 1889-1921. 11
Sodhi, DS (1998) Nonsimultaneous crushing during edge indentation of freshwater ice sheets. Cold Regions Science 12
and Technology, 27(3): 179-195. 13
Sodhi, DS (1994) A theoretical model for ice-structure interaction. 12th International symposium on ice, IAHR 94, 14
Trondheim; Norway, 807-815. 15
Sodhi, DS (1991a) Energy exchanges during indentation tests in fresh-water ice. Annals of Glaciology, 15: 247-253. 16
Sodhi, DS (1991b) Ice-structure interaction during indentation tests. Ice-structure interaction,Springer, 619-640. 17
Sodhi, DS (1988) Ice-induced vibrations of structures. Proceedings of the Ninth International Association of Hydraulic 18
Engineering and Research Symposium on Ice, 625-657. 19
Sodhi, DS and Haehnel RB (2003) Crushing ice forces on structures. Journal of cold regions engineering, 17(4): 153-170. 20
Sodhi, DS and Morris CE (1986) Characteristic frequency of force variations in continuous crushing of sheet ice against 21
rigid cylindrical structures. Cold Regions Science and Technology, 12(1): 1-12. 22
Sodhi, DS and Nakazawa N (1990) Frequency of intermittent ice crushing during indentation tests. Proc. 10th IAHR 23
Symposium on Ice, 277-290. 24
Sukhorukov, S (2013) Ice-Ice and Ice-Steel Friction in Field and in Laboratory. (Doctor Norwegian University of Science 25
and Technology.) 26
Yue, Q and Guo F (2011) Physical Mechanism of Ice-Induced Self-Excited Vibration. Journal of Engineering Mechanics, 27
138(7): 784-790. 28