pharmaceutics
Article
Comparative Analysis of Protein Quantification
Methods for the Rapid Determination of Protein
Loading in Liposomal Formulations
Maryam T. Hussain†, Neil Forbes†and Yvonne Perrie *
Strathclyde Institute of Pharmacy and Biomedical Sciences, University of Strathclyde, Glasgow G4 0RE, UK; [email protected] (M.T.H.); [email protected] (N.F.)
* Correspondence: [email protected]; Tel.: +44-414-548-2244 † These authors contributed equally to this work.
Received: 23 November 2018; Accepted: 9 January 2019; Published: 18 January 2019
Abstract: Advances in manufacturing processes provide the ability for the high throughput production of liposomes containing a range of moieties, from small molecules to large biologicals (including proteins and nucleic acids for prophylactic and therapeutic applications). Whilst rapid quantification methods for small molecules are generally well established, the ability to rapidly quantify liposomal entrapment of proteins is limited. Indeed, most standard protein quantification techniques (including the BCA assay and Reverse phase-high performance liquid chromatography (RP-HPLC)) measure protein encapsulation indirectly, by measuring the amount of non-incorporated drug, and subtracting from the initial amount of protein added. However, this can give inaccurate and misrepresentative results. To address this, we have developed a range of methods to directly quantify protein entrapment within liposomes. The encapsulation efficiency within neutral, anionic and cationic liposome formulations was determined by three techniques; BCA assay, RP-HPLC and HPLC coupled to an evaporative light scattering detector, (HPLC-ELSD). All three methods are reliable for the quantification of protein, with linear responses and correlation coefficients of 0.99, and LOQ for all three methods being less than 10µg/mL. Here within, we provide three methods for the rapid and robust quantification of protein loading within liposomal (and other bilayer) vesicle systems.
Keywords:microfluidics; liposome; solubilisation; protein quantification; reverse-phase-high performance liquid chromatography (RP-HPLC); HPLC-evaporative light scattering detector (HPLC-ELSD)
1. Introduction
Liposomes are well recognised for their efficacy in drug delivery, with a growing interest within the field of vaccine development [1,2]. The delivery and appropriate targeting of subunit antigens or highly purified protein recombinants as vaccines can be enhanced by incorporating antigens with a suitable delivery system, particularly for routes of administration that pose challenges for the stability of the proteins such as the oral, intranasal or pulmonary [3]. Liposomes are a well-established drug delivery system, and their use as a delivery vehicle for proteins and peptides, in particular for the delivery of vaccines, is widely reported [4–6]. However, until recently, the manufacture of liposomal delivery systems has presented a notable barrier in the translation from bench to product [7]. For example, marketed products, such as the Doxil/Caelyx liposomal formulation, requires time consuming, multi-step procedures [8], which incurs high economic costs. However, with an increased interest surrounding novel technologies that use microfluidics to produce liposomal vesicles [7,9–11], industrial scale production of liposomes is now much more applicable. Given this rise in high-throughput manufacturing techniques for liposomal delivery vehicles, as well as their
Pharmaceutics2019,11, 39 2 of 16
growing use as vaccine delivery systems, there remains a need for rapid analytical techniques for the quantification of protein loading within liposomal delivery systems [12].
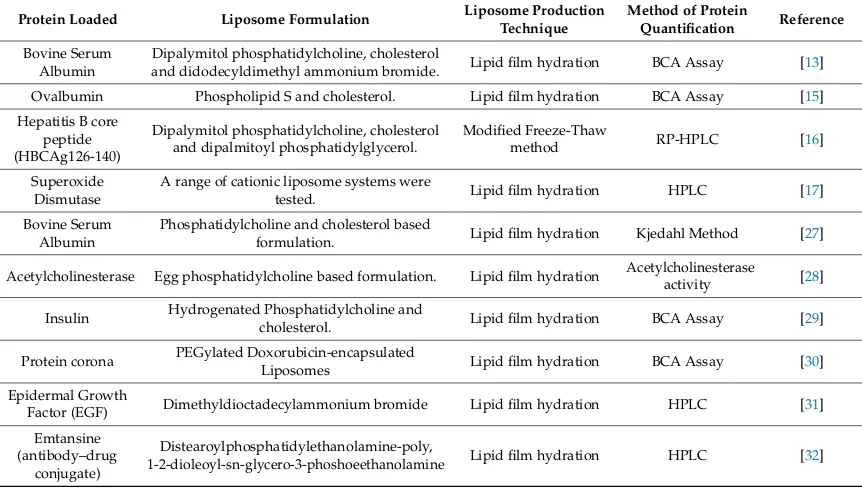
Currently, there are a range of techniques available to quantify the protein loading capacities of drug delivery systems (Table1) [13–19]. Protein quantification techniques can include bicinchoninic acid assay (BCA), variations of high-performance liquid-based chromatography (HPLC) and the use of fluorescently labelled or radio-chemically labelled proteins. Less novel chemical analytical techniques also include the use of the Kjeldahl method to determine the nitrogen content in organic substances. The BCA assay uses peptide bonds in the protein reducing Cu2+to Cu+at a rate proportional to the amount of protein present. The bicinchoninic acid reagent then binds with the Cu+, forming a complex which absorbs light around 562 nm wavelength, allowing a direct correlation between protein concentration within a sample and absorbance to be made [20]. Whilst the BCA assay can be utilised for large sample screening given the microplate setup, limitations still exist involving interference from a range of agents, including lipids. Other high throughput methods, such as HPLC, can be used to quantify protein, with many variations of HPLC techniques available [21,22], including reverse phase (RP) HPLC, which is commonly used for protein analysis. Although RP-HPLC and the BCA assay are readily available to most analytical laboratories [23], the use of HPLC-evaporative light scattering detector (HPLC-ELSD) is a good alternative for when the active pharmaceutical ingredient does not have a chromophore, or for impurity analysis [24]. Previous papers from our group have shown the ability to quantify lipids using an HPLC-ELSD system [25], and it is reported to detect analytes at high sensitivity rates [26].
However, despite these available methods, routinely the encapsulation efficiency within liposomes is determined indirectly by measuring the free un-encapsulated protein following separation via, i.e., centrifugation, dialysis or chromatography. This presents major issues, given it involves the assumption that all of the protein not measured is associated with the delivery vesicles and assumes mass balance is achieved. Therefore, to address this and better support the formulation and development of liposomal protein delivery systems, we have compared the ability of three techniques (BCA, RP-HPLC and HPLC-ELSD) to directly quantify encapsulated protein within liposomal delivery vesicles.
2. Materials and Methods
2.1. Materials
The lipids 1,2-distearoyl-sn-glycero-3-phosphocholine (DSPC), 1,2-dioleoyl-3-trimethylammonium-propane (DOTAP) and L-α-phosphatidylserine (Brain PS, Porcine) were all purchased from Avanti Polar Lipids Inc., Alabaster, AL, US. Cholesterol (cholesterol), Ovalbumin (OVA), trifluoroacetic acid and D9777-100ft dialysis tubing cellulose were purchased from Sigma Aldrich Company Ltd., Poole, UK. A Jupiter column (C18 (300 Å), 5µm, dimensions 4.60×150 mm pore size 100 Å) was used in HPLC and purchased from Phenomenex., Macclesfield, UK. The Pierce™ micro BCA Protein Assay kit, HPLC grade methanol and 2-propanol were purchased from Fisher Scientific, Loughborough, England, UK. All water and solvents used were HPLC grade.
2.2. Methods
2.2.1. Protein Quantification Techniques
Pharmaceutics2019,11, 39 3 of 16
Table 1.Examples of methods used to quantify protein loading in liposomal formulations.
Protein Loaded Liposome Formulation Liposome Production Technique
Method of Protein
Quantification Reference
Bovine Serum Albumin
Dipalymitol phosphatidylcholine, cholesterol
and didodecyldimethyl ammonium bromide. Lipid film hydration BCA Assay [13]
Ovalbumin Phospholipid S and cholesterol. Lipid film hydration BCA Assay [15]
Hepatitis B core peptide (HBCAg126-140)
Dipalymitol phosphatidylcholine, cholesterol and dipalmitoyl phosphatidylglycerol.
Modified Freeze-Thaw
method RP-HPLC [16]
Superoxide Dismutase
A range of cationic liposome systems were
tested. Lipid film hydration HPLC [17]
Bovine Serum Albumin
Phosphatidylcholine and cholesterol based
formulation. Lipid film hydration Kjedahl Method [27]
Acetylcholinesterase Egg phosphatidylcholine based formulation. Lipid film hydration Acetylcholinesteraseactivity [28]
Insulin Hydrogenated Phosphatidylcholine andcholesterol. Lipid film hydration BCA Assay [29]
Protein corona PEGylated Doxorubicin-encapsulated
Liposomes Lipid film hydration BCA Assay [30]
Epidermal Growth
Factor (EGF) Dimethyldioctadecylammonium bromide Lipid film hydration HPLC [31]
Emtansine (antibody–drug
conjugate)
Distearoylphosphatidylethanolamine-poly,
1-2-dioleoyl-sn-glycero-3-phoshoeethanolamine Lipid film hydration HPLC [32]
BCA: bicinchoninic acid assay; RP-HPLC: reverse –phase high performance liquid chromatography; HPLC: high performance liquid chromatography.
For ELSD, HPLC was used in conjunction with a SEDEX 90LT evaporative light scattering detector (ELSD) (Sedex sedere, Alfortville, France) for OVA quantification. A Jupiter A100 column was used to detect the OVA protein. The flow rate used was 1 mL/min, with a gain of 8 and an OVA peak appearing at 11.8 min. A standard calibration curve for OVA was established using various concentrations; the amount of encapsulated OVA in liposomes was calculated using the peak area of the sample in relation to the standards.
Protein quantification using Micro BCA (Pierce™ BCA Protein Assay Kit, Sigma Aldrich, Poole, UK) protein assay was carried out under manufacturer’s instructions. Briefly, samples were incubated up to 2 h at 35◦C, with 150µL of sample + 150µL of the working reagent. Absorbance was then measured at 562 nm using a Bio-rad 680 microplate reader.
2.2.2. Liposome Manufacture and Purification
The preparation of liposomes by microfluidics was conducted on the Nanoasemblr®Benchtop system from Precision Nanosystems. Selected lipids were dissolved in methanol at specific concentrations (ranging primarily between 0.1–4 mg/mL total lipid) and injected through one of the two inlets on the microfluidics herringbone micromixer chip, whilst the aqueous phase, PBS; pH 7.3±0.2 or TRIS (pH 7.4) is injected into the second inlet. A flow rate ratio (FRR; the ratio between the aqueous phase and the lipid phase) of 3:1 was selected for neutral and anionic liposomal formulations, while 1:1 FRR was selected for cationic formulations. Total flow rates (TFR) (the speed at which the two inlets are injected through the chip) between 10–15 mL/min were selected. For OVA loaded liposomal samples, OVA is added in the aqueous phase at specific concentrations and the same principles for the production of empty liposomes was followed.
Following microfluidic production of liposomes, purification of solvent from the sample is required. For “empty” liposomes, dialysis was conducted usingMw14,000 Da membrane, where 1 mL
Pharmaceutics2019,11, 39 4 of 16
any trace of pre-treated solution and stored in 20% ethanol (EtOH). For purification of OVA loaded liposomes, samples were purified using Krosflo Research Iii tangential flow filtration system fitted with an mPES (modified polyethersulfone) column with a pore size of 750 kDa to support effective separation of the protein (OVA; 45 kDa) and the liposomes. Liposomal samples were circulated through the column and purified through difiltration, with fresh PBS being added at the same rate as the permeate leaving the column.
2.2.3. Method Validation
Linearity was assessed by the design of calibration curves across ovalbumin concentrations. The signal output (Area (mAU), Area (mV) and absorbance for RP-HPLC, ELSD-HPLC and BCA respectively) was plotted against known concentrations to determine the equation of the straight line and regression coefficient (R2).
Limit of detection (LOD) and limit of quantification (LOQ) were calculated using the following Equations (1) and (2). The standard deviation of the response (σ), divided by the gradient of the slope, multiplied by 3.3 or 10 (LOD and LOQ, respectively) [33,34].
LOD=3.3×(σ S)
(1)
LOQ=10×(σ S)
(2)
Accuracy (trueness) was calculated using the difference between theoretical and experimental values, taken at three separate concentrations across the assay in triplicate using a low, medium and high concentration value [22,33]. The accuracy can be defined as the closeness of agreement between the mean and the accepted true value together with confidence values [33].
Accuracy= (True Value−measured value)×100
True Value (3)
Intra-day Precision (Repeatability) is an expression of the closeness of values taken under the same experimental conditions, over a short period of time (the same day). Inter-day Precision (Intermediate Precision) was determined over 3–5 separate days. Results are expressed as %RSD using a minimum of nine determinations (three concentrations: low, medium and high, three replicates of each).
%RSD=
Standard deviation mean
×100 (4)
2.2.4. Statistical Analysis
Results are represented as mean±SD withn= 3 independent batches. ANOVA tests were used to assess statistical significance (pvalue of less than 0.05), with a Bland and Altman method used to assess the agreeability between the three quantification methods. The mean difference, along with the standard deviation, was calculated with a 95% confidence interval.
3. Results
PharmaceuticsPharmaceutics 2019,201911, 39, 11, x FOR PEER REVIEW 6 of 17 5 of 16
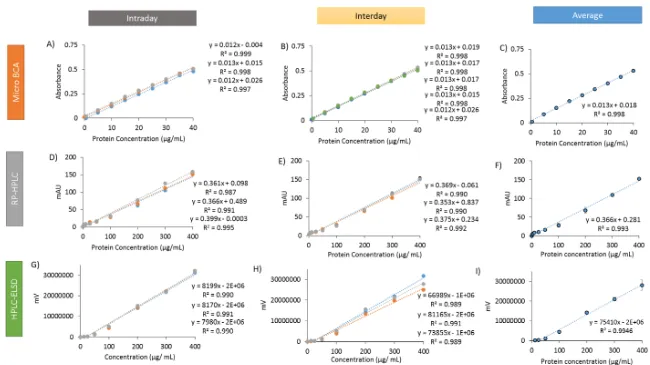
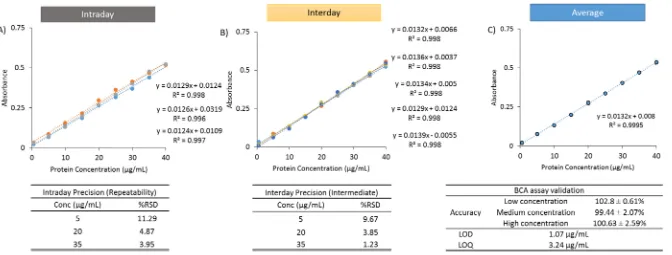
[image:5.842.96.746.85.450.2]Figure 1. Ovalbumin calibration curves for three quantification techniques. The calibration curves for micro BCA (A–C) include: Intraday curves (A), Interday curves (generated over 5 separate days) (B), alongside the average (C). Calibration curves were also generated for RP-ELSD (D–F), including: Intraday curves (D), Interday curves (generated over 3 separate days) (E), as well as the average (F). The same was also generated for the HPLC-ELSD (G–I): Intraday curves (G), Interday curves (H), and the average (I). Results represent the average of at least three replicate measurements ± standard deviation (SD).
Pharmaceutics2019,11, 39 6 of 16
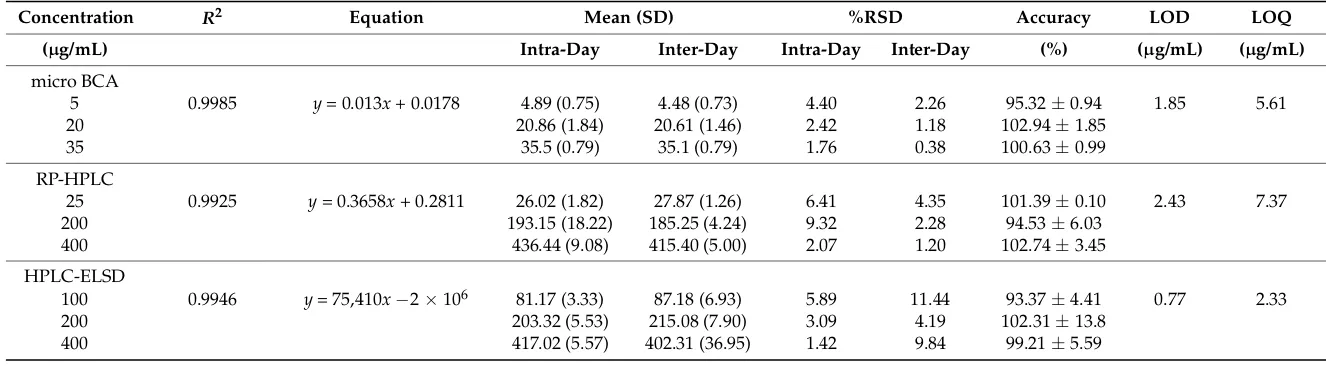
Table 2. A comparison of three protein quantification techniques; micro BCA, RP-HPLC, and HPLC-ELSD. For all three methods, the accuracy was determined at three concentrations, while Intra-day and Inter-day precision was calculated across three different concentrations with %RSD shown. The LOD and LOQ were also determined for the respective quantification techniques. Results represent the average of at least three replicate measurements±standard deviation (SD).
Concentration R2 Equation Mean (SD) %RSD Accuracy LOD LOQ
(µg/mL) Intra-Day Inter-Day Intra-Day Inter-Day (%) (µg/mL) (µg/mL)
micro BCA
5 0.9985 y= 0.013x+ 0.0178 4.89 (0.75) 4.48 (0.73) 4.40 2.26 95.32±0.94 1.85 5.61
20 20.86 (1.84) 20.61 (1.46) 2.42 1.18 102.94±1.85
35 35.5 (0.79) 35.1 (0.79) 1.76 0.38 100.63±0.99
RP-HPLC
25 0.9925 y= 0.3658x+ 0.2811 26.02 (1.82) 27.87 (1.26) 6.41 4.35 101.39±0.10 2.43 7.37
200 193.15 (18.22) 185.25 (4.24) 9.32 2.28 94.53±6.03
400 436.44 (9.08) 415.40 (5.00) 2.07 1.20 102.74±3.45
HPLC-ELSD
100 0.9946 y= 75,410x−2×10⁶ 81.17 (3.33) 87.18 (6.93) 5.89 11.44 93.37±4.41 0.77 2.33
200 203.32 (5.53) 215.08 (7.90) 3.09 4.19 102.31±13.8
Pharmaceutics2019,11, 39 7 of 16
3.1. Ovalbumin Quantification via Micro BCA Assay
Calibration curves were generated by micro BCA analysis across a concentration range of 0.5–40µg/mL (Figure1A–C). A linear relationship was observed as expected (R2values > 0.997), with
Figure1A showing the intra-day repeatability, Figure1B showing inter-day precision and Figure1C showing the average. The LOD and LOQ were 1.85µg/mL and 5.61µg/mL, respectively (Table2). Intra-day repeatability and inter-day precision (over five independent days) was calculated at low (5µg/mL), medium (20µg/mL) and high (35µg/mL) concentrations. At each concentration, the mean value and the % RSD was calculated. At each concentration, both intra- and inter-day precision was acceptable, with the %RSD being with±5% (Table2). Accuracy was also calculated across the three concentration ranges, with all determinations falling within an accepted range (95–105%; Table2).
3.2. Ovalbumin Calibration Curves Using RP-HPLC
Using RP-HPLC, a gradient method was used to establish a calibration curve (from 5–400µg/mL) (Figure1D–F). Again a linear relationship was observed ((R2values > 0.987) with good intra-day (Figure1D) and inter-day (Figure1E) reproducibility. Using this method, LOD and LOQ values of 2.43 µg/mL and 7.37µg/mL, respectively, were determined (Table2). Intra-day repeatability and inter-day precision (over five independent days) was calculated at low (25µg/mL), medium (200µg/mL) and high (400µg/mL) concentrations. At each concentration, the %RSD being with±10% (Table2). Accuracy was also calculated across the three concentration ranges, with all determinations falling within an accepted range (95–105%; Table2).
3.3. Ovalbumin Calibration Curves Using HPLC-ELSD
The ELSD was used together with the HPLC to determine if this technique was comparable to the RP-HPLC method. As with the RP-HPLC method, a gradient elution method was used. Calibration curves were established (using the concentration ranges 0–400µg/mL; Figure1G–I). Intra-day and inter-day repeatability curves were again plotted (Figure1G,H), with the regression coefficient greater than 0.989 for all curves (Table2). Using this method, the LOD was 0.77µg/mL and LOQ was 2.33µg/mL. Similar to RP-HPLC, the intra-day and inter-day precision was calculated at low, medium and high concentrations (Table2). Intra-day repeatability RSD values remained within the acceptance criteria (at 5% RSD or below). With inter-day repeatability, the RSD values increased up to 11.44% (Table2). Accuracy of the assay across the concentrations remained within the acceptance criteria, although at the lower concentration of 100µg/mL the accuracy dropped to 93.37±4.41%.
3.4. Liposome Solubilisation and Lipid Interactions
Pharmaceutics2019,11, 39 8 of 16
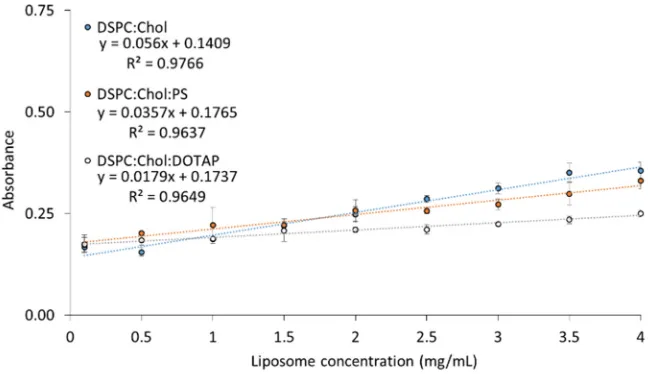
all three formulations showing high degrees of linearity (R2> 0.96). A small gradient for all three formulations can be observed, with lipid concentration having limited impact across the range tested (Figure2). However, the degree of interference varied with formulation, with the cationic liposomal formulation showing the lowest increase over the concentration range tested, whilst the anionic and neutral formulation resulted in higher levels of interference (Figure2).
Pharmaceutics 2019, 11, x FOR PEER REVIEW 8 of 17
3.4. Liposome Solubilisation and Lipid Interactions
[image:8.595.136.460.171.358.2]Given all three methods were shown to effectively quantify protein concentration, the next step was to develop an extraction method for measuring protein within the liposomes and also to consider interference from lipids within the formulation. In order to quantify the amount of entrapped protein inside liposomes, solubilisation of the liposomes was required. To achieve this, a previously reported and validated protocol using isopropanol (IPA):buffer (at a 50/50 v/v) was adopted [35]. To investigate the impact of liposome interference, three formulations were selected. A neutral liposomal formulation (DSPC:Chol), an anionic formulation (DSPC:Chol:PS) and the cationic liposomal formulation (DSPC:Chol:DOTAP). The formulations were prepared by microfluidics at a range of final lipid concentrations (0.1–4 mg/mL). In the case of RP-HPLC, the presence of lipids does not interfere with the quantification of the OVA, but solubilisation of the liposomes is necessary, and thus the IPA:buffer 50:50 v/v was adopted. Due to the nature of the ELSD, the encapsulated OVA can be quantified without solubilisation of the liposomes, and the lipids do not interfere in protein quantification. In the case of the BCA assay, solubilisation of the liposomes is required to release the protein, and the presence of lipids also interferes with the assay. The results in Figure 2 show a gradual increase in absorbance for all three formulations as the concentration increases, with all three formulations showing high degrees of linearity (R² > 0.96). A small gradient for all three formulations can be observed, with lipid concentration having limited impact across the range tested (Figure 2). However, the degree of interference varied with formulation, with the cationic liposomal formulation showing the lowest increase over the concentration range tested, whilst the anionic and neutral formulation resulted in higher levels of interference (Figure 2).
Figure 2. The effect of increasing liposome concentration on micro BCA absorbance with no
ovalbumin added. Three liposomal formulations were produced using microfluidics (FRR 3:1 and 1:1, TFR 10 mL/min), DSPC:Chol, DSPC:Chol:PS and DSPC:Chol:DOTAP and assessed for BCA absorbance interference. Results represent the average of at least three replicate measurements ± standard deviation (SD).
Lipid interference in bicinchoninic acid based assays has been previously shown by Kessler and Fanestil [36]. Therefore, in order to determine whether OVA can be quantified in a linear manner in the presence of liposomes, “empty” DSPC:Chol (10:5 wt/wt, 3:1 FRR, 10 mL/min) liposomes were produced via microfluidics and then mixed with the OVA at a final concentration of 1 mg/mL. Protein concentrations remained fixed as for OVA in water (Figure 1), and the resulting blanks for subtraction consisted of liposomes in water with no OVA present. Figure 3 shows the intra-day repeatability (3 replicates; Figure 3A), the inter-day repeatability (5 days; Figure 3B), and the average of three calibration curves used generated for LOD and LOQ is shown in Figure 3C. All curves generated R² > 0.99, and despite the presence of liposomes in the samples, the LOD and LOQ values following blank subtraction remained low (1.07 and 3.24 µg/mL, respectively), similar to the micro BCA
Figure 2.The effect of increasing liposome concentration on micro BCA absorbance with no ovalbumin added. Three liposomal formulations were produced using microfluidics (FRR 3:1 and 1:1, TFR 10 mL/min), DSPC:Chol, DSPC:Chol:PS and DSPC:Chol:DOTAP and assessed for BCA absorbance interference. Results represent the average of at least three replicate measurements±standard deviation (SD).
Pharmaceutics2019,11, 39 9 of 16
Pharmaceutics 2019, 11, x FOR PEER REVIEW 10 of 17
Figure 3. Ovalbumin calibration curves in water in the presence of liposomes (DSPC:Chol 10:5 wt/wt; at a fixed final concentration of 1 mg/mL). The LOD and LOQ
[image:9.842.91.763.91.346.2]values were established using micro BCA, following empty liposome blank removal. Intraday curves were generated (A) within the same day, while Interday curves were generated over 5 separate days (B) along with the average (C). Accuracy was determined at three concentrations, while Intra-day and Inter-day precision was calculated across three different concentrations, with %RSD shown.
Pharmaceutics2019,11, 39 10 of 16
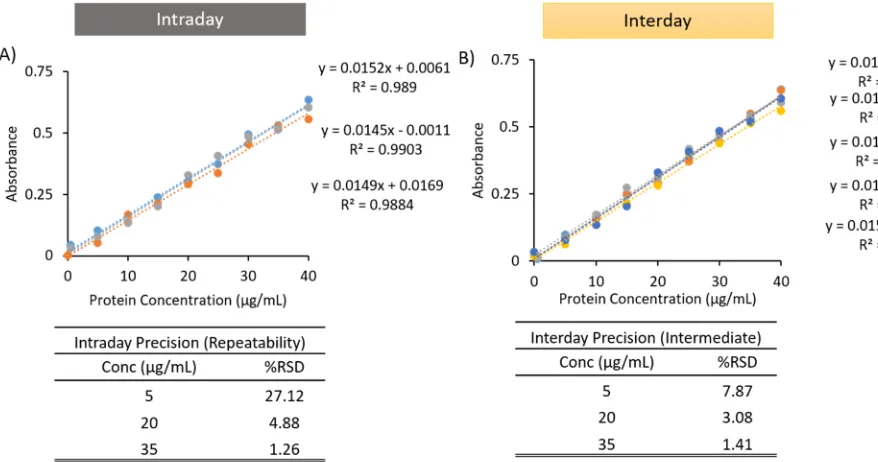
Given the presence of lipid could be accommodated within the assay, the next stage was to determine the protein entrapment efficiency following solubilisation to allow the direct quantification of protein encapsulated within liposomes. Therefore, calibration curves were established (using the same concentration ranges of 0–40µg/mL) to determine whether linearity can be achieved in the presence of solubilisation mixture and liposomes using micro BCA. Figure4shows the intra-day repeatability (3 replicates; Figure4A), the inter-day repeatability (5 days; Figure4B), and the average of three calibration curves used generated for LOD and LOQ is shown in Figure4C. Again, all curves resulted in regression coefficients greater than 0.98. With the presence of the solubilising agent, the LOD and LOQ (2.36 and 7.14µg/mL, respectively) was found to be higher than protein alone (Table2). Intra-day and inter-day repeatability RSD values for both medium and high concentrations remained within the acceptance criteria (5% RSD or below), however, low concentrations of intra-day and inter-day repeatability resulted in a calculated %RSD of 27.12% and 7.87%, respectively (Figure4). Accuracy of the assay at low, medium and high concentrations all remained within the acceptance criteria. With the micro BCA assay, the manufacturers note that if interfering substances cannot be purified, the sample can be diluted down to an acceptable level of interference. In the liposome formulations tested here (and specifically the concentrations used), linearity could be maintained. However, the addition of up to 5% SDS can also be considered if the lipid concentration is high within the sample and a loss of linearity is observed.
3.5. Comparing the Analytical Techniques for the Quantification of OVA Loaded Liposomes
Pharmaceutics2019,11, 39 11 of 16
Pharmaceutics 2019, 11, x FOR PEER REVIEW 11 of 17
Figure 4. Ovalbumin calibration curves in water in the presence of liposomes (prepared as per Figure 3) and the addition of solubilisation mixture (50/50 v/v
IPA/water). The LOD and LOQ values were established using micro BCA. Intraday curves were generated (A) within the same day, while Interday curves were
[image:11.842.89.528.92.323.2]generated over 5 separate days (B) along with the average (C). Accuracy was determined at three concentrations, while Intra-day and Inter-day precision was calculated across three different concentrations with, %RSD shown.
Pharmaceutics2019,11, 39 12 of 16
[image:12.595.103.498.87.330.2]Pharmaceutics 2019, 11, x FOR PEER REVIEW 13 of 17
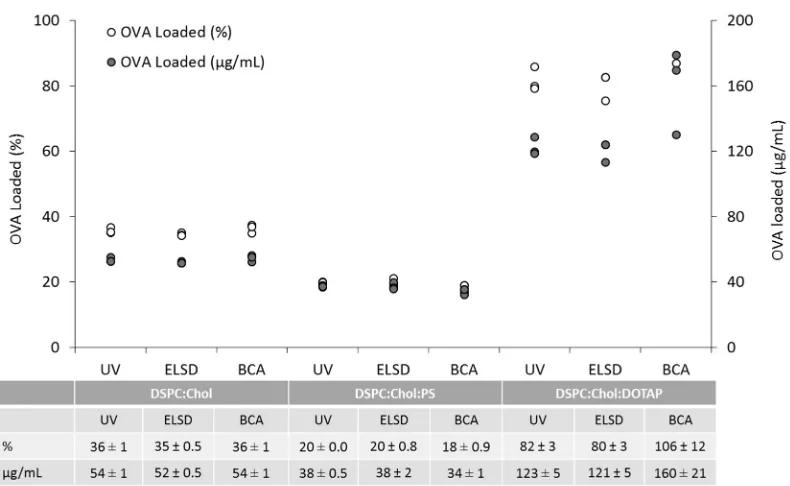
Figure 5. Comparative study between three protein quantification techniques, RP-HPLC,
HPLC-ELSD and BCA assay. All three liposomal formulations were made using microfluidics. The DSPC:Chol and DSPC:Chol:PS formulations were made at a 3:1 FRR and 15 mL/min TFR (4 mg/mL initial lipid and 0.25 mg/mL initial ovalbumin concentration). The DSPC:Chol:DOTAP formulation was produced at a 1:1 FRR, and the ovalbumin was adsorbed onto the surface by passing pre-made DSPC:Chol:DOTAP formulation through the microfluidics NanoAssemblr. All results were measured three times, with the average encapsulation and ovalbumin loading calculated.
.
Figure 6. Bland and Atlman plot analysis for the comparison of three analytical techniques. Plot of differences between three analytical techniques (RP-HPLC, HPLC-ELSD and BCA assay) on the y-axis, versus the mean of the three analytical techniques for the three formulations (DSPC:Chol, DSPC:Chol:PS and DSPC:Chol:DOTAP). The calculated mean is −8.8 (horizontal solid line), with the bias represented by the gap between the mean and the dashed lines. All formulations were measured three times for the encapsulation efficiency, with each measurement plotted.
As the liposomes are a mixture of lipids, cholesterol and protein, the quantification of protein without interference from the lipid components or solubilisation is important. Whilst the lipids do not interfere with the RP-HPLC and HPLC-ELSD techniques, interference is observed from lipids
Figure 5.Comparative study between three protein quantification techniques, RP-HPLC, HPLC-ELSD and BCA assay. All three liposomal formulations were made using microfluidics. The DSPC:Chol and DSPC:Chol:PS formulations were made at a 3:1 FRR and 15 mL/min TFR (4 mg/mL initial lipid and 0.25 mg/mL initial ovalbumin concentration). The DSPC:Chol:DOTAP formulation was produced at a 1:1 FRR, and the ovalbumin was adsorbed onto the surface by passing pre-made DSPC:Chol:DOTAP formulation through the microfluidics NanoAssemblr. All results were measured three times, with the average encapsulation and ovalbumin loading calculated.
Pharmaceutics 2019, 11, x FOR PEER REVIEW 13 of 17
Figure 5. Comparative study between three protein quantification techniques, RP-HPLC,
HPLC-ELSD and BCA assay. All three liposomal formulations were made using microfluidics. The DSPC:Chol and DSPC:Chol:PS formulations were made at a 3:1 FRR and 15 mL/min TFR (4 mg/mL initial lipid and 0.25 mg/mL initial ovalbumin concentration). The DSPC:Chol:DOTAP formulation was produced at a 1:1 FRR, and the ovalbumin was adsorbed onto the surface by passing pre-made DSPC:Chol:DOTAP formulation through the microfluidics NanoAssemblr. All results were measured three times, with the average encapsulation and ovalbumin loading calculated.
.
Figure 6. Bland and Atlman plot analysis for the comparison of three analytical techniques. Plot of differences between three analytical techniques (RP-HPLC, HPLC-ELSD and BCA assay) on the y-axis, versus the mean of the three analytical techniques for the three formulations (DSPC:Chol, DSPC:Chol:PS and DSPC:Chol:DOTAP). The calculated mean is −8.8 (horizontal solid line), with the bias represented by the gap between the mean and the dashed lines. All formulations were measured three times for the encapsulation efficiency, with each measurement plotted.
[image:12.595.123.475.447.645.2]As the liposomes are a mixture of lipids, cholesterol and protein, the quantification of protein without interference from the lipid components or solubilisation is important. Whilst the lipids do not interfere with the RP-HPLC and HPLC-ELSD techniques, interference is observed from lipids
Pharmaceutics2019,11, 39 13 of 16
4. Discussion
Whilst there are a range of analytical tools available to quantify protein concentration, the ability of these methods to quantify protein loading within liposomes has received limited robustness testing. Therefore, a deeper understanding of the advantages and limitations of these assays is necessary for their effective use. During formulation development, small quantities of liposomes containing protein are produced, with assays requiring a high degree of sensitivity for quantification. Initial experimentation assessed the ability of three techniques (RP-HPLC, HPLC-ELSD, BCA assay) to determine ovalbumin concentrations. All techniques showed high degrees of linearity over the protein concentrations tested (R2> 0.98) (Figure1), with accuracy and precision values within ICH guidelines. All three methods have the ability to detect and quantify protein at low concentrations, with LOD values of less than 3µg/mL and a LOQ values of between 2.33–7.37µg/mL. The ELSD-HPLC method is the most sensitive, with the lowest LOD (0.77µg/mL) and LOQ (2.33µg/mL) calculated. An added feature of the ELSD-HPLC is the ability to change the gain (the sensitivity) of ELSD component. This allows the system to be further optimised, making this system more versatile and easily adaptable depending on specific needs.
As the liposomes are a mixture of lipids, cholesterol and protein, the quantification of protein without interference from the lipid components or solubilisation is important. Whilst the lipids do not interfere with the RP-HPLC and HPLC-ELSD techniques, interference is observed from lipids while using BCA [36], resulting in higher absorbance values. To address this, we have developed a method to accommodate and circumvent lipid background interference, and in the liposome concentration range tested here, linearity was maintained. However, at much higher liposome concentrations the assay could potentially lose its linear association between absorbance and protein concentration as a result of the lipid interference. When attempting to analyse protein loading, it is crucial that relevant liposome blanks are produced in order to accurately quantify the protein within the sample. However, based on Figure2, the background interference for a given liposome formulation at a given concentration can be calculated. Therefore, when analysing a large number of samples with the same liposome concentration and formulation, the BCA assay can be used as a valuable tool for high throughput screening.
Pharmaceutics2019,11, 39 14 of 16
all three techniques to quantify protein loading in neutral, anionic and cationic charged liposomes. Whilst pegylated liposomes were not tested within this study, the above outlined methods will also be applicable to such formulations. Furthermore, although all three methods can be used for protein quantification, the technique and separation method will depend on the protein and formulation to be investigated [38,43].
5. Conclusions
The three analytical techniques (BCA assays, RP-HPLC and HPLC-ELSD) were compared for their ability to determine OVA concentration. The results are comparable, with all techniques able to detect and quantify OVA to a high degree of sensitivity. HPLC techniques are preferred for larger screening as the processing time is quicker. In particular, HPLC-ELSD can be fine-tuned by adjusting the gain, with samples not requiring solubilisation, and thus, may be the most ideal for the quantification of protein loaded in liposomes. Should solubilisation be required, the outlined method was shown to be effective for neutral, anionic and cationic liposomes. Depending on the protein encapsulated, the HPLC methods may need optimising depending on the protein attributes. The final analytical choice, however, will also be dictated by time and the resources available.
Author Contributions:Conceptualization, M.T.H., N.F., Y.P.; methodology, M.T.H., N.F., Y.P.; validation M.T.H., N.F., Y.P.; formal analysis, M.T.H., N.F., Y.P.; investigation, M.T.H., N.F.; resources, Y.P.; data curation, M.T.H., N.F.; writing—original draft preparation, M.T.H., N.F.; writing—review and editing, M.T.H., N.F., Y.P.; visualisation M.T.H., N.F., Y.P.; supervision, Y.P.; project administration, Y.P.; funding acquisition, Y.P. Both M.T.H. and N.F. contributed equally to this work.
Funding:This work was part funded by the EPSRC Centre for Innovative Manufacturing in Emergent Therapies (EPSRC) (EP/I033270/1) and the University of Strathclyde.
Conflicts of Interest:The authors declare no conflict of interest.
References
1. Carter, P.J. Introduction to current and future protein therapeutics: A protein engineering perspective. Exp. Cell Res.2011,317, 1261–1269. [CrossRef] [PubMed]
2. Leader, B.; Baca, Q.J.; Golan, D.E. Protein therapeutics: A summary and pharmacological classification. Nat. Rev. Drug Discov.2008,7, 21. [CrossRef] [PubMed]
3. Gupta, S.; Jain, A.; Chakraborty, M.; Sahni, J.K.; Ali, J.; Dang, S. Oral delivery of therapeutic proteins and peptides: A review on recent developments.Drug Deliv.2013,20, 237–246. [CrossRef] [PubMed]
4. Wilkinson, A.; Lattmann, E.; Roces, C.B.; Pedersen, G.K.; Christensen, D.; Perrie, Y. Lipid conjugation of TLR7 agonist Resiquimod ensures co-delivery with the liposomal Cationic Adjuvant Formulation 01 (CAF01) but does not enhance immunopotentiation compared to non-conjugated Resiquimod+ CAF01.J. Control. Release 2018,291, 1–10. [CrossRef] [PubMed]
5. Marin, M.I.; Benseny-Cases, N.; Camacho, M.; Perrie, Y.; Suades, J.; Barnadas, R. Metallosomes for biomedical applications by mixing molybdenum carbonyl metallosurfactants and phospholipids.Dalton Trans.2018,47, 14293–14303. [CrossRef]
6. Gadd, A.J.; Castelletto, V.; Kabova, E.; Shankland, K.; Perrie, Y.; Hamley, I.; Cobb, A.J.; Greco, F.; Edwards, A.D. High potency of lipid conjugated TLR7 agonist requires nanoparticulate or liposomal formulation.Eur. J. Pharm. Sci.2018,123, 268–276. [CrossRef]
7. Joshi, S.; Hussain, M.T.; Roces, C.B.; Anderluzzi, G.; Kastner, E.; Salmaso, S.; Kirby, D.J.; Perrie, Y. Microfluidics based manufacture of liposomes simultaneously entrapping hydrophilic and lipophilic drugs. Int. J. Pharm.2016,514, 160–168. [CrossRef]
8. Abraham, S.A.; Waterhouse, D.N.; Mayer, L.D.; Cullis, P.R.; Madden, T.D.; Bally, M.B. The Liposomal Formulation of Doxorubicin. InMethods in Enzymology; Academic Press: Cambridge, MA, USA, 2005; Volume 391, pp. 71–97.
Pharmaceutics2019,11, 39 15 of 16
10. Kastner, E.; Kaur, R.; Lowry, D.; Moghaddam, B.; Wilkinson, A.; Perrie, Y. High-throughput manufacturing of size-tuned liposomes by a new microfluidics method using enhanced statistical tools for characterization. Int. J. Pharm.2014,477, 361–368. [CrossRef]
11. Hare, J.I.; Lammers, T.; Ashford, M.B.; Puri, S.; Storm, G.; Barry, S.T. Challenges and strategies in anti-cancer nanomedicine development: An industry perspective.Adv. Drug Deliv. Rev.2017,108, 25–38. [CrossRef] 12. Perrie, Y.; Mohammed, A.R.; Kirby, D.J.; McNeil, S.E.; Bramwell, V.W. Vaccine adjuvant systems: Enhancing
the efficacy of sub-unit protein antigens.Int. J. Pharm.2008,364, 272–280. [CrossRef] [PubMed]
13. Haidar, Z.S.; Hamdy, R.C.; Tabrizian, M. Protein release kinetics for core–shell hybrid nanoparticles based on the layer-by-layer assembly of alginate and chitosan on liposomes. Biomaterials2008,29, 1207–1215. [CrossRef] [PubMed]
14. Huang, J.-H.; Wu, C.-W.; Lien, S.-P.; Leng, C.-H.; Hsiao, K.-N.; Liu, S.-J.; Chen, H.-W.; Siu, L.-K.; Chong, P. Recombinant lipoprotein-based vaccine candidates against C. difficile infections.J. Biomed. Sci.2015,22, 65. [CrossRef] [PubMed]
15. Li, N.; Peng, L.-H.; Chen, X.; Nakagawa, S.; Gao, J.-Q. Effective transcutaneous immunization by antigen-loaded flexible liposome in vivo.Int. J. Nanomed.2011,6, 3241–3250.
16. Christine Lutsiak, M.E.; Kwon, G.; Samuel, J. Analysis of peptide and lipopeptide content in liposomes. J. Pharm. Pharm Sci.2002,5, 279–284.
17. Xu, X.; Costa, A.; Burgess, D.J. Protein Encapsulation in Unilamellar Liposomes: High Encapsulation Efficiency and A Novel Technique to Assess Lipid-Protein Interaction. Pharm. Res. 2012,29, 1919–1931. [CrossRef]
18. Henriksen-Lacey, M.; Bramwell, V.W.; Christensen, D.; Agger, E.-M.; Andersen, P.; Perrie, Y. Liposomes based on dimethyldioctadecylammonium promote a depot effect and enhance immunogenicity of soluble antigen.J. Control. Release2010,142, 180–186. [CrossRef]
19. Schiltz, E.; Schnackerz, K.; Gracy, R. Comparison of ninhydrin, fluorescamine, and o-phthaldialdehyde for the detection of amino acids and peptides and their effects on the recovery and composition of peptides from thin-layer fingerprints.Anal. Biochem.1977,79, 33–41. [CrossRef]
20. Walker, J.M. The Bicinchoninic Acid (BCA) Assay for Protein Quantitation. InThe Protein Protocols Handbook; Walker, J.M., Ed.; Humana Press: Totowa, NJ, USA, 1996; pp. 11–14.
21. Awade, A.C.; Efstathiou, T. Comparison of three liquid chromatographic methods for egg-white protein analysis.J. Chromatogr. B Biomed. Sci. Appl.1999,723, 69–74. [CrossRef]
22. Umrethia, M.; Kett, V.L.; Andrews, G.P.; Malcolm, R.K.; Woolfson, A.D. Selection of an analytical method for evaluating bovine serum albumin concentrations in pharmaceutical polymeric formulations.J. Pharm. Biomed. Anal.2010,51, 1175–1179. [CrossRef]
23. Bartolomeo, M.P.; Maisano, F. Validation of a reversed-phase HPLC method for quantitative amino acid analysis.J. Biomol. Tech.2006,17, 131–137. [PubMed]
24. Vervoort, N.; Daemen, D.; Török, G. Performance evaluation of evaporative light scattering detection and charged aerosol detection in reversed phase liquid chromatography. J. Chromatogr. A2008,1189, 92–100. [CrossRef] [PubMed]
25. Roces, C.B.; Kastner, E.; Stone, P.; Lowry, D.; Perrie, Y. Rapid Quantification and Validation of Lipid Concentrations within Liposomes.Pharmaceutics2016,8, 29. [CrossRef] [PubMed]
26. Douville, V.; Lodi, A.; Miller, J.; Nicolas, A.; Clarot, I.; Prilleux, B.; Megoulas, N.; Koupparis, M. Evaporative light scattering detection (ELSD): A tool for improved quality control of drug substances.Pharmeur. Sci. Notes 2006,2006, 9–15.
27. Liu, W.; Ye, A.; Liu, W.; Liu, C.; Han, J.; Singh, H. Behaviour of liposomes loaded with bovine serum albumin during in vitro digestion.Food Chem.2015,175, 16–24. [CrossRef] [PubMed]
28. Colletier, J.-P.; Chaize, B.; Winterhalter, M.; Fournier, D. Protein encapsulation in liposomes: Efficiency depends on interactions between protein and phospholipid bilayer.BMC Biotechnol.2002,2, 9. [CrossRef] 29. Huang, Y.-Y.; Wang, C.-H. Pulmonary delivery of insulin by liposomal carriers.J. Control. Release2006,113,
9–14. [CrossRef] [PubMed]
Pharmaceutics2019,11, 39 16 of 16
31. Kaminski, G.A.; Sierakowski, M.R.; Pontarolo, R.; dos Santos, L.A.; de Freitas, R.A. Layer-by-layer polysaccharide-coated liposomes for sustained delivery of epidermal growth factor. Carbohydr. Polym. 2016,140, 129–135. [CrossRef]
32. Cao, H.; Dan, Z.; He, X.; Zhang, Z.; Yu, H.; Yin, Q.; Li, Y. Liposomes Coated with Isolated Macrophage Membrane Can Target Lung Metastasis of Breast Cancer.ACS Nano2016,10, 7738–7748. [CrossRef] 33. Guideline, I.H.T. Validation of Analytical Procedures: Text and Methodology Q2 (R1). Available
online: https://www.ich.org/fileadmin/Public_Web_Site/ICH_Products/Guidelines/Quality/Q2_R1/ Step4/Q2_R1__Guideline.pdf(accessed on 18 Januray 2019)
34. Long, G.L.; Winefordner, J.D. Limit of detection. A closer look at the IUPAC definition.Anal. Chem.1983,55, 712A–724A.
35. Fatouros, D.G.; Antimisiaris, S.G. Effect of amphiphilic drugs on the stability and zeta-potential of their liposome formulations: A study with prednisolone, diazepam, and griseofulvin.J. Colloid Interface Sci.2002, 251, 271–277. [CrossRef] [PubMed]
36. Kessler, R.J.; Fanestil, D.D. Interference by lipids in the determination of protein using bicinchoninic acid. Anal. Biochem.1986,159, 138–142. [CrossRef]
37. Tipton, E.; Shuster, J. A framework for the meta-analysis of Bland–Altman studies based on a limits of agreement approach.Stat. Med.2017,36, 3621–3635. [CrossRef] [PubMed]
38. Grotefend, S.; Kaminski, L.; Wroblewitz, S.; Deeb, S.E.; Kühn, N.; Reichl, S.; Limberger, M.; Watt, S.; Wätzig, H. Protein quantitation using various modes of high performance liquid chromatography.J. Pharm. Biomed. Anal. 2012,71, 127–138. [CrossRef] [PubMed]
39. Twomey, P.; Kroll, M. How to use linear regression and correlation in quantitative method comparison studies.Int. J. Clin. Pract.2008,62, 529–538. [CrossRef] [PubMed]
40. Eksborg, S. Evaluation of method-comparison data.Clin. Chem.1981,27, 1311–1312. [PubMed]
41. Altman, D.G.; Bland, J.M. Measurement in medicine: The analysis of method comparison studies.Statistician 1983,32, 307–317. [CrossRef]
42. Giavarina, D. Understanding bland altman analysis. Biochem. Medica Biochem. Medica2015,25, 141–151. [CrossRef]
43. Megoulas, N.C.; Koupparis, M.A. Twenty Years of Evaporative Light Scattering Detection. Crit. Rev. Anal. Chem.2005,35, 301–316. [CrossRef]