Comparison of Signal-to-noise, Blank Determination, and Linear Regression Methods for the Estimation of Detection and Quantification Limits for Volatile Organic
Compounds by Gas Chromatography
M. Marsin Sanagi,*1,2 Susie L. Ling,2 Zalilah Nasir,2 Wan Aini Wan Ibrahim2 and Ahmedy Abu Naim2
1
Ibnu Sina Institute for Fundamental Science Studies, 2Department of Chemistry, Faculty of Science, Universiti Teknologi Malaysia, 81310 UTM Skudai, Johor, Malaysia
*Corresponding author: E-mail: [email protected]
Abstract
Limit of detection (LOD) and limit of quantification (LOQ) are two important performance characteristics in method validation. This work compares three methods based on the International Conference of Harmonization (ICH) and EURACHEM guidelines, namely, signal-to-noise, blank determination, and linear regression, to estimate the LOD and LOQ for volatile organic compounds (VOCs) by experimental methodology using gas chromatography. Five VOCs, i.e. toluene, ethylbenzene, iso-propylbenzene, n-propylbenzene and styrene, were chosen for the experimental study. The results indicated that the estimated LODs and LOQs were not equivalent and could vary by a factor of 5 to 6 for the different methods. It is therefore essential to have a clearly described procedure for estimating the LOD and LOQ during method validation to allow interlaboratory comparisons.
Keywords: Estimation Methods for Detection and Quantification Limits, Volatile Organic Compounds, Gas Chromatography
Introduction
Method validation is necessary in analytical laboratory to ensure that reliable analytical procedures are used under the defined conditions. It is internationally recognized as an essential part of a comprehensive quality assurance system in analytical chemistry. In order to demonstrate that the method is suitable for its intended purpose, it must meet certain performance characteristics. The important performance characteristics include applicability, specificity, linearity, precision, accuracy, limit of detection (LOD), limit of quantification (LOQ) and ruggedness. LOD and LOQ are two fundamental elements of method validation that define the limitations of an analytical method.
This paper describes the comparison of the three methods to estimate LOD and LOQ based on practical approaches to a gas chromatographic method. Gas chromatography (GC) is chosen for the study because it is an important analytical tool which is available in almost any major chemical analytical laboratory and it is suitable for almost any mixture of
components that exhibit reasonable volatility.
Definitions
necessarily quantified, under the stated conditions of the test. The LOQ is the lowest
concentration of an analyte in a sample that can be determined with acceptable precision and accuracy under the stated conditions of test (1).
The IUPAC definition states that “the limit of detection, expressed as the concentration, , or the quantity, , is derived from the smallest measure, that can be detected with
reasonable certainty for a given analytical procedure. The value of
L
c
L
q xL
L
x is given by the following equation:
i
i b
b
L x ks
x = +
where
i
b
x is the mean of the blank measures, is the standard deviation of the blank
measures, and is a numerical factor chosen according to the confidence level desired (2).” Furthermore, Long and Winefordner
i
b
s
k
(3) has suggested converting measurement units, to concentration, as follows:
L x L c m x x c L bi
L
)
( +
=
where m is the analytical sensitivity. By substituting equation into equation , this becomes:
L
x cL
m ks c bi
L =
The value of k equals to threehas been recommended by IUPAC(4) and other authors(3,5,6) which allows a confidence level of 99.87% for the values of following a normal
distribution.
i
b
x
Methods of estimating LOD and LOQ
There are several possible conceptual methods regarding LOD and LOQ, each providing a somewhat different definition. Depending on the definition chosen, the values of LOD and LOQ can vary greatly which make it difficult for comparative purposes. In this paper, the three methods based on International Conference of Harmonization (ICH)(6) and
EURACHEM (7) guidelines are discussed.
Signal- to-noise
By using the signal-to-noise method (6), the peak-to-peak noise around the analyte retention time is measured, and subsequently, the concentration of the analyte that would yield a signal equal to certain value of noise to signal ratio is estimated. The noise magnitude can be
measured either manually on the chromatogram printout or by auto-integrator of the instrument. A signal-to-noise ratio (S/N) of three is generally accepted for estimating LOD and signal-to-noise ratio of ten is used for estimating LOQ. This method is commonly applied to analytical methods that exhibit baseline noise.
Blank determination
i
i b
b s
x LOD ≅ +3
i
i b
b s
x LOQ ≅ +10
where
i
b
x is the mean concentration of the blank and is the standard deviation of the blank.
i
b
s
Linear regression
For a linear calibration curve, it is assumed that the instrument response y is linearly related to the standard concentration x for a limited range of concentration. It can be expressed in a model such as:
bx a y = +
This model is used to compute the sensitivityb and the LOD and LOQ (6). Therefore the LOD and LOQ can be expressed as:
b s LOD ≅ 3 a
b s LOQ ≅10 a
wheresa is the standard deviation of the response and b is the slope of the calibration curve.
The standard deviation of the response can be estimated by the standard deviation of
either y-residuals, or y-intercepts, of regression lines. This method can be applied in
all cases, and it is most applicable when the analysis method does not involve background noise. It uses a range of low values close to zero for calibration curve, and with a more homogeneous distribution will result in a more relevant assessment.
a
s
res
s
0
y
s
Experimental
Standards and reagents
The reference standards for toluene, ethylbenzene, iso-propylbenzene, n-propylbenzene and styrene with a purity higher than 98% were supplied by Kanto (Tokyo, Japan).
Dichloromethane (DCM) (Ultra-resi-analyzed grade) was obtained from J.T. Baker (USA). A stock solution of 1000 µg/mL in DCM was prepared separately for the five test compounds. A mixture solution at a level of 10 µg/mL was prepared from the stock solution above using the same solvent. A series of working standard solutions ranging from 0.2 µg/mL to 4.0 µg/mL were prepared from the mixture solution (10 µg/mL) by dilution in DCM.
Instrument and chromatographic conditions
fused-silica capillary column (30 m × 0.25 mm I.D., Varian) with 0.25 µm film thickness was used with helium as carrier gas at a rate of 8 ml/min. The initial oven temperature was held isothermically at 50°C for 5 min, increased to 110°C at 4°C min-1, then raised to 230°C at 20°C min-1 and maintained at 230°C for 4 min. The injector was set at split mode (1:10), injector temperature was held constant at 220°C, and injection volume of 1.0 µL. The FID temperature was kept at 240°C. The chromatographic data were analyzed and processed using a Shimadzu Class-VP 4.3 acquisition program.
Procedure
For the purpose of comparison between different approaches, DCM was used as a blank sample. The levels of concentration for each compound and number of replicates and measurements performed by using the three methods are listed in Table 1.
In order to respect measurement independence, each replicate was performed on a newly prepared standard solution and the replicates were carried out on different days to take into consideration of run effect. The run effects accounts for day-to-day variations in the
analytical system, such as batches of reagents, recalibration of instruments, and the laboratory environment changes.
For generation of calibration curve, the concentration levels were chosen in a range around LOD and LOQ to ensure the homoscedasticity, the independence of the area dispersion in relation to analyte quantity.
Data Analysis
Microsoft office excels (2003) spreadsheet was chosen to store, display raw data and to perform statistical calculations with the built-in statistical functions.
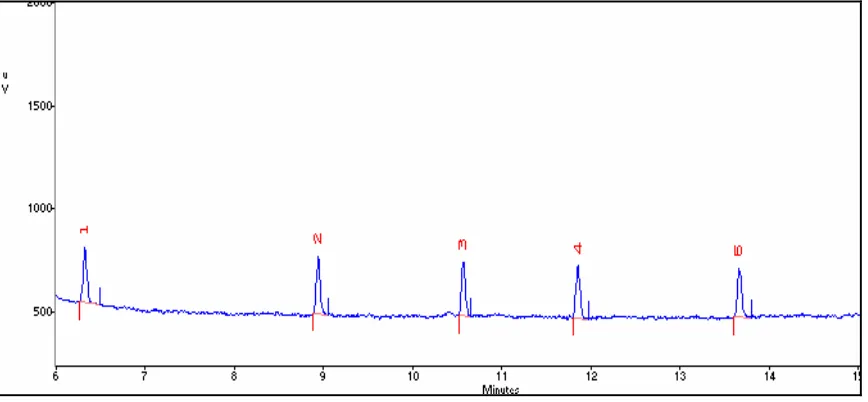
Results and discussion
Under the instrumental operating conditions as described above, the VOCs were perfectly separated as shown in Figure 1. The elution order for the five compounds is toluene [1], ethylbenzene [2], iso-propylbenzene [3], n-propylbenzene [4] and styrene [5].
Signal- to- noise
The noise value was calculated based on the peak height of the blank (DCM) around the retention time of each analyte using auto-integrator. LOD was estimated as three times noise value and LOQ was estimated as ten times noise value as shown in Table 2.
This method is widely used for instrument method such as gas chromatography as it is easy to implement. However, the stability of the instrument response on day-to-day basis will affect the results obtained. In this study, 10 independent numbers of blank together with the standard solution at the level of 0.4 µg/mL were analyzed separately on different days. Due to the run effect of the instrument, the relative standard deviations for the 10 measurements ranged from 25% to 44% for the five test compounds. This method depends heavily on individual analyst’s interpretation of how to obtain the magnitude of noise whether by manual measurement or using auto-integrator of the instrument. Therefore the values obtained are difficult for comparison between different analysts or laboratories.
Blank determination was carried out by analysis of 10 independent sample blanks, the mean concentration and the standard deviations of the blank results were calculated (Table 3).
The blank determination method as described in EURACHEM guide (7), LOD is
estimated as 3s more than the blank value as it assumes that a signal more than 3 times above the standard deviation of the sample blank value is likely to have arisen from the measurand. For this approach, it needs a sample blank for each sample matrix to be analyzed, and the estimated LOD and LOQ may vary for different sample matrices. However, getting a true sample blank can be difficult and in certain situation, reagent blank is used as a blank. The LOD and LOQ estimated by using reagent blank does not take into consideration of matrix interference, and the estimated values can be smaller than that using true sample blank.
Linear Regression
Linear ordinary least-squares regression parameters were calculated based on the analysis of ten replicates of test compounds at seven different concentration levels. The data obtained were used to compute the two coefficient of the calibration curve and also to perform a lack-of-fit test, which was used to verify that the selected calibration domain was actually linear. The standard deviation of the blank was estimated by using both standard deviation of regression residual ( ) and y – intercept ( ) as shown in Table 4 and results of the
statistical evaluation of the linear regression curve is shown in Table 5. res
s
0
y
s
The calculation of the test table showed that the test for regression was significant while the F observed value for each analyte was much higher than the critical value of 3.993, which corresponded to F(1,69,5%). This meant that the instrumental response was significantly correlated to the analyte concentration. When the lack-of-fit test was performed, the Fisher variable associated to the test for the error of model was smaller than the critical value of 2.361. It can be concluded that the error of model was not significant at the risk level of 5% and the proposed linearity domain could be accepted.
The linear regression method can help to solve the problem of difficulty in obtaining matrix blank for other methods. This is because calibration curve can be prepared by sample addition method. From this study, the results showed that the y-intercept standard deviation and y-residual standard deviation varied greatly. The values of y-intercept standard deviation were much lower than those of y-residual standard deviation for the five analytes. These results were in agreement with the study reported by Vial and Jardy (8). The values of LOD and LOQ obtained by this method can vary depending on the number of concentration levels, range of concentration used, number of measurement and data heteroscedasticity. The
ordinary least-square regression is used in this case with the assumption that the data obtained are homoscedastic, if not; the weighted least-square regression is preferred.
Comparison of LOD and LOQ by different methods
Based on the experimental results, the LOD and LOQ were estimated for the different methods as summarized in Table 6 and Table 7.
For LOD, the values obtained by signal-to-noise and blank determination methods were close to each other. The linear regression method by using showed largest values of LOD
and by using gave lowest values of LOD for all the analytes. For LOQ, similar trend
observed for linear regression method as in LOD. However, the signal-to-noise method presented about two times values of LOQ as compared to blank determination method. The LOQ values obtained by blank determination were comparable to linear regression method
res
s
0
y
using . From these findings, it seemed that not all the methods used to estimate LOD and
LOQ in this study were equivalent. The differences between the smallest and the largest values estimated by different methods could vary by a factor of five to six for both LOD and LOQ.
0
y
s
Reliability of the LOD and LOQ estimates
It is difficult to compare the degree of reliability of the LOD and LOQ estimates. In order to check predetermined LOD and LOQ values obtained by statistical or empirical approach, the laboratory can obtain test material with known quantities of analyte at the level of the
estimated LOD and LOQ limit, or fortified true blank sample at the level of estimated LOD and LOQ levels, and determine the precision as expressed in the relative standard deviation (RSD). The RSD of 10% is generally acceptable for LOQ (9,10) and 33% for LOD (9).
The LOD and LOQ values obtained using different methods can vary significantly based on this experimental study using GC method. In the absence of a uniform definition and guideline for LOD and LOQ determinations, during method validation, the exact procedure for determination of LOD and LOQ must be clearly stated in the documented method so that the estimated LOD and LOQ values can be used for comparison by other analysts or
laboratories.
Acknowledgements
The authors would like to thank Universiti Teknologi Malaysia and the Public Health
Laboratory Johor Bahru, Health Department of Johor for technical support, research facilities and studentship to Susie Lu Ling and Zalilah Nasir.
References
(1) NATA (1998) NATA Technical Note #17, National Association of Testing Authorities, Australia
(2) McNaught, A.D. and Wilkinson, A. (1997) IUPAC Compendium of Chemical
Terminology 2nd Ed., Blackwell Science
(3) Long, G.L. and Winefordner, J.D. (1983) Anal. Chem.55, 712-724 (4) Currie, L.A. (1995) Pure & Appl. Chem.67,1699-1723
(5) Miller, J.N. and Miller, J.C. (2000) Statistics and chemometrics for analytical chemistry,
Pearson Education Limited, Edinburgh Gate, England
(6) ICH Q2B (1996) Validation of Analytical Procedure: Methodology, International Conference on Harmonisation of Technical Requirements for Registration of Pharmaceuticals for Human Use.
(7) EURACHEM (1998) The Fitness for purpose of analytical methods. A Laboratory
guide to method validation and related topics, LGC, Queens Rd, Teddington, Middlesex, TW11 0LY, United Kingdom.
(8) Vial, J. and Jardy, A. (1997) Anal. Chem. 71, 2672-2677
Table 1. Concentrations of test compounds and number of replicates used for experimental application
Method Levels (µg/mL), p Replicates, n Measurements, np
Signal-to-noise 0, 0.4 10 20
Blank determination 0, 0.4 10 20
Linear regression 0.2, 0.4, 0.6, 0.8,
1.0, 2.0, 4.0
10 70
Table 2. Data obtained for each test compound based on signal-to-noise method Mean (peak height values), n = 10 Compound
Blank % RSD S/N = 3 S/N = 10
Toluene 16 43 49 163
Ethylbenzene 15 44 44 146
iso-Propylbenzene 15 37 45 151
n-Propylbenzene 14 25 41 136
Styrene 13 25 38 126
Table 3. The mean concentration and standard deviation of blank obtained using blank determination method
Blank , n = 10 Compound
Mean conc. (
i
b
x ), µg/mL Standard deviation ( )
i
b
s
Toluene 0.054 0.022
Ethylbenzene 0.052 0.021
iso-Propylbenzene 0.056 0.018
n-Propylbenzene 0.051 0.013
Styrene 0.050 0.015
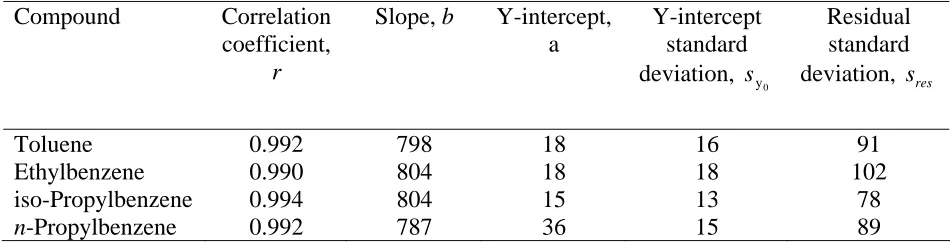
Table 4. Parameters of linear ordinary least-squares regression for the five test compounds at seven different levels of concentration, n = 10
Compound Correlation coefficient,
r
Slope, b Y-intercept,
a
Y-intercept standard deviation,
0
y
s
Residual standard deviation, sres
Toluene 0.992 798 18 16 91
Ethylbenzene 0.990 804 18 18 102
iso-Propylbenzene 0.994 804 15 13 78
Styrene 0.995 802 0.03 13 73
Table 5. Results of the statistical evaluation of the linear regression curve
Regression test Lack-of-fit test
Compound
Observed value,
Fobs (1,69,0.5%)
Critical value
Fcrit (1,69,0.5%)
Observed value,
Fobs (5,69,0.5%)
Critical value
Fcrit (5,69,0.5%)
Toluene 7923.943 0.714
Ethylbenzene 6175.352 0.157
iso-Propylbenzene 10677.743 0.223
n-Propylbenzene 7827.221 0.286
Styrene 12309.553 3.993
0.360
2.361
Table 6. Summary of estimated LOD by different methods
Estimated LOD, µg/mL Method
Linear regression Compound
Signal-to- noise Blank
determination
0
y
s sres
Toluene 0.16 0.12 0.06 0.34
Ethylbenzene 0.16 0.12 0.07 0.38
iso-Propylbenzene 0.17 0.11 0.05 0.29
n-Propylbenzene 0.15 0.09 0.06 0.34
Styrene 0.15 0.10 0.05 0.27
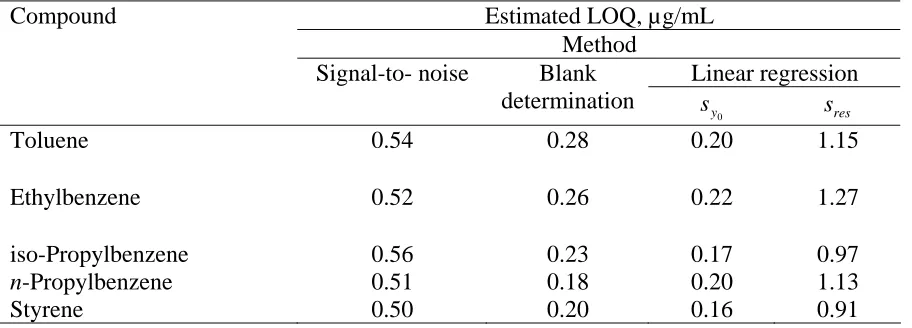
Table 7. Summary of estimated LOQ by different methods
Estimated LOQ, µg/mL Method
Linear regression Compound
Signal-to- noise Blank
determination
0
y
s sres
Toluene 0.54 0.28 0.20 1.15
Ethylbenzene 0.52 0.26 0.22 1.27
iso-Propylbenzene 0.56 0.23 0.17 0.97
n-Propylbenzene 0.51 0.18 0.20 1.13
Figure 1. GC-FID chromatogram of a 1.0 µg/mL standard solution of the five test
compounds. Chromatographic conditions: column CP-WAX 52CB WCOT (30 m × 0.25 mm