City, University of London Institutional Repository
Citation
:
Jagadeesh, C., Gowree, E. R., Jadidbonab, H. and Atkin, C. J. ORCID:
0000-0003-2529-1978 (2018). On the temporal analysis of acoustic waves using schlieren
imaging. Measurement, 116, pp. 507-513. doi: 10.1016/j.measurement.2017.11.018
This is the accepted version of the paper.
This version of the publication may differ from the final published
version.
Permanent repository link:
http://openaccess.city.ac.uk/19810/
Link to published version
:
http://dx.doi.org/10.1016/j.measurement.2017.11.018
Copyright and reuse:
City Research Online aims to make research
outputs of City, University of London available to a wider audience.
Copyright and Moral Rights remain with the author(s) and/or copyright
holders. URLs from City Research Online may be freely distributed and
linked to.
City Research Online:
http://openaccess.city.ac.uk/
[email protected]
Elsevier Editorial System(tm) for Measurement
Manuscript Draft
Manuscript Number: MEAS-D-17-01078R2
Title: On the Temporal Analysis of Acoustic Waves Using Schlieren Imaging
Article Type: Research Paper
Keywords: Acoustic waves; Schlieren technique; Image processing; Underexpanded jets
Corresponding Author: Dr. Chetan Jagadeesh, PhD
Corresponding Author's Institution: City, University of London
First Author: Chetan Jagadeesh, PhD
Order of Authors: Chetan Jagadeesh, PhD; Erwin Gowree, PhD; Hesamaldin Jadidbonab; Chris Atkin
ON THE TEMPORAL ANALYSIS OF ACOUSTIC WAVES USING
SCHLIEREN IMAGING
Chetan Jagadeesh, Erwin R. Gowree, Hesamaldin Jadidbonab and Christopher J. Atkin
Department of Mechanical Engineering & Aeronautics, City, University of London
Northampton Square, London EC1V 0HB, UK
ABSTRACT
The primary objective of the present study was to develop a quantitative schlieren-imaging technique that can be used to study the dynamics of instability waves. The technique was initially validated by optically capturing a controlled acoustic wave generated by a compression driver and excellent agreement was obtained with microphone measurements. An underexpanded jet was considered as an ideal test case due to the complexity and multitude of instability mechanism. Further analysis of the underexpanded jet demonstrated that this technique can be used to capture the very high frequency mode related to the phenomenon of screech.
1.
INTRODUCTION
Laser based optical diagnostic techniques such as Laser Doppler Anemometry (LDA) and Particle Image Velocimetry (PIV) have contributed significantly in broadening the understanding of diverse physical mechanisms in fluid mechanics. Even though LDA has a high temporal resolution, it is only possible to measure the velocity at any one given point at a time. On the other hand, PIV technique is capable of measuring an entire two-dimensional cross section of the flow field simultaneously. Their main advantage can be considered as them being non-intrusive techniques, however in both cases seeding particles need to be introduced and there are still unanswered questions regarding their effect on the freestream environment in a low-turbulence tunnel facility and how it influences the dynamics of laminar to turbulent transition. In a review presented by Scarano [1], further issues with seeding in the supersonic regime were reported, mainly related to the inhomogeneity in seeding dispersion and poor seeding density in regions of very steep pressure gradients through shocks and expansions, and particle ejection in recirculating regions and vortices. PIV still possesses limitations for unsteady flow measurements at high subsonic, supersonic and hypersonic flow regimes due to large frequency band of interest ranging between 100 Hz to 100 kHz, whereby limitation to high sampling rate is due to finite time separation between laser pulses. Image quality degradation due to refractive index change in the compressible regime could also lead to spurious PIV measurements, therefore in this case Schlieren and Shadowgraph techniques are a better alternative since they are inherently based on refractive index gradient.
Previous studies involving underexpanded jets using schlieren and shadowgraph methods have focussed mainly on qualitative measurements, where the techniques have been used either purely as a visualisation tool, or as a qualitative-comparison tool (Mitchell et al. [2], Willert et al. [3], Castelain et al. [4], Panda and Seasholtz [5], to cite a few). Limited quantitative measurements have been reported in the literature, with only the time-averaged schlieren images being used in the analyses (Bailly et al. [6], Ben-Yakar and Hanson [7], to cite a few). The progress in high-speed camera technology and digital image processing permits quantitative analysis of unsteady data. Underexpanded jets have been a subject of much consideration as they are notorious for exciting dynamic modes which could results in catastrophic structural failures quite commonly observed on combat aircraft vertical or horizontal stabiliser [8]. In addition they are the primary source of noise and studies in the 1950’s by Powell [9] demonstrated that they comprise of two dominant components namely the screech tones and broadband shock-associated noise (BBSAN). According to a more recent study by Bailly et al. [6], the secondary flow at the exhaust of transonic commercial aircraft is underexpanded, but unlike choked jets in laboratories the dominant noise constitutes purely of broadband shock-associated noise due to asymmetry.
Raman [10] presented a summary of the investigations conducted on understanding screech over a period of half a century and a pathway describing the mechanism was presented, mainly elaborating on the pioneering work of Powell. Four processes were identified, namely the ‘receptivity process’, ‘instability wave growth’, ‘instability-shock interaction’ and ‘acoustic feedback’ to constitute the loop. The most highlighted unstable mode in the literature is the acoustic feedback due to the upstream propagation of the acoustic waves. The study by Beneddine
opto-acoustic technique. During the current study more emphasis will be placed on the phenomenon of screech as there seem to be sufficient findings which can help to validate the high speed schlieren opto-acoustic technique.
2.
THE EXPERIMENT
The experiments were conducted in the Handley Page Aeronautics Laboratory at City, University of London. An air jet was generated through a 4.5mm diameter nozzle which was operated using a continuous supply of compressed air at a nozzle pressure ratio (NPR) of 5.4. The local speed of sound, a, was calculated to be approximately 341.6 m/s and using isentropic relation the flow at the exit of the nozzle was calculated to be at a Mach number, M = 1.72 for a specific heat ratio, γ =1.4. Since the pressure at the exit of the nozzle was higher than the ambient air, an underexpanded jet was expected and due to the highly compressible nature of the flow schlieren technique was preferred as the method of flow diagnosis.
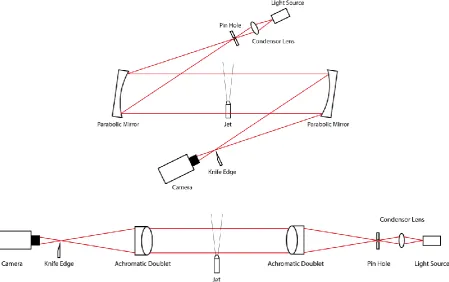
Two types of schlieren set-ups were used and the schematic representation of which are shown in Fig. 1. The Z-type system features two 0.2m diameter, f/4 parabolic mirrors with a focal length of 1.83m (details available in Settles [12]). The Z-type system provided a large field of view, which was found necessary in order to capture the acoustic waves generated by the underexpanded jet. An inline type focussed-schlieren system was also used to obtain detailed information of the flow structures in the underexpanded jet. This system used a pair of achromatic lenses to act as a collimator and a focuser. The illumination for both set-ups was provided by a cold-light source powered by a 100w halogen lamp. A flexible fibre optic bundle acted as a light guide and delivered approximately 1000 lumens of luminous flux. A 0.024m diameter condenser lens having a focal length of 0.013m helped concentrate more light from the light source on to a pinhole.
[image:4.595.74.524.436.718.2]The large depth of field of the Z-type schlieren technique meant that the density gradients captured by the camera resulted from integration along the whole optical line-of-sight. This resulted in contamination from unwanted variation in density due to natural convection of air in the laboratory. This was curtailed as much as possible by turning off the laboratory ventilation and restricting personnel movement. Depending on the orientation of the knife-edge, at the focal point of both the second parabolic mirror and the focusing achromatic doublet, density gradients were visualized in a single direction (dρ/dx or dρ/dr) at a time (see Figure 5 for details).
Two types of cameras were used during this study. Preliminary work was conducted using a Phantom Miro 320 at a resolution of 768 X 576 pixels operating at a frame rate of 7200 frames per second (fps). Even though this frame rate could be increased, the limitations of the sensor size meant that the required field of view could not be captured. The acoustic wave visualizations were conducted using a Photron SA1.1 high-speed camera, operating at a resolution of 320 X 256 pixels and a frame rate of 60000 fps with exposure time of 1.02μs. This resulted in an increased temporal resolution, which is necessary to conduct spectral analysis of the captured schlieren images. The feasibility of this quantitative technique was assessed by high-speed schlieren imaging of acoustic waves generated from a compression driver. A Celestion CDX1-1745 8Ω ferrite driver with an exit diameter of 0.0245m, a frequency range of 1.2kHz-20kHz and sensitivity of 110dB was positioned in the schlieren target area. The compression driver was driven by a sine wave at 10kHz using a Hameg HM8030 function generator module and a commercial grade 30W audio amplifier. Sound pressure levels were measured using a GRAS Type 26CB-46BL condenser microphone with a frequency range of 4Hz-70kHz and rated at a maximum of 166dB. The microphone data was acquired at a rate of 51200 samples per second via a National Instruments NI-9234 IEPE module, and data was acquired for 60 seconds through NI LabVIEW software. The microphone was also used to capture the near-field acoustic spectra from the underexpanded jet which is the main practical test case.
3.
VALIDATION OF SCHLIEREN OPTO-ACOUSTIC TECHNIQUE
3.1.
Imaging of acoustic waves from controlled source
To validate the opto-acoustic technique an attempt was made to capture the sound waves generated from a controlled 10kHz acoustic source generated by a Celestion compression driver. The schlieren images were captured using the Photron camera at a sampling rate of 50k fps. Unfortunately, from the images shown in Fig. 2 clear fringes of the sound wave was not captured unlike during the study of Hargather et al.[13]. This might be attributed to the fact that the intensity of the sound pressure field being quite low due to limitations in driving the compression driver at its peak rated power. Similar observation can be made in the results presented by Hargather
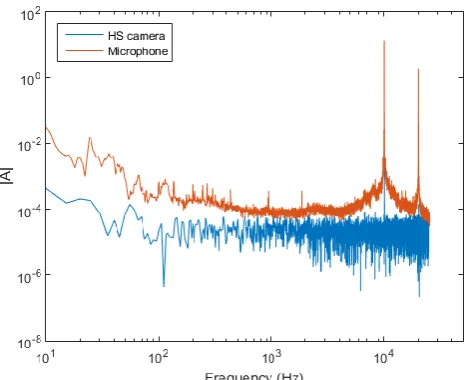
et al. for lower sound pressure level. However, the change in the dark patch close to the exit of the driver tends to suggest that some content of the sound wave was captured and was used for further quantitative data analysis. Sound pressure level measurements, using the GRAS microphone, were made for further comparison. In this case only the spectral content of the signal was required and therefore no particular emphasis was placed on resolving the amplitude of the acoustic field. The signal from the microphone was sampled for 60s and during spectral analysis this signal was split into 60 blocks of 1s where a Hanning window was applied to each block to smoothen the output from the spectra. The ‘pwelch’ function from MatLab was used for the spectral analysis and the result
is presented in Fig. 3 where a sharp fundamental can be observed at 10kHz which was the frequency at which the driver was operating followed by the 1st harmonic at 20kHz. The microphone was factory calibrated and at a
frequency of 250Hz an uncertainty of +/- 0.08 dB was quoted. For the purpose of this experiment the SPL was not of great importance as we were more concerned about the frequency, nevertheless from the factory calibration the frequency response was flat within the range of 250Hz to 25kHz. From the spectral analysis the peak frequency resolved from the microphone signal had an uncertainty of less than 0.2% and the agreement between the microphone and the peak from the image processing was within +/-0.1%.
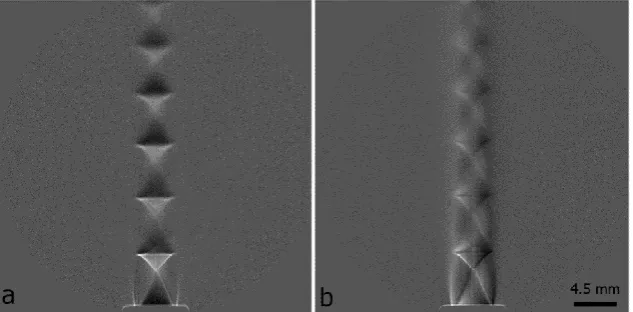
Post-processing of the schlieren images was performed to enhance the low-contrast features using MatLab. The image processing mainly consisted of shade/contrast correction, edge enhancement and noise reduction. Background images, taken with an active light source and no flow, were acquired prior to each run. An average of 100 such no-flow images was then subtracted from every flowfield image to eliminate any imperfections and non-uniformities arising from the presence of non-flow related causes. The resulting background-subtracted images were subject to unsharp masking to further remove background gradients and improve contrast and sharpness. Contrast enhancement was achieved using a linear contrast-stretching algorithm proposed by Russ [14], which intensified the brightness of brightest pixels and the darkness of the darkest pixels. Further, an ‘emboss’ filter was used to give a 3D shadow effect to the flow features, followed by Wiener deconvolution filtering, which deblurred and reduced noise from the images. An example of images before and after image-processing is presented in Fig. 4a and Fig. 4b respectively.
Figure 2: Instantaneous schlieren imaging of the density gradient generated by the sound pressure field at the exit of the compression driver at an interval of 0.00002s. The schematic of the position of the compression
driver (CD) and the microphone (M) is shown in (b).
Figure 3: The power spectra of the microphone data and the data from the high speed schlieren imaging.
Figure 4: A sample of unprocessed (left) and processed schlieren images (right).
4.
THE UNDEREXPANDED JET
4.1.
The mean flow structure
field of view was significantly larger, a total of 7 cells were confirmed. The shock cell spacing was calculated through digitisation of Fig. 5a in MatLab. The pixel size was calibrated directly using the internal diameter of the nozzle. Using the calibration constant the number of pixels representing the shock spacing was calculated to be 5.9mm.
From Powell’s [9] theoretical model, the screech frequency can be expressed as
𝑓 = 𝑈𝑐
𝑠(1 + 𝑀𝑐) (1)
[image:7.595.141.458.262.418.2]where, Uc represents the convective speed of the hydrodynamic disturbance, s represents the shock spacing and the convective Mach number, Mc = Uc/a. Following Tam et al. [15], the ratio of convection speed over the mean jet speed, Uc/Uj is approximately 0.55. By substituting in equation 1, the screech frequency, f ≈ 25kHz which is beyond the audible range. This already provides an indication of the frequency range that is expected and was very useful to set the bandwidth for the sampling rate required to capture the data for unsteady analysis.
Figure 5: Time-averaged structure of the shock cells in the underexpanded jet represented by the density gradient along the (a) axial and (b) radial direction.
4.2.
The unsteady flow structure
From the time-averaged flow images shown in Fig. 5 the axial component of the jet, ∂ρ/∂x is axisymmetric along the centreline and periodic about the normal plane whereas the radial component of the jet, ∂ρ/∂r is periodic even along the centreline and the density gradient reduces significantly beyond the 3rd cell. The periodicity normal to
the centreline in ∂ρ/∂r is clearer in Fig. 6 where the first two cells are quite stable and the third cell starts to oscillate helically. Further downstream the interaction between the vortical disturbance and the shock seems to be amplified and the shock cell pattern oscillates intermittently. More severe fluctuations can be observed around the fifth cell and beyond that the pattern is unsustainable. Similar behaviour was observed by Poldervaart et al [16]. The end of the periodicity in the shock structure after the fifth cell appeared to mark the origin of the acoustic wave as shown by the images in Fig. 7 captured by the Z-type schlieren set-up at a rate of 60,000 fps. The poor quality of the shock cell pattern was due to the fact that the camera had to be defocussed to yield better quality image for the acoustic waves. The compromise was due to the acoustic waves propagating out-of-plane of the jet. The main observation from Fig. 7 is the upstream and out-of-phase propagation of the acoustic wave related to the phenomenon of screech, which was confirmed by the spectral analysis of the near-field sound measurements presented in Section 4.3.
Figure 7: Instantaneous images of the underexpanded jet with the Z-type schlieren set-up showing the sound waves. The blue dots refer to the three different locations at which the microphone measurements were made and the locations at which data was extracted from the image processing routine. Location 1 and 2 corresponds to an angle of 30o and 60o with respect to the axis of the jet respectively, at a distance of 10 nozzle diameters from the
jet exit. Location 3 corresponds to an angle of 90o, but at a distance of 5 nozzle diameters from the jet exit.
4.3.
Spectral analysis of near-field of the underexpanded jet
The near-field sound was captured using the GRAS microphone at three different locations, as shown in Fig. 7(b), where location 1 and location 2 corresponds to an angle of 30o and 60o with respect to the axis of the jet
respectively, at a distance of 10 nozzle diameters from the jet exit. Location 3 corresponds to an angle of 90o, but
at a distance of 5 nozzle diameters from the jet exit. The spectra of these signals are shown in Fig. 8 on the left hand side. The figures on the right hand side show the spectra of the grey scale intensity variation extracted from the image post-processing routine employed in Section 3.1, for the images captured at 60k fps, at the same positions corresponding to the location of the microphone measurements.
All the spectra of the microphone measurements show a clear broadband of frequencies with a rise at around 1kHz
and 10kHz due to jet mixing noise. Despite the spectra obtained from the image processing technique being slightly noisy, the rise is still discernible at all the locations explored. The aforementioned noise in the spectra was due to the total sample size being restricted to only 1s as a result of the limited camera memory. From Fig. 7(b), position-1 is physically located close to the origin of shock instability, which is seen to be the source of acoustic waves. In this region, the instantaneous schlieren images displayed a complex interaction of multiple high-frequency modes of the order of 10kHz. This behaviour is evident from the spectrum of the microphone measurements shown in the top-left of Fig. 8. Although not very clear from the spectrum obtained from the image processing, the rise at 10kHz is evident and so are the multiple high-frequency peaks. Position-2, which corresponds to an angle of 60o, is physically further away from the origin the jet instability and the schlieren
[image:8.595.75.524.258.397.2]spectral content is very similar to position-2, except that the energy in the dominant frequency is much lower since this location is physically further from the origin of the shock instability.
Figure 8: The spectra of the near-field sound captured at positions corresponding to the three locations shown in figure 7(b). Spectra on the left are from the signals acquired from the GRAS microphone and on the right are
from the time series constructed from post-processing of images from the high-speed camera.
5.
DISCUSSION
saved in the on-board memory of the camera, the spectra from the imaging technique was noisier both from Fig 4 and Fig 8(b). This could be improved by capturing larger sample sizes and splitting them in blocks before applying the windowing function, similar to the data captured by the microphone.
The inline focussed schlieren proved to be very useful in capturing the structure of the shock cell in detail for more accurate estimation of the cell spacing. Using Powell’s [9] linear model an initial prediction of the screech frequency was obtained and this provided an indication of the sample rate required for data acquisition. The images captured with the vertical knife edge which resolved the density gradient in the radial direction helped in revealing the main source of the instability. From Fig. 6, initially the shear layer close to the nozzle breaks down even before reaching the first Mach disc. This is a form of shear layer instability similar to those observed in subsonic laminar jets, which potentially acts as a source of vortical disturbances or eddies. According to Raman and Rice [17] the shock cell produces a divergent and convergent boundary where the disturbance is further amplified and/or damped while passing through the supersonically decelerating and accelerating flow respectively. The process is periodic and once the amplitude of the disturbance reaches a peak the pattern in the cellular structure is unsustainable.
The point of breakdown of the cellular structure is normally considered as the source of the sound wave, and propagates spherically. Hence it is considered to close the feedback loop as it propagates both in the downstream and upstream direction. This effect was initially observed by Powell and has been reported in various other studies summarised by Raman. Upon impinging with the lip of the nozzle the upstream propagating sound is scattered and reflected back to the initial laminar shear layer and initiates the hydrodynamic instability mechanism through the process of receptivity. The order in which these processes take place is yet to be clearly defined, however in addition to the precise qualitative analysis of the instability mechanism the frequency of the screech mechanism could be resolved from spectral analysis of the images, which makes this technique a quantitative method as well.
6.
SUMMARY
The preliminary study has demonstrated the potential of the schlieren opto-acoustic technique for quantitative unsteady analysis. This technique could be employed for further detailed analysis of the instability mechanisms in underexpanded jets where a nozzle with a larger diameter will be preferable as the frequency of interest will be reduced and hence easier to capture by the high-speed camera. It can be further extended for the study of instability and laminar to turbulence transition in compressible flows or flows with large density gradient.
7.
ACKNOWLEDGEMENT
The authors would like to acknowledge the financial support provided by EPSRC and the National Wind Tunnel Facility.
8.
REFERENCES
[1] F. Scarano, “Overview of PIV in supersonic flows.,” in Particle Image Velocimetry, Springer, 2008, pp. 445-463.
[2] D. Mitchell, D. Honnery and J. Soria, “The visualization of the acoustic feedback loop in impinging underexpanded supersonic jet flows using ultra-high frame rate schlieren.,” Journal of Visualization, vol. 15, no. 4, pp. 333-341, 2012.
[3] C. Willert, D. Mitchell and J. Soria, “An assessment of high-power light-emitting diodes for high frame rate schlieren imaging.,” Experiments in Fluids, vol. 53, no. 2, pp. 413-421, 2012.
[4] T. Castelain, R. Gojon, B. Mercier and C. Bogey, “Estimation of convection speed in underexpanded jets from schlieren pictures.,” in 22nd AIAA/CEAS Aeroacoustics Conference, 2016.
[5] J. Panda and R. Seasholtz, “Measurement of shock structure and shock–vortex interaction in underexpanded jets using Rayleigh scattering.,” Physics of Fluids, vol. 11, no. 12, pp. 3761-3777, 1999.
[6] C. Bailly, B. Andre, T. Castelain, C. Henry, G. Bodard and M. Porta, “An analysis of shock noise components,” AerospaceLab, vol. June, no. 7 , pp. 1-8, June 2014.
[7] A. Ben-Yakar and R. Hanson, “Ultra-fast-framing schlieren system for studies of the time evolution of jets in supersonic crossflows.,” Experiments in Fluids, vol. 32, no. 6, pp. 652-666, 2002.
[9] A. Powell, “On the mechanism of choked jet noise,” Proceedings of the Physical Society, Section B, vol. 66, no. 12, p. 1039, 1953.
[10] G. Raman, “Supersonic jet screech: half-century from Powell to the present,” Journal of Sound and Vibration, vol. 225, no. 3, pp. 543-571, 1999.
[11] S. Beneddine, C. Mettot and S. D., “Global stability analysis of underexpanded screeching jets,” European Journal of Mechanics B/Fluids, pp. 392-399, 2015.
[12] G. S. Settles, Schlieren and shadowgraph techniques: visualizing phenomena in transparent media., Springer Science & Business Media, 2012.
[13] M. J. Hargather, G. S. Settles and M. J. Madalis, “Schlieren imaging of loud sounds and weak shock waves in air near the limit of visibility.,” Shock Waves, vol. 20, no. 1, pp. 9-17, 2010.
[14] J. C. Russ, The image processing handbook, CRC Press, 2011.
[15] C. K. Tam, K. Viswanathan, K. K. Ahuja and J. Panda, “The sources of jet noise: experimental evidence,”
Journal of Fluid Mechanics, vol. 615, pp. 253-292, 2008.
[16] L. J. Poldervaart, A. T. Vink and A. P. J. Wijnands, “The photographic evidence of the feedback loop of a two dimensional screeching supersonic jet of air.,” in Proceedings of the 6th International Congress on Acoustics, Tokyo, 1968.