INDIRECT BONDING WITH DIFFERENT BASE COMPOSITE AND SEALANT COMBINATIONS - AN IN VITRO STUDY
Dissertation submitted to
THE TAMIL NADU DR. M.G.R. MEDICAL UNIVERSITY
In partial fulfilment for the degree of
MASTER OF DENTAL SURGERY
BRANCH - V
ORTHODONTICS AND DENTOFACIAL ORTHOPEDICS
S.NO TITLE PAGE NO.
1 INTRODUCTION
1
2 AIMS AND OBJECTIVES 4
3 REVIEW OF LITERATURE 5
4 MATERIALS AND METHODS 17
5 RESULTS 49
7 DISCUSSION 67
8 SUMMARY AND CONCLUSION 72
9 BIBLIOGRAPHY
73
10 ANNEXURE
FIGURE
NO: TITLE PAGE NO:
1 Conventional Lingual Premolar brackets 22
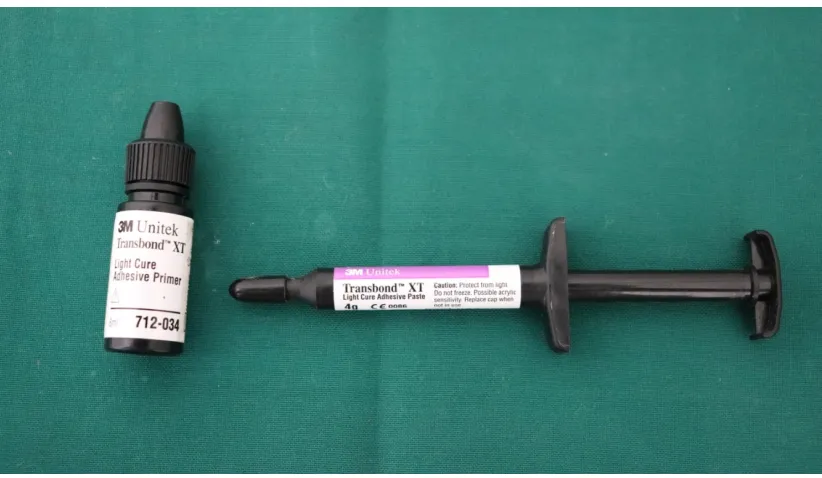
2 Transbond XT light cure adhesive and Transbond XT Plus Primer (3M) 22
3 Enlight light cure adhesive and Orthosolo universal bond
enhancer (Ormco) 23
4 Discover light cure adhesive and Discover bonding resin (Discover) 23
5 Ortho Lite light cure adhesive and Ortho Lite cure sealant (Orthosource) 24
6
Orthofix light cure adhesive and Orthofix light cure
Primer (Anabond Stedman) 24
7 3% Sodium Hypochlorite solution 25
8 Alginate impression material (Zhermack) 25
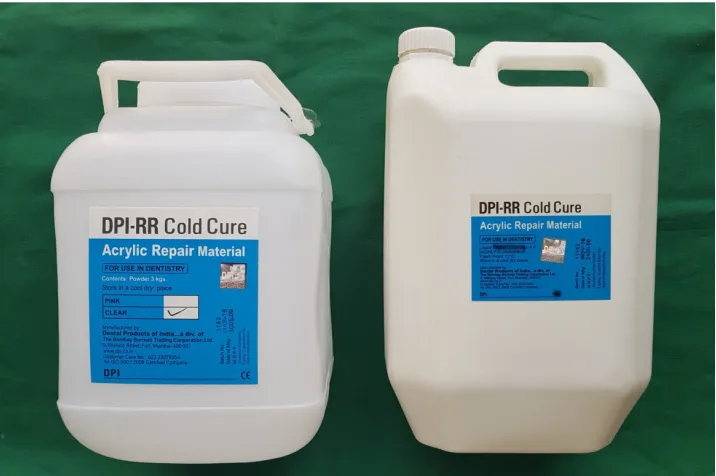
9 Cold cure resin (DPI-RR) 26
10
NO:
11 Cold mould seal (DPI) 27
12 Vinyl polysiloxane impression material (Zetaplus) 27
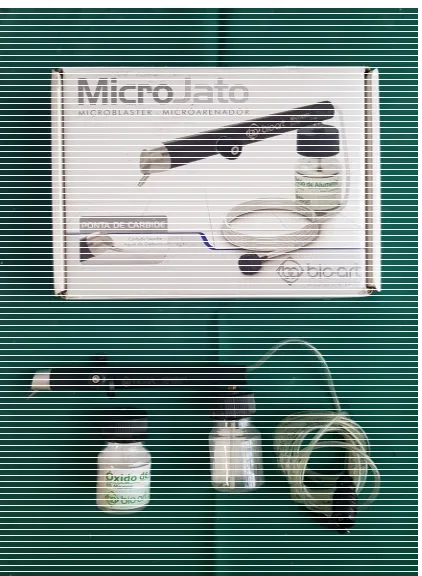
13 Sandblasting machine (MicroJato) 28
14 Modeling wax sheet 28
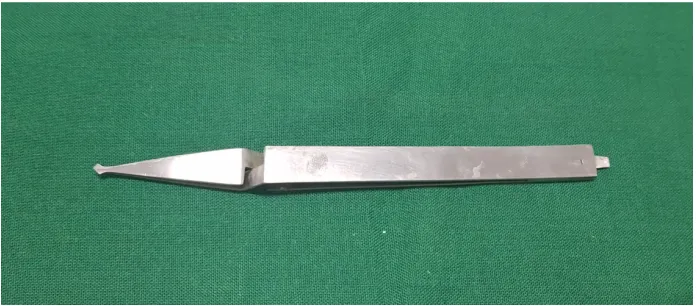
15 Bracket holder 29
16 Light cure Unit (3M Espe) 29
17
Universal Testing machine 30
18
Mould for Acrylic block 31
19 Color coded acrylic blocks of natural teeth 31
20.a A subgroup consisting of 6 teeth embedded in acrylic
block 32
20.c Alginate impression of the acrylic block 32
20.d Working model made of Orthokal 32
21 Cold mould seal applied on the lingual surface of the
working model 32
22 Light curing of the 7th generation conventional lingual brackets with the adhesive
33
23.a Fabrication of transfer tray using Polyvinyl siloxane
impression material 33
23.b
Fabrication of transfer tray using Polyvinyl siloxane
impression material 33
24 Removal of the transfer tray along with the bonded lingual brackets
33
25 Sandblasting of the base composite done 34
26 Pumice prophylaxis done on natural teeth 34
27 Application of etchant on the natural teeth 35
NO: TITLE PAGE NO:
29 Placement of transfer tray over the natural teeth followed by light curing of the brackets
36
30 Removal of the transfer tray after bonding of the brackets 36
31 Shear bond strength tested using Universal Testing Machine
37
32
Display of different groups of acrylic blocks and their
TABLE
NO: TITLE PAGE NO:
1.a
Mean and Standard deviation for peak load and shear bond
strength immediately after tray removal 38
1.b
Mean and Standard deviation for peak load and shear bond
strength 30 minutes after tray removal 38
1.c
Mean and Standard deviation for peak load and shear bond
strength 24 hours after tray removal 39
2.a
Comparison of peak load between subgroups 1 and 2
among different groups using paired t test 39
2.b
Comparison of peak load between subgroups 2 and 3
among different groups using paired t test. 39
2.c
Comparison of peak load between subgroups 1 and 3
among different groups using paired t test. 40
3.a
Comparison of Shear bond Strength between subgroups 1
and 2 among different groups using paired t test. 40
3.b
Comparison of Shear bond strength between subgroups 2
and 3 among different groups using paired t test. 40
3.c
Comparison of Shear bond strength between subgroups 1
and 3 among different groups using paired t test 41
4
Inter group Comparison of Peak Load at different time
5
Inter group Comparison of Shear bond strength at different
time intervals 41
6.a
Multiple comparison using bonferroni post hoc test for
Transbond XT, immediately after tray removal 42
6.b
Multiple comparison using bonferroni post hoc test for
Transbond XT, 30 minutes after tray removal 42
6.c
Multiple comparison using bonferroni post hoc test for
Transbond XT, 24 hours after tray removal 43
7.a
Multiple comparison using bonferroni post hoc test for
Enlight, immediately after tray removal 43
7.b Multiple comparison using bonferroni post hoc test for
Enlight, 30 minutes after tray removal 44
7.c
Multiple comparison using bonferroni post hoc test for
Enlight, 24 hours after tray removal 44
8.a
Multiple comparison using bonferroni post hoc test for
Discover, immediately after tray removal 45
8.b
Multiple comparison using bonferroni post hoc test for
Discover, 30 minutes after tray removal 45
8.c
Multiple comparison using bonferroni post hoc test for
Discover, 24 hours after tray removal 45
9.a
Multiple comparison using bonferroni post hoc test for
9.b Multiple comparison using bonferroni post hoc test for Ortho Lite, 30 minutes after tray removal 46
9.c Multiple comparison using bonferroni post hoc test for Ortho Lite, 24 hours after tray removal 47
10.a
Multiple comparison using bonferroni post hoc test for
Orthofix, immediately after tray removal 47
10.b
Multiple comparison using bonferroni post hoc test for
Orthofix, 30 minutes after tray removal 48
10.c
Multiple comparison using bonferroni post hoc test for
GRAPH
NO: TITLE PAGE NO:
1.a
Mean and Standard deviation for peak load and shear bond
strength immediately after tray removal 54
1.b
Mean and Standard deviation for peak load and shear bond
strength 30 minutes after tray removal 54
1.c
Mean and Standard deviation for peak load and shear bond
strength 24 hours after tray removal 55
2.a
Comparison of peak load between subgroups 1 and 2
among different groups using paired t test 55
2.b
Comparison of peak load between subgroups 2 and 3
among different groups using paired t test. 56
2.c
Comparison of peak load between subgroups 1 and 3
among different groups using paired t test. 56
3.a
Comparison of Shear bond Strength between subgroups 1
and 2 among different groups using paired t test. 57
3.b
Comparison of Shear bond strength between subgroups 2
and 3 among different groups using paired t test. 57
3.c
Comparison of Shear bond strength between subgroups 1
and 3 among different groups using paired t test 58
4
Inter group Comparison of Peak Load at different time
5
Inter group Comparison of Shear bond strength at different
time intervals 59
6.a
Multiple comparison using bonferroni post hoc test for
Transbond XT, immediately after tray removal 59
6.b
Multiple comparison using bonferroni post hoc test for
Transbond XT, 30 minutes after tray removal 60
6.c
Multiple comparison using bonferroni post hoc test for
Transbond XT, 24 hours after tray removal 60
7.a
Multiple comparison using bonferroni post hoc test for
Enlight, immediately after tray removal 61
7.b Multiple comparison using bonferroni post hoc test for
Enlight, 30 minutes after tray removal 61
7.c
Multiple comparison using bonferroni post hoc test for
Enlight, 24 hours after tray removal 62
8.a
Multiple comparison using bonferroni post hoc test for
Discover, immediately after tray removal 62
8.b
Multiple comparison using bonferroni post hoc test for
Discover, 30 minutes after tray removal 63
8.c
Multiple comparison using bonferroni post hoc test for
Discover, 24 hours after tray removal 63
9.a
Multiple comparison using bonferroni post hoc test for
9.b Multiple comparison using bonferroni post hoc test for Ortho Lite at 30 minutes after tray removal 64
9.c Multiple comparison using bonferroni post hoc test for Ortho Lite, 24 hours after tray removal 65
10.a
Multiple comparison using bonferroni post hoc test for
Orthofix, immediately after tray removal 65
10.b
Multiple comparison using bonferroni post hoc test for
Orthofix, 30 minutes after tray removal 66
10.c
Multiple comparison using bonferroni post hoc test for
ACKNOWLEDGEMENT
I am extremely privileged and honoured for this opportunity to express my deep sense of gratitude to all those who have inspired me.
I would like to sincerely thank Thiru. Lion. Dr. K.S. Rangasamy, M.J.F., Founder and Chairman, KSR Group of Institutions for providing the opportunity of doing post-graduation in the Department of Orthodontics and Dentofacial Orthopaedics, KSR Institute of Dental Science and Research.
With immense gratitude and respect, I thank Dr. G. S. Kumar, M.D.S., Principal, KSR Institute of Dental Science and Research, for his kind support and encouragement, and making available all the facilities for the study.
I am immensely pleased to place on record my profound gratitude and heartfelt thanks to Dr. A. Raja, M.D.S., Professor and Head, Department of Orthodontics and Dentofacial Orthopaedics, for his constant guidance, generous help and valuable advice throughout the term of my study and course.
Words seems fewer to put across my gratitude to my guide Dr. S. Raja, M.D.S., Reader, who has been instrumental in shaping my views throughout the completion of my dissertation in all aspect. Sir, I solemnly express my deep felt gratitude for your valuable guidance and suggestions, tireless pursuit for perfection, constant support and keen surveilance for the minute details throughout this dissertation. I deem it as my privilege to work under his able guidance. I ever remain grateful to him.
I also thank Dr. Rehena, M.D.S., and Dr. P. L. Nagappan, M.D.S., senior lecturers for their valuable support towards completion of the dissertation, and supporting me through tough times during my study and course.
I take this opportunity to express my gratitude to my seniors and juniors and friends, for their valuable help and suggestions throughout this study.
At this juncture, I thank my parents, Dr. A. Ansari, and Mrs. B. Mumtaz Begum, whose selfless sacrificial life and their great efforts with pain and tears, and unceasing prayers have enabled me to reach the present position in life. I am forever indebted to my parents who planted this seed of idea to do this course and their encouragement in attaining my goal.
I owe my gratitude to my parents-in-laws, Mr. Syed Sulaiman, and Mrs. Farhana Begum, for understanding my situation throughout the course and supporting me when i need them the most.
I have no clue how to begin with saying thank you to my soul mate, my dearest husband and my best friend, Syed Yaser. I love you for everything, for being so understanding and for putting up with me through the toughest moments of my life. Thank you so much for making me strong enough to face boldly and handle alone, every hurdle in my life. I thank Almighty for enlightening my life with your presence.
Last but not least I thank Almighty for giving me the strength and stamina in accomplishing this dream into a reality, without whom this work would have been impossible. His mercy was with me throughout my life and ever more in this study. I thank Him for enlightening my soul with the respected love and compassion for everyone and allowing me to enter a field where I could practice this desire.
Page 1
INTRODUCTION
A pleasant esthetic look increases peoples’ self-confidence and the esthetic aspect is the
most frequent motive encouraging patients to undergo Orthodontic treatment1,2. Many
individuals would like to have benefits offered by high-quality orthodontic treatment, but do
not want to have braces that are visible to their friends and are cosmetically aware3.
Ceramic brackets have been popular as esthetic appliances and have been available for
clinical use for almost two decades. Ceramic appliances though have an esthetically pleasing
offer, there is always an increase in the frictional resistance and have decreased durability.
Under the grounds of invisible orthodontics, invisalign system also plays its significant
role in satisfying the demands of the patients seeking esthetic approach. Invisalign system
offers a series of clear aligner trays to the patients at definite time intervals for effecting tooth
movement. Invisalign system is completely digitized and more expensive when compared
with other invisible appliance therapy. Systemic reviews conclude that there is insufficient
evidence to determine the effectiveness of this clear aligner therapy. Only limited tooth
movements are possible with the invisalign system.
Lingual Orthodontics represents the best solution for meeting the needs of patients’
without the risk of damaging biomechanical efficiency4. It is the only treatment modality that
does not deteriorate the physical appearance of the patient during the treatment and it has
several obvious advantages over labial appliances.
Though it poses a great challenge in treating complex malocclusions like severe crowding
cases due to the decrease in the span of the archwire, modifications have been made in the
bracket designs and miniature lingual brackets have been introduced in the recent years to
Page 2
efficiency of successful lingual therapy in treating complex malocclusions. Thus, the
conventional labial therapy is no better than lingual technique in terms of biomechanics and
precision except for a few modifications.
Adult patients present with unique challenge of wanting to look good even during
orthodontic treatment and search for alternatives to metal or clear brackets thus continued and
then lingual bonded edgewise appliance for the first time was used by Dr.Craven Kurz of
Beverly Hills, California, and a significant contribution to adult orthodontics was made and
the foundation for Lingual Orthodontics was made. And finally, he created his own lingual
appliances by modifying labial appliances.
Clinicians find difficult to view the lingual surfaces directly, and the morphology of
the lingual dental surface differs from one individual to another. The lingual aspect has
morphological features like cingulum, marginal ridge, linguoincisal edge, lingual groove, etc.
Thus, it is very difficult to position lingual brackets accurately. So for these reasons, use of
indirect bonding system is a must in lingual orthodontics.
Indirect bonding method was first introduced by Elliot Silverman and Morton Cohen5,6
(1972) to achieve a more accurate and efficient bracket placement system. This system
involves bracket placement in the laboratory on a plaster model and transfer of these
attachments to the patient mouth by means of a tray, where they are bonded to the etched
enamel7. Orthodontist can visualize the tooth in three dimensions by placing the brackets on
stone model before placement in the mouth. This allows the brackets to be more precisely
positioned on the tooth and might decrease the need to reposition brackets later in the
treatment8.
Bonding materials and bonding systems have undergone continued improvement over
time when Buonocore in 1955 first introduced a method of enamel etching to enhance
Page 3
were the chemically cured composites (self cure). Recently, improvements have been made in
the curing methods, with the most recent method being the light curing of the resins9.
Historically, bonding agents have been classified into seven generations based on the
manner in which they treat the smear layer. In those seven generations, the fifth generation
bonding system uses first a 37% phosphoric acid etchant which is applied to the tooth surface
and then the bonding agent applied followed by the adhesive resin which is more reliable in
providing optimal bond strength and currently used by most practitioners for orthodontic
bonding.
The most important factor to be considered is the shear bond strength of the orthodontic
adhesives. Shear bond strength is the measure of stress required to fracture a material. There
are studies in which the strength of the bond to tooth surfaces has been measured using wide
range of etchants and adhesives10. The clinical results obtained till date in these studies
indicate that the bond strengths of the adhesives are far above than those required in the field
of orthodontics. However, these studies do not consider the least bond strength required to
retain the brackets on the teeth throughout treatment. Hence, an orthodontic adhesive should
require not only sufficient strength to resist fracture overtime, but should also have enough
Page 4
AIM AND OBJECTIVES OF THE STUDY AIM:
The aim of this in vitro study is to evaluate the effect of time on bond strength of lingual
brackets in indirect bonding with five different base composite and sealant combinations.
OBJECTIVES:
1) To evaluate the effect of time on bond strength of different orthodontic adhesive
combinations.
Page 5
REVIEW OF LITERATURE
Kambiz Moin et al in 197811, assessed the shear bond strength measurements of unfilled and filled resin combinations to determine if the bond strength can be decreased by this means to provide
easy removal after debonding without sacrificing the adequency of the bond strengths needed for the
completion of treatment. They concluded that the unfilled or filled resins appear to have great
potential for orthodontic purposes in conjunction with mesh pads covered with a solid metal base.
Richard et al in 198812, evaluated the bond strength and failure location between indirect
bonding and direct bonding techniques by bonding orthodontic brackets having foil-mesh bonding
pads on extracted human premolars. In indirect bonding technique, one part of the unfilled resin was
applied to the teeth and the other part to the composite which was already bonded to the brackets, and
the silicone positioner with brackets was then placed onto the teeth. There were marginal voids in
two-thirds of indirect bonds among which one third were left defective. Direct, void-free indirect and
sealed indirect bonds showed no significant difference in strength whereas indirect bonds with voids
were only half as strong indicating that sealing around the brackets immediately after positioned
removal may be required. They concluded that, indirect bonding provides bond strength and easier
debonding similar to direct bonding.
Rod Greenlaw et al in 198913, evaluated visible light-cured resin system in orthodontic
bonding on 69 premolars and found that the 30-hour bond strength was one half less in visible
light-cured resin system than that of chemically light-cured resin system and enamel loss with debonding and
cleanup procedures was also less in visible light-cured resin system.
Alan J. Ostertag et al in 199114, evaluated the effect of the changes done in the concentration
of adhesive filler on shear, torsional, and tensile bond strength of chemical, mechanical and
chemical/mechanical retained ceramic brackets by bonding 210 bovine teeth with one of three types
Page 6 shear, torsional or tensile force to check the bond strength and the bond failure site. They found that
80% filled adhesive showed significantly greater shear bond strength (SBS) and torsional bond
strength (TBS) than the other filled adhesives. Even the mechanically retained ceramic brackets
showed the same and the bond failure site was at the bracket-adhesive interface.
Robert Terrell Smith et al in 199315, compared the shear bond strength of the three different
dual cements with seven currently available chemically cured and light cured composite resins for
bonding stainless steel mesh-backed orthodontic brackets. They found that the ‘thin’ dual cements
had higher bond strength than the other cements while fluoride releasing dual cement had reduced
bond strength. The “thick” dual cement showed no statistically significant difference. Increased
control of the setting time of the dual cements helps for the correct positioning of the bracket and to
remove excess resin before curing.
Andrew L. Sonis in 199616, examined the surface characteristics of failed bracket bases with
scanning electron microscopy after air abrasion and compared the shear bond strength (SBS) between
failed air abraded brackets and new untreated brackets, by bonding new untreated brackets on 30
extracted human mandibular premolars and bonding previously used brackets on another 30
premolars and found no significant difference in SBS between two groups and concluded that
immediate reuse of failed bonded metal brackets is possible with air abrasion.
L. M. Trimpeneers et al in 199617, compared the failure rates between visible light-cured
fluoride-releasing material and chemically cured adhesive, by bonding brackets on 50 patients in a
split-mouth experimental design and they found that the premolars showed weakest bond strength
than incisors and canines, and there were more bond failures in lower teeth than the upper ones.
Pramod K. Sinha et al in 199718, evaluated the potential of matrix-bound fluoride –releasing adhesives (MBF) for orthodontic purpose by comparing the shear bond strength (SBS) and remnant
Page 7 using light-cured MBF and self-cured MBF in separate groups with 5 or 6 nonflouride releasing
resins bonding orthodontic metal brackets on 210 freshly extracted bovine incisors. Light cured MBF
showed higher SBS but lower ARI scores and self-cured MBF showed no difference in bond strength
but had lower ARI scores than other orthodontic adhesives.
Marc E. Oslen et al in 199719, compared the traditional acid-etch bond technique with that of air abrasion of human enamel and evaluated the parameters such as shear bond strength, bond failure
location and enamel surface preparation as viewed through a scanning electron microscope. The
study concluded that the air abrasion of the enamel surface showed lower and clinically
unsatisfactory shear bond strength regardless of the particle size and no adhesive remained on the
enamel surface during debonding.
Shouichi Miyawaki et al in 199920, conducted a retrospective questionnaire survey on 111
retention period patients to evaluate the rate, level and period of discomfort caused by bonded lingual
orthodontic appliances compared with edgewise labial appliances. In the study apart from discomfort,
57% to 76% of patients experienced tongue soreness, difficulty in chewing, speech and tooth
brushing. In 20 % to 46% of patients the aforementioned discomfort reduced with time after the
removal of the appliance. Upper and lower lingual bracket application caused equal levels of tongue
soreness. They observed that tongue soreness, teeth pain and chewing difficulty were greater in
deeper bites whereas increased overjet increased the level of tongue soreness.
Samir E.Bishara et al in 199921, determined the shear bond strength of orthodontic brackets
bonded to human molars with one of three methods. Group I teeth etched with 37% phosphoric acid
and bonded with Transbond XT acted as control group, Group II etched with acidic primer and
bonded with Transbond XT , and Group III etched with 20% polyacrylic acid and bonded with glass
ionomer adhesive . Glass ionomer adhesive system and Acidic primer system showed significantly
Page 8
S. E. Owens et al in 200022, evaluated the shear bond strength (SBS) and bond failure for 2 visible light-cured composites and a resin-modified glass ionomer cement (RMGIC) by bonding
brackets on 75 extracted human premolars and they found that, the light-cured composites showed
higher SBS than RMGIC.
Larry White et al in 200123, Developed a new improved method for indirect bonding, where
the use of prompt L-Pop, a self etching adhesive; Quick cure composite and a Power Slot curing light
tip can greatly expedite light cured indirect bonding. As the etching progress, the pH of the
phosphoric ester rises due to neutralization of the acidic monomers and this stops the
demineralization. Addition to the mechanical attachment, a chemical bond occurs between the
calcium hydroxyl apatite and the phosphoric esters of Prompt L-Pop. Brackets were positioned on the
model using Tacky Glue cement and the transfer tray was fabricated using hot glue material. The
bracket bases were microetched and dried. Prompt l-Pop ingredients were mixed and rubbed over the
enamel for a few seconds and the teeth were dried and glue matrices were positioned in both arches.
The curing light with power Slot tip was quickly passed over the teeth in both arches to initiate
polymerization, 5 seconds per tooth. They concluded that the light cured indirect bonding with
conventional curing tip required 20 minutes to bond the maxillary and mandibular arches, but the
Power Slot tip required only seven minutes for complete bonding of both the arches and save a 65%
clinician time.
Samir E.Bishara et al in 200124, conducted a study to determine the effects of self-etch primer (SEP) on shear bond strength (SBS) of orthodontic brackets by bonding them to 45 extracted
human molars, and found the adhesive remnant index scores indicated more residual remaining on
the SEP treated teeth concluding that the SEP showed a significantly lower SBS.
Vittorio Cacciafesta et al in 200325, assessed shear bond strengths of orthodontic brackets
light-Page 9 cured composite resin. These primers were applied to dry, water-moistened, and saliva- moistened
enamel surfaces. They found non-contaminated enamel surfaces had highest bond strength. Self
etching primer showed high bond strength than hydrophilic or conventional primers.
Irene L. Zeppicri et al in 200326, investigated the effect of contamination of saliva on shear bond strength (SBS) of an orthodontic adhesive used to bond brackets on 162 extracted premolars
with Moisture-Insensitive Primer (MIP) and Self-Etching Primer (SEP) under different experimental
contaminations using Hydrophobic primer as control group. They found that Hydrophobic Primer
and MIP in dry field showed higher SBS, and MIP showed lower SBS than SEP in saliva
contamination field.
Y.D. Aljubouri et alin 200327, compared the mean bonding time, mean shear bond strength
and mean survival time of brackets bonded with light-cure composite using a self-etching primer
(SEP) and conventional two stage system by bonding brackets to 30 premolars, and they found that
SEP group significantly reduced the bonding time and showed less SBS. And found no difference in
survival time of brackets bonded by each system.
Samir E. Bishara et al in 200428, conducted a study to assess and compare the effects of 1
component and 2 component self etch primers on shear bond strengths of orthodontic brackets which
are bonded on extracted human molars. The findings showed no significant difference between shear
strength of mix and no-mix self-etch primers/bonding system. Only difference was the no-mix self
etch primer saved a step in bonding procedure than the 2 component system.
Silvia Geron et al in 200429, conducted a study to evaluate the effect of intrusive or extrusive
forces on tooth movement by comparing labial orthodontics (LaO) with lingual orthodontics (LiO)
and they found that in LaO when extrusive force was applied, it resulted in labial root movement
from a retroclination of 20 degree upto proclination of 45 degree whereas in LiO extrusive force
Page 10 concluded that application of lingual force is more complicated and its effect depends on initial
inclination of the tooth and bracket position.
T. M. Hodge et al in 200430, compared the accuracy of direct and indirect bonding techniques
in 26 patients who required upper and lower full arch fixed appliances using preadjusted edgewise
brackets with a 0.022-inch slot. According to a split mouth system of allocation the brackets were
bonded directly or indirectly and photographs were made before and after bond-up to determine the
differences from the ideal. Results showed that there is no difference between mean bracket
placement errors for direct or indirect methods and the range of error in three directions assessed
were greater for direct than indirect placement.
Omur Polat et al in 200431, evaluated in vitro the differences in the shear bond strength of
two commonly used sytems such as Therma cure Laboratory resin and Transbond XT in 60 extracted
human premolars, and compared the bond survival rates in vivo in 15 patients. The study concluded
that bonding the teeth indirectly using any of the two systems provides sufficient strength for optimal
clinical results and there were no significant differences between the bond survival rates of the two
systems.
Peter G. Miles et al in 200532, studied the clinical performance of indirect bonding technique
using chemically cured composite bonding resin MC with light- cured resin FF in 112 patients over
six months. Both adhesives evaluated in the study (MC and FF) gave clinically satisfactory results for
usage in indirect bonding of brackets. The failure rates were low when comparing the
chemically-cured MC adhesive with the light-chemically-cured FF making both easy for clinical use.
Omur Polat et al in 200533, determined the effects of chlorhexidine varnish on the shear bond strength of metallic orthodontic brackets in sixty non-carious extracted premolar bonded with indirect
bonded resin by comparing with an indirect bonded group and a direct bonded group prepared with
Page 11 concluded that indirect bonding of brackets after the application of chlorhexidine varnish showed
reduction in the shear bond strength when compared with the other groups. The site of failure during
debonding was not significantly altered by the application of an antimicrobial agent before indirect
bonding resin.
Brandson James Linn et al in 200634, compared the shear bond strength and bond failure sites for brackets bonded to 60 extracted human premolar teeth in direct bonding technique using
light-cured adhesive and primer, and two indirect bonding techniques using light cure primer in one
technique and a chemical-cured primer in other. Adhesive remnant index (ARI) score was
determined for each tooth. Both the techniques showed clinically satisfactory bond strength and 90%
survival rate at normal masticatory and orthodontic force levels. Indirect bonding with
chemical-cured primer showed lower ARI score when compared with others.
Heike Maria Korbmacher et al in 200635, evaluated the shear bond strength (SBS) of an
antimicrobial self etching primer in combination with fluoride releasing adhesive by bonding
brackets on 120 extracted human premolars and they found that antimicrobial combination group
showed higher SBS than fluoride releasing adhesive group and composite adhesive group.
Nuray Attar et al in 200736, evaluated the effects of one-step and fluoride releasing two-step
self-etching primer and adhesive with fluoride releasing conventional acid-etching and bonding
system on the shear bond strength of orthodontic brackets. Brackets were bonded on extracted
premolars and were stored in deionized water at 37◦C for 48 hours. They concluded that the one-step
and two-step fluoride releasing self-etching adhesive have mechanical properties that are satisfactory
for orthodontic purposes.
Nir Shpack et al in 200737, examined the torque error (TqE) and rotation deviation (RotD)
between labial and lingual systems for both direct and indirect bonding techniques. Study was done
Page 12 compared. Torque error and rotation deviation were measured. It was found that the absolute TqE
and RotD were significantly more accurate in direct than in indirect bonding technique in both
bracket systems. No significant differences were found when comparing labial vs lingual method.
TqE was greater in maxillary second premolar, mandibular central and lateral incisors. For both the
systems, indirect bonding significantly reduces absolute TqE and RotD.
Tamer Turk et alin 200738, conducted a study to evaluate shear bond strength(SBS) of
self-etching primer following saliva contamination at different debond times on 240 premolars which
were divided into uncontaminated group, saliva contamination after priming , saliva contamination
before priming, saliva contamination before and after priming group. There was gradual increase in
SBS from 5 minutes to 24 hours in all groups but was found to be higher in control group at 24 hours.
S. Thomas Deahl et al in 200739, used the practice-based research methodology to evaluate direct Vs indirect bonding and compared the bond failure prevalence, treatment time, number of
appointments between orthodontists who use both the techniques. Among the study sample 5
orthodontists (772 patients) used direct bonding technique and 6 (596 patients) used indirect bonding
technique were a total of 29,963 brackets in 1368 patients were examined. They found that both the
techniques do not differ significantly in the prevalence of debonding or in mean treatment time and
number of appointments per patient. Direct bonding was far more common than indirect bonding.
Michael A. Thompson et alin 200840, conducted a study to determine the effect of different custom base methods on shear bond strength (SBS) in indirect bonding. The custom base variables
were filled flowable composite resin, light air-abrasion of cured composite bracket pad, and wetting
the cured composite bracket pad with an unfilled resin. They found that Air abrading orthodontic
bracket-pad composite surface increased the SBS.
Page 13 SNA and SNB angles are used for assessing the level of tongue space restriction after placing the
lingual brackets. If angles are found to be small, then those patients are prone to discomfort.
Philip P. Soo et al in 200942, conducted a study to evaluate whether white defect layer which
sometimes appear on custom resin base when brackets are bonded to the stone model is related to
oxygen inhibition or not, by using hydrophilic and hydrophobic adhesives. They found that, the white
defect layer originated from oxygen inhibition during curing followed by resin leaching when
hydrophilic adhesives were used.
Firat Ozturk et al in 200943, compared the effects of direct and indirect bonding techniques on the shear bond strength of brackets and micro leakage of a tooth-adhesive-bracket complex after
thermocycling. Light cured adhesive and a primer were used for direct bonding whereas a light cured
adhesive and chemical-cured primer was used for indirect bonding. Thermocycling was carried out
after polymerization and the microleakage was assessed using a stereomicroscope. They concluded
that there are no significant differences in shear bond strength between direct and indirect bonding
techniques. The amount of micro leakage is not affected by the type of bonding technique.
Rogelio Jose Scougall Vilchis et al in 200944, assessed the shear bond strength of orthodontic
brackets bonded with 4 self-etching adhesives in 175 extracted premolars. After bonding, the teeth
were stored in distilled water at 37◦C for 24 hours and debonded with a Universal Testing Machine.
Evaluation of adhesive remnant index and conditioned enamel surfaces under SEM were observed.
Shear bond strength of teeth that were bonded with Transbond Plus and Tranbond XT were
significantly higher but showed significant differences in the ARI and enamel fracture scores.
Julio P. Cal-Neto et al in 201145, tested the mean shear bond of indirectly bonded lingual brackets prepared with or without sandblasting prior to acid etching on 40 extracted human premolar
teeth which was divided into 20 equal groups. Group I (control) were teeth etched with 37%
Page 14 surfaces were sandblasted with 50 µm aluminium oxide powder followed by etching and bonding as
in group I. The amount of adhesive on the enamel after debonding was significantly higher for group
II than group I emphasizing that intraoral sandblasting prior to enamel etching increased the bond
strength of the lingual brackets.
Domenico Dalessandri et al in 201246, assessed the effectiveness of indirect bonding technique in decreasing the plaque accumulation and demineralization of the surrounding enamel on
30 patients bonded with split mouth approach. Plaque accumulation index (PAI) was used to record
the presence of plaque around the brackets and the presence of demineralization. They concluded that
indirect bonding technique significantly reduced the plaque accumulation around the brackets during
first 4 months after placement and also reduction in demineralization during the orthodontic
treatment.
Padhraig S. Fleming et al in 201347, reviewed randomised control trials and controlled
clinical trials to compare bracket failure risks and time taken to place attachments with three light
curing systems such as Halogen, LED, and Plasma arc during bonding of orthodontic brackets. They
concluded that there were no significant differences in the risk of bond failure with three light curing
systems and the choice of curing light system should be based on chairside time considerations, cost
and longevity.
Dale A. Nichols et al in 201348, compared indirect bonding with direct placement of orthodontic brackets by assessing the ability of 5 orthodontists to place orthodontic brackets in the
same positions on the 10 different casts of crowded dentitions at 3 time period for an indirect bonding
setup. Consistency was evaluated using cone beam computed tomography (CBCT) technology
combined with computer-aided modelling software to superimpose and evaluate bracket positions 3
Page 15 consistent in selecting the same positions at future times. The maximum difference will be less than
1.25mm when bracket positions are selected.
Thomas Ziebura et al in 201449, assessed the frequency and localizations of bond failures
(BF) in patients treated with either lingual or buccal appliances in both dental arches through a
retrospective investigation by processing consecutive patient records from 3 experienced
practitioners. In lingual group, bonding was carried out indirectly by simultaneously applying
Maximum cure Sealant A and B, Reliance Orthodontic Products, Itasca, III) on the surface to be
bonded and the brackets in the silicone transfer tray whereas in buccal group bonding was done
directly by applying Maximum cure Sealant A and B on the teeth and Reliance Orthodontic Products
on the brackets. They found that within 1 year of treatment, 2.62 BFs per patient can be expected,
regardless of the kind of appliance used.
Lylian Kazuni Kanashiro et al in 201450, evaluated the effect of two adhesion boosters on
shear bond strength and bond failure sites in indirect bonding technique using Adhesive Remnant
Index (ARI). One group was bonded using only Sondhi adhesive whereas the other 2 groups were
applied adhesion boosters like Enhance Adhesion Booster and Assure Universal Bonding Resin
respectively before bonding. They found that there was increase in the shear bond strength in indirect
bonding technique and higher ARI score in the group that used Assure Universal Bonding Resin.
Ana E. Castilla et al in 201451, conducted a study to measure and compare the transfer
accuracy of brackets with five different indirect bonding techniques which are double polyvinyl
siloxane (double-PVS), double vacuum-form (double-VF), polyvinyl siloxane vacuum-form
(PVS-VF), single vacuum-form (single-VF) and polyvinyl siloxane putty (PVS-putty) and they were
fabricated on 25 stone working models .They found that silicone-based trays showed consistently
high accuracy in bracket transfer whereas double-VF and single-VF were significantly less accurate
Page 16
Thorsten Grunheid et al in 201652, conducted a study where they elicited the magnitude
and frequency of bracket positioning errors caused when the brackets are transferred to the patient
dentition from the dental casts using vinyl polysiloxane trays and CBCT scan were used to capture
the final bracket positioning on the teeth and they found that poly vinyl siloxane transfer trays
provide high positional accuracy in indirect bonding.
Kutalmis Buyuk et al in 201753, investigated the effects of different etching methods and
bonding procedures on shear bond strength of orthodontic metal brackets which were applied to
different types of CAD/CAM ceramic materials. These ceramic specimens were separated into four
subgroups, according to type of surface treatment and bonding onto the ceramic surface. In each
group, four subgroups were prepared by phosphoric acid, hydrofluoric acid, Transbond XT primer,
and Clearfill Ceramic primer and they found that CAD/CAM material types and bonding procedures
affected bond strength, but the etching procedure did not have any effect on the bond strength.
Tavares et al in 201854, compared the effects of different types of primers, orthodontic
bonding techniques and debonding methods on shear bond strength, color change and enamel
roughness by bonding brackets on seventy bovine incisors which were distributed into seven groups:
control (no bonding), direct, and 5 indirect bonding groups. They found that, direct and indirect
bonding techniques have similar results, and all the types of primers used show satisfactory adhesion
strength. They concluded that, enamel roughness increases with the use of burs and polishers, but
polishers ensure greater integrity of the initial roughness and the resin tags does not change the color
of the teeth.
Page 17
MATERIALS AND METHODS SAMPLE SELECTION:
Ninety premolar teeth extracted for Orthodontic purposes were selected for the
study. The teeth which meet the selection criteria were chosen for the study.
Inclusion criteria:
The teeth meeting the following criteria were included for the study. The teeth with,
1) No dental caries
2) No hypoplasia/Fluorosis
3) No restorations
4) Enamel surface with no cracks
5) No developmental anomalies
MATERIALS USED:
1. 90 conventional lingual premolar brackets (Fig.1 a,b)
2. Five base composite sealant combinations
I. Transbond XT light cure adhesive and Transbond XT Plus Primer (3M) (Fig. 2)
II. Enlight light cure adhesive and Orthosolo universal bond enhancer (Ormco)
(Fig.3)
III. Discover light cure adhesive and Discover bonding resin (Discover) (Fig.4)
IV. Ortho Lite light cure adhesive and Ortho Lite cure sealant (Orthosource) (Fig.5)
V. Orthofix light cure adhesive and Orthofix light cure Primer
Page 18
3. 3% Sodium Hypochlorite solution (Fig.7)
4. Alginate impression material (Zhermack) (Fig.8)
5. Cold cure resin (DPI-RR) (Fig.9)
6. Orthokal (Kalabhai) (Fig.10)
7. Cold mould seal (DPI) (Fig.11)
8. Vinyl polysiloxane impression material (Zetaplus) (Fig.12)
9. Sandblasting machine (MicroJato) (Fig.13)
10. Pumice prophylaxis
11. Wax sheet (Fig.14)
12. Bracket holder (Fig.15)
13. Light cure Unit (3M Espe) (Fig.16)
14. Universal Testing machine (Fig.17)
METHODOLOGY:
Finally the selected teeth, were equally divided into Five Major Groups A, B, C, D and E
with each Group having 3 Subgroups 1, 2 and 3.
Each Subgroup contains 6 specimens.
Five base composite-sealant combinations were investigated using conventional lingual
brackets.
Page 19
Group B - Enlight light cure adhesive and Orthosolo universal bond enhancer
(Ormco)
Group C - Discover light cure adhesive and Discover bonding resin (Discover)
Group D - Ortho Lite light cure adhesive and Ortho Lite cure sealant (Orthosource)
Group E - Orthofix light cure adhesive and Orthofix light cure Primer (Anabond
Stedman)
90 premolar teeth were soaked in 3% sodium hypochlorite solution before experiment.
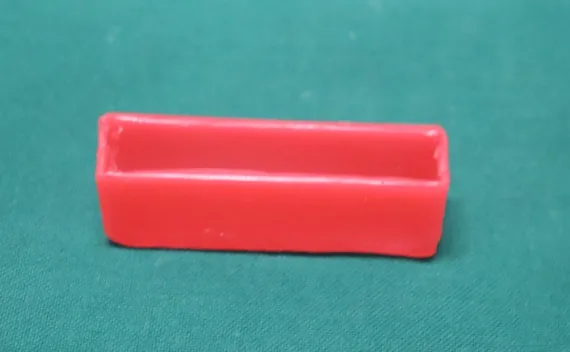
Wax sheets were used to prepare mould (Fig.18) for the 6 specimens of each group to be
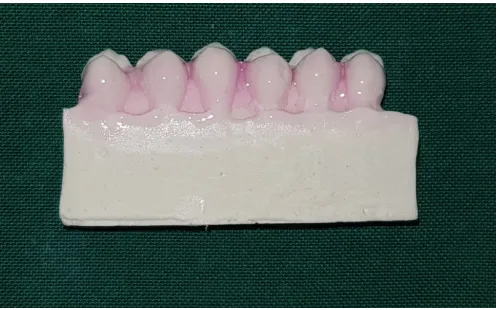
embedded in the cold cure acrylic block (DPI) (Fig.19). Alginate impression (Zhermack) for
each group were taken and study model were made using Orthokal (Kalabhai) (Fig.20 b,c,d).
Cold mould seal (DPI) was applied over lingual surfaces of study model teeth.(Fig.21)
7th Generation Conventional Lingual Brackets were used in this study to be bonded on study
model with different base composites
In group A – Transbond XT light cure adhesive
Group B – Enlight light cure adhesive
Group C - Discover light cure adhesive
Group D – Ortho Lite light cure adhesive
Group E – Orthofix light cure adhesive
The brackets with the adhesives were bonded on the study model teeth with light cure unit of
Page 20
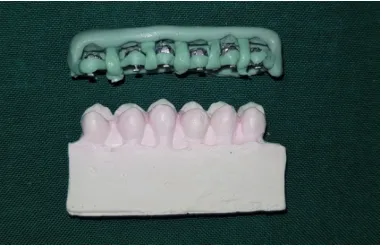
Transfer trays were prepared for all the 15 groups using vinyl polysiloxane impression
material (Zetaplus) (Fig.23 a,b). After transfer tray was set, they were soaked in warm water
for 30 minutes and then removed from study models. (Fig.24)
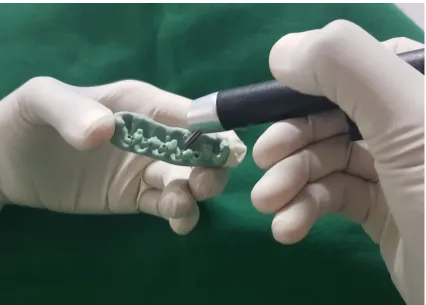
The composite adhesives on custom bracket base were cleaned by sandblasting
(MicroJato) for 3 seconds (Fig.25).
The natural teeth embedded in cold cure acrylic were cleaned using pumic prophylaxis
(Fig.26) and were etched (Scotchbond) for 30 seconds (Fig27), and the corresponding
sealants of base composite were applied to the bracket base (Fig 28).
Group A- Transbond XT Plus Primer
Group B – Orthosolo universal bond enhancer
Group C - Discover bonding resin
Group D- Ortho Lite cure sealant
Group E - Orthofix light cure Primer
Then the transfer trays with the brackets were placed on the natural teeth and bonded using
light cure unit with curing time 20 seconds (Fig 29).
After bonding, transfer trays were removed (Fig 30).
Shear bond strength were evaluated by debonding the brackets using universal testing
machine (Fig 31) for
A1, B1, C1, D1, E1 – immediately after tray removal.
A2, B2, C2, D2, E2 – 30 minutes after tray removal.
Page 21
The data collected were compiled using MS-Office Excel and was subjected to Statistical
analysis using IBM corp. SPSS (Statistical package for social sciences). Statistics for
Windows,Version 20.0 (Armonk, NY). Statistical significance was set at P < 0.05.
Descriptive analysis and inferential statistics were used to analyze the data collected.
Normality of the data was assessed. Intra group comparisons were done using paired t test
and Inter group comparison between 5 groups was done using ONEWAY ANOVA followed
by Bonferroni post hoc test.
Page 22
(b)
Fig 1. Conventional Lingual Premolar brackets
Fig 2. Transbond XT light cure adhesive and Transbond XT Plus Primer (3M)
[image:45.612.124.520.151.283.2] [image:45.612.97.508.390.629.2]Page 23
Fig 3. Enlight light cure adhesive and Orthosolo universal bond enhancer (Ormco)
Page 24
Fig 5. Ortho Lite light cure adhesive and Ortho Lite cure sealant (Orthosource)
Page 25
Fig.7. 3% Sodium Hypochlorite solution
Page 26
Fig 9. Cold cure resin (DPI-RR)
Page 27
Fig 11. Cold mould seal (DPI)
Page 28
[image:51.612.188.399.101.389.2]
Fig 13. Sandblasting machine (MicroJato)
Page 29
Fig 15. Bracket holder
Page 30
Page 31
Fig 18. Mould for Acrylic block
[image:54.612.163.448.104.280.2]
Fig 19. Color coded acrylic blocks of natural teeth Group A
Group B
Group C
Group D
Group E
(1)Immediate after tray removal
(2)30 minutes after tray removal
(3)24 hours after tray removal
Page 32
Fig 20. (a) A subgroup consisting of 6 teeth embedded in acrylic block; (b) Impression
method for the working model; (c) Alginate impression of the acrylic block; (d) Working
[image:55.612.94.518.68.390.2]model made of Orthokal
Fig 21. Cold mould seal applied on the lingual surface of the working model
(a) (b)
[image:55.612.183.433.532.687.2]Page 33
Fig 22. Light curing of the 7th generation conventional lingual brackets with the adhesive
Fig 23. (a), (b). Fabrication of transfer tray using Polyvinyl siloxane impression material
Fig 24. Removal of the transfer tray along with the bonded lingual brackets
[image:56.612.129.516.351.501.2] [image:56.612.212.403.563.687.2]Page 34
Fig 25. Sandblasting of the base composite done
Page 35
Fig 27. Application of etchant on the natural teeth
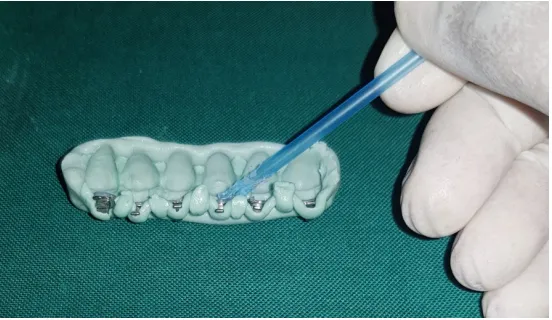
[image:58.612.170.446.407.567.2]Page 36
Fig 29. Placement of transfer over the natural teeth followed by light curing of the brackets
[image:59.612.175.440.394.644.2]Page 37
Fig 31. Shear bond strength tested using Universal Testing Machine
Page 38
[image:62.612.88.490.226.337.2]STATISTICAL ANALYSIS
Table 1:Mean and Standard Deviation for Peak Load and Shear Bond Strength at Three Time Periods.
a) Mean and Standard deviation for peak load and shear bond strength immediately after
tray removal (subgroup 1).
GROUP MEAN STANDARD DEVIATION
PEAK
LOAD(N) SHEAR BOND STRENGTH LOAD(N) PEAK SHEAR BOND STRENGTH
Transbond XT 42.81083 2.9005 8.720689 0.590696
Enlight 66.11933 4.47667 25.855075 1.750503
Discover 27.59883 1.87000 10.130475 0.686479
Ortho Lite 28.21517 1.91283 13.724196 0.929958
Orthofix 26.15500 1.76900 8.245930 0.559084
b) Mean and Standard deviation for peak load and shear bond strength 30 minutes after
tray removal (subgroup 2).
GROUP MEAN STANDARD DEVIATION
PEAK LOAD(N)
SHEAR BOND STRENGTH
PEAK LOAD(N)
SHEAR BOND STRENGTH
Transbond XT 57.07250 3.86717 13.532319 0.915583
Enlight 90.06567 6.10150 22.226448 1.505706
Discover 39.68133 2.69267 15.485023 1.059623
Ortho Lite 38.47317 2.60600 32.854060 2.225476
Page 39
c) Mean and Standard deviation for peak load and shear bond strength 24 hours after
tray removal(subgroup 3).
GROUP MEAN STANDARD DEVIATION
PEAK
LOAD(N) SHEAR BOND STRENGTH LOAD(N) PEAK SHEAR BOND STRENGTH
Transbond XT 102.59167 6.95083 32.764754 2.219942
Enlight 151.07950 10.19333 30.005856 2.074383
Discover 39.38483 2.67167 27.145618 1.837002
Ortho Lite 51.80167 3.50933 14.858510 1.006905
[image:63.612.199.416.378.464.2]Orthofix 76.27100 5.16650 15.958632 1.079221
Table 2:Intra group comparison of peak load among different groups.
a) Comparison of peak load between subgroups 1 and 2 among different groups.
b) Comparison of peak load between subgroups 2 and 3 among different groups using
paired t test.
GROUP t p value
Transbond XT -2.761 0.040
Enlight -3.281 0.022
Discover 0.023 0.983
Ortho Lite -1.119 0.314
Orthofix -8.589 0.000
GROUP t p value
Transbond XT -1.848 0.124
Enlight -2.348 0.066
Discover -3.399 0.019
Ortho Lite -0.0688 0.522
Page 40
c) Comparison of peak load between subgroups 1 and 3 among different groups using
paired t test.
GROUP t p value
Transbond XT -3.977 0.011
Enlight -4.690 0.005
Discover -1.000 0.363
Ortho Lite -2.609 0.048
[image:64.612.179.422.160.243.2]Orthofix -5.550 0.003
Table 3: Intra group comparison of Shear bond strength among different groups using paired t test.
a) Comparison of Shear bond strength between subgroups 1 and 2 among different
groups using paired t test.
b) Comparison of Shear bond strength between subgroups 2 and 3 among different
groups using paired t test.
GROUP t p value
Transbond XT -1.851 0.123
Enlight -2.352 0.065
Discover -3.361 0.020
Ortho Lite -0.687 0.523
Orthofix -1.869 0.121
GROUP t p value
Transbond XT -2.760 0.040
Enlight -3.189 0.024
Discover 0.024 0.982
Ortho Lite -1.120 0.314
Page 41
c) Comparison of Shear bond strength between subgroups 1 and 3 among different
[image:65.612.189.425.171.253.2]groups using paired t test.
[image:65.612.86.526.551.641.2]Table 4. Inter group Comparison of Peak Load at different time intervals.
Table 5. Inter group Comparison of Shear bond strength at different time intervals
GROUP t p value
Transbond XT 3.977 0.011
Enlight 4.678 0.005
Discover 1.006 0.361
Ortho Lite 2.606 0.048
Orthofix 5.560 0.003
SUBGROUP PEAK LOAD (N) p value
Sum of Squares
Mean Square
F
Immediately 6947.463 1736.866 7.870 0.000
After 30 minutes 12538.272 3134.568 7.642 0.000
After 24 hours 47592.227 11898.057 18.671 0.000
SUBGROUP PEAK LOAD (N) p value
Sum of Squares
Mean Square
F
Immediately 31.841 7.863 7.960 0.000
After 30 minutes 57.503 7.622 14.376 0.000
Page 42
Table 6: Multiple comparison using bonferroni post hoc test for group A at different time intervals
a) Subgroup 1
b) Subgroup 2
SUBGROUP 1
(T) GROUP (Y) GROUP BONFERRONI DEPENDENT VARIABLE
PEAK LOAD(N) SHEAR BOND STRENGTH
MEAN DIFFERENC E (T-Y)
p value MEAN
DIFFERENCE (T-Y)
p value
Transbond XT Enlight -23.308500 0.118 -1.576167 0.119
Discover 15.212000 0.883 1.030500 0.883
Ortho Lite 14.595667 1.000 .987667 1.000
Orthofix 16.655833 0.635 1.131500 0.628
SUBGROUP 2
(T) GROUP (Y) GROUP BONFERRONI DEPENDENT VARIABLE
PEAK LOAD(N) SHEAR BOND STRENGTH
MEAN DIFFERENCE (T-Y)
p value MEAN
DIFFERENCE (T-Y)
p value
Transbond XT Enlight -32.993167 0.092 -2.234333 0.093
Discover 17.391167 1.000 1.174500 1.000
Ortho Lite 18.599333 1.000 1.261167 1.000
Page 43
[image:67.612.106.510.106.291.2]c) Subgroup 3
Table 7:Multiple comparison using bonferroni post hoc test for group B at different time intervals.
a) Subgroup 1
SUBGROUP 3
(T) GROUP (Y) GROUP BONFERRONI DEPENDENT VARIABLE
PEAK LOAD(N) SHEAR BOND
STRENGTH MEAN
DIFFERENC E (T-Y)
p value MEAN
DIFFERENCE (T-Y)
p value
Transbond XT Enlight -48.487833 0.027 -3.242500 0.032
Discover 63.206833 0.002 4.279167 0.002
Ortho Lite 50.790000 0.018 3.441500 0.019
Orthofix 26.320667 0.830 1.784333 0.844
SUBGROUP 1
(T) GROUP
(Y) GROUP BONFERRONI DEPENDENT VARIABLE
PEAK LOAD(N) SHEAR BOND STRENGTH
MEAN DIFFEREN CE (T-Y)
p value MEAN
DIFFERENCE (T-Y)
p value
Enlight Transbond XT 23.308500 0.118 1.576167 0.119
Discover 38.520500 0.001 2.606667 0.001
Ortho Lite 37.904167 0.002 2.563833 0.002
Page 44
b) Subgroup 2
c) Subgroup 3
SUBGROUP 2
(T) GROUP
(Y) GROUP BONFERRONI DEPENDENT VARIABLE
PEAK LOAD(N) SHEAR BOND STRENGTH
MEAN DIFFERENCE (T-Y)
p value MEAN
DIFFERENCE (T-Y)
p value
Enlight Transbond XT 32.993167 0.092 2.234333 0.093
Discover 50.384333 0.002 3.408833 0.002
Ortho Lite 51.592500 0.002 3.495500 0.002
Orthofix 54.808500 0.001 3.712833 0.001
SUBGROUP 3
(T) GROUP
(Y) GROUP BONFERRONI DEPENDENT VARIABLE
PEAK LOAD(N) SHEAR BOND STRENGTH
MEAN DIFFEREN CE (T-Y)
p value MEAN
DIFFERENCE (T-Y)
p value
Enlight Transbond XT 48.487833 0.027 3.242500 .032
Discover 111.694667 0.000 7.521667 .000
Ortho Lite 99.277833 0.000 6.684000 .000
Page 45
Table 8:Multiple comparison using bonferroni post hoc test for group C at different time intervals.
a) Subgroup 1
b) Subgroup 2
c) Subgroup 3
SUBGROUP 1
(T) GROUP
(Y) GROUP BONFERRONI DEPENDENT VARIABLE
PEAK LOAD(N) SHEAR BOND STRENGTH
MEAN DIFFERENCE (T-Y)
p value MEAN
DIFFERENCE (T-Y)
p value
Discover Transbond XT -15.212000 0.883 -1.030500 0.883
Enlight -38.520500 0.001 -2.606667 0.001
Ortho Lite -0.616333 1.000 -0.042833 1.000
Orthofix 1.443833 1.000 0.101000 1.000
SUBGROUP 2
(T) GROUP
(Y) GROUP BONFERRONI DEPENDENT VARIABLE
PEAK LOAD(N) SHEAR BOND STRENGTH
MEAN DIFFERENCE (T-Y)
p value MEAN
DIFFERENCE (T-Y)
p value
Discover Transbond XT -17.391167 1.000 -1.174500 1.000
Enlight -50.384333 0.002 -3.408833 0.002
Ortho Lite 1.208167 1.000 0.086667 1.000
Orthofix 4.424167 1.000 0.304000 1.000
SUBGROUP 3
(T) GROUP
(Y) GROUP BONFERRONI DEPENDENT VARIABLE
PEAK LOAD(N) SHEAR BOND STRENGTH
MEAN DIFFERENCE (T-Y)
p value MEAN
DIFFERENCE (T-Y)
p value
Discover Transbond XT -63.206833 0.002 -4.279167 0.002
Enlight -111.694667 0.000 -7.521667 0.000
Ortho Lite -12.416833 1.000 -0.83667 1.000
Page 46
Table 9:Multiple comparison using bonferroni post hoc test for group D at different time intervals.
a) Subgroup 1
b) Subgroup 2
SUBGROUP 1
(T) GROUP
(Y) GROUP BONFERRONI DEPENDENT VARIABLE
PEAK LOAD(N) SHEAR BOND STRENGTH
MEAN DIFFEREN CE (T-Y)
p value MEAN
DIFFERENCE (T-Y)
p value
Ortho Lite Transbond XT -14.595667 1.000 -0.987667 1.000
Enlight -37.904167 0.002 -2.563833 0.002
Discover 0.676333 1.000 0.042833 1.000
Orthofix 2.060167 1.000 0.1438333 1.000
SUBGROUP 2
(T)
GROUP (Y) GROUP PEAK LOAD(N) BONFERRONI DEPENDENT VARIABLE SHEAR BOND STRENGTH
MEAN DIFFERENCE (T-Y)
p value MEAN
DIFFERENCE (T-Y)
p value
Ortho Lite Transbond XT -18.599333 1.000 -1.261167 1.000
Enlight -51.592500 0.002 -3.495500 0.002
Discover -1.208167 1.000 -0.086667 1.000
Page 47
[image:71.612.111.504.74.264.2]c) Subgroup 3
Table 10:Multiple comparison using bonferroni post hoc test for group E at different time intervals.
a) Subgroup 1
SUBGROUP 3
(T) GROUP
(Y) GROUP BONFERRONI DEPENDENT VARIABLE
PEAK LOAD(N) SHEAR BOND STRENGTH
MEAN DIFFERENCE (T-Y)
p value MEAN
DIFFERENCE (T-Y)
p value
Ortho Lite
Transbond XT -50.790000 0.018 -3.441500 0.019
Enlight -99.277833 0.000 -6.684000 0.000
Discover 12.416833 1.000 0.837667 1.000
Orthofix -24.469333 1.000 -1.657167 1.000
SUBGROUP 1
(T) GROUP
(Y) GROUP BONFERRONI DEPENDENT VARIABLE
PEAK LOAD(N) SHEAR BOND STRENGTH
MEAN DIFFERENCE (T-Y)
p value MEAN
DIFFERENCE (T-Y)
p value
Orthofix Transbond XT -16.655833 0.635 -1.131500 0.628
Enlight -39.964333 0.001 -2.707667 0.001
Discover -1.443833 1.000 -0.101000 1.000
Page 48
b) Subgroup 2
c) Subgroup 3
SUBGROUP 2
(T) GROUP
(Y) GROUP BONFERRONI DEPENDENT VARIABLE
PEAK LOAD(N) SHEAR BOND STRENGTH
MEAN DIFFERENCE (T-Y)
p value MEAN
DIFFERENCE (T-Y)
p value
Orthofix Transbond XT -21.815333 0.739 -1.478500 0.740
Enlight -54.808500 0.001 -3.712833 0.001
Discover -4.424167 1.000 -0.304000 1.000
Ortho Lite -3.216000 1.000 -0.217333 1.000
SUBGROUP 3
(T) GROUP
(Y) GROUP BONFERRONI DEPENDENT VARIABLE
PEAK LOAD(N) SHEAR BOND STRENGTH
MEAN DIFFERENCE (T-Y)
p value MEAN
DIFFERENCE (T-Y)
p value
Orthofix Transbond XT -26.320667 0.830 -1.784333 0.844
Enlight -74.808500 0.000 -5.026833 0.000
Discover 36.88616 0.180 2.494833 0.188
Page 49 RESULTS
The results are shown in table 1 through table 10.
Table - 1.a) shows the mean and standard deviation of peak load and shear bond strength of
different groups immediately after tray removal and mean cross sectional area of 14.76mm2.
Table - 1.b) shows the mean and standard deviation of peak loads and shear bond strength
of different groups 30 minutes after tray removal.
Table - 1.c) shows the mean and standard deviation of peak loads and shear bond strength
of different groups 24 hours after tray removal.
Table - 2.a) represents the comparison, using paired t test, between the peak loads
immediately after tray removal and 30 minutes after tray removal. Comparison between the
subgroups 1 and 2 is statistically significant in Discover .
Table - 2.b) represents the comparison, using paired t test, between the peak loads 30
minutes after tray removal and 24 hours after tray removal. Comparison between the subgroups
2 and 3 is statistically significant in group Transbond XT, Enlight and Orthofix.
Table - 2.c) represents the comparison, using paired t test, between the peak loads
immediately after tray removal and 24 hours after tray removal. Comparison between the
subgroups 1 and 3 is statistically significant in group Transbond XT, Enlight, Ortho Lite and
Orthofix.
Table - 3.a) represents the comparison, using paired t test, between the Shear bond strength
immediately and 30 minutes after tray removal. Comparison between the subgroups 1 and 2 is