Developing sustainable supply chains in the UK construction industry: A case study
Abstract
In recent years, increased concerns over greenhouse gas emissions have initiated a wave of policy change in both governmental, industry and non-governmental organisations in order to reduce the overall environmental impact and ensure a sustainable future. The UK Green Building Council for instance has identified construction as one of the most emission-intensive industries, accounting for around 50% of greenhouse gas production in UK. In this study, a hybrid life cycle assessment (LCA) technique is used to analyse the plasterboard supply chain; the most commonly used product in the UK construction industry of one of the Europe’s leading distributor and contractor of building materials. This study demonstrates how emission ‘hotspots’ across the lifecycle of products can be identified and analysed using different intervention options in the supply chain in an attempt to reduce greenhouse gas emissions. For the plasterboard supply chain, the implementation of cross-docking principles and use of renewable sources of energy in warehousing were determined to be major decarbonzation interventions.
1. Introduction
Business communities across the globe are facing increased concerns over rising carbon emissions, climate change, scarcity of resources and waste generation. In current business environment, companies are facing major challenges arising from resource constraints; furthermore, rising energy and fuel prices causing irreparable damage. In UK, central government has set an ambitious target to reduce the overall carbon emissions by 50% till 2025. The role of the UK construction sector within this target cannot be overemphasised given that it has been estimated that construction can potentially influence 47% of total UK carbon emissions (HM Government, 2010). However, a number of economic and political challenges exist to decarbonize the economy whilst alleviating the ongoing impacts from current financial crises. Although these challenges seem divergent, improving one aspect can inherently lead to improvements in other. For most organizations, as the budget tightens, their priorities will change to cut costs, improve sales and increase the market base. Developing greener supply chains can add to revenue generation by cutting carbon emissions, making processes more efficient and decreasing surplus consumption bills. To strengthen its stand on low carbon economy, the UK government has recently announced that all companies listed in the London Stock Exchange have to report their carbon footprint in their annual reports (Scott, 2012).
According to the Carbon Trust (2006), carbon reporting and auditing is the first step towards reducing carbon emissions which may positively influence unnecessary resources consumption. Companies can benefit from carbon measurement and reporting to set their carbon management initiative in place for a carbon neutral future. A report by the Department of Environment, Food and Rural Affairs (DEFRA, 2009) estimates that a saving of 4 million tonnes of carbon emission by 2021 will be achieved using emission reporting. These regulations on reporting will directly or indirectly require companies to develop strategies to work towards a carbon neutral future. In a green supply chain, companies need to review their strategies to connect and collaborate with each member in the chain. In recent years companies are becoming more proactive and are addressing the emissions out of their direct control, referred as Sustainability 2.0 (Ranconteur 2012). Therefore, collaborating at the supply chain (SC) level will help to manage risks and integrate sustainable practices in business processes.
Measuring and controlling carbon emissions is challenging for any company’s supply chain. This study seeks to measure the direct and indirect lifecycle greenhouse gas emissions of the plasterboard supply chain of a leading European distributor of building materials with the help of a hybrid life cycle assessment (LCA) technique. The supply chain of plasterboard is mapped to identify total lifecycle emissions from manufacturing, storing and transportation. This helps to improve the visibility, transparency and understanding of carbon emissions in the supply chain network. Later, carbon emissions hotspots are identified and a series of scenario analyses presented to understand the possible interventions that could cut down the lifecycle carbon emissions. This study further offer recommendations to the company for consideration in future strategies.
discussion over the findings and recommendations to the industry, while Section 7 concludes the paper.
2. Background
2.1 Green supply chain management
Previous work (see, for instance: Mefford (2011), Winkler (2011), Sarkis et al., 2011) have identified GSCM as a key business value driver. Porter (2008) also emphasises that such sustainable frameworks provides a strategic process which can enable organisations to create competitive advantages. Lake et al (2014) provides insight into how decision support systems based on the concept can be developed to aid businesses in developing supply chain strategies. Srivastava (2007) also states that the lack of integration of sustainable practices in upstream and downstream supply chain partners may lead to reduction in profits. This means that specific criteria such as environment responsibility and social behaviour need to be applied by all supply chain members for greater and more long-term benefits. Studies show that GSCM not only reduces the environmental and social impact but also improves the operational effectiveness in following ways:
• Green design: designing products to reduce the environmental impact over the full life cycle from the starting stage of developing new product and production processes (Fiksel, 1998).
• Green Operations: covering all aspects of greening the product by remanufacturing, handling, re - usage, logistics and waste management after the design phase
(Lund, 1984; Srivastava, 2007).
• Green Manufacturing: reducing environmental impact by selecting recycled or reused products or products which have been refurbished/remanufactured (Srivastava, 2007; Lund, 1984).
• Green Packaging: utilizing less materials resulting in small, thin and light packages. This packaging can be recycled and also occupies less space during storage and transportation (Kassaye and Verma, 1992).
• Waste Minimization: from production and operations (Lund, 1984).
of origin to that of consume as to meet customer needs, recovering the residue obtained and managing it so that possible reintroduction in the supply chain, giving added value and /or proper disposal of it” (Tibben-Lembke and Rogers, 1998)
Different stages of GSCM involve activities including product safety, environmental risk management, occupational health and safety, pollution prevention, conservation of resources, cradle to grave product lifecycle analysis and waste management (Srivastava 2007; Zhu et al., 2008). Managing these activities systematically in the supply chain helps companies to integrate their discrete activities resulting in increased efficiencies, reduction of costs, promotion of economies of scale, better management of risks and improvement in operational effectiveness.
In the current global competitive environment, businesses are facing ever-increased challenges to satisfy the ever-rising expectations of their customers and seek ways to reduce costs, improve quality and meet their sustainability goals. To meet these goals, many of them have identified GSCM as an area to gain the competitive advantage in the long term (Zhu and Sarkis 2004; Genovese et al., 2013b). Every stage of the supply chain contains energy consumption, waste elimination and carbon emissions, and therefore, the SC needs to be restructured to reduce the waste and carbon emissions by re-engineering, re-manufacturing, re-furbishing and re-usage (Koh and Aaoshima, 2001). Bernon and Cullen (2007) also explain the necessity to measure SC performance of reverse logistics and closed loop supply chains in both environmental and financial profitability. Many companies face problems in implementing environmental management systems due to internal and external barriers.
2.2 Sustainability in Construction Industry
Plasterboard is one of the notable products utilised in the construction industry. The construction industry consumes approximately 3 million tonnes of plasterboard for construction in UK each year. Detailed statistics from the Department for Environment, Food & Rural Affair (DEFRA, 2009) show that around 300,000 tonnes of plasterboard waste are generated from new construction activities each year. Moreover, it is difficult to quantify the amount of plasterboard waste arising from demolition and refurbishment projects; estimates however show this lies in the range of around 500,000 tonnes to more than 1 million tonnes per year. From an environmental perspective, climate change is the main impact associated during manufacturing due to the energy consumption at several stages of production (namely ‘calcinations’ and drying of the plasterboard) (DEFRA, 2009). As discussed in the DEFRA report, other impacts include the cost of disposal of plasterboard at the end of the life cycle (economic impact) and the potential health risks emanating from the manual handling of plasterboard sheets in construction sites (social impact).
environment when magnified at multiple levels across the Supply Chain. Optimizing the transport routes and reducing the inventory level can also lead to better savings and improved efficiency (Gavirneni, 2005).
To this end, the paper aims to explore the development of sustainable supply chains in the UK construction sector using the supply chain for plasterboard products as a case study. Within this process, the greenhouse gas emissions are assessed throughout the product lifecycle using a Hybrid LCA methodology. The impact of logistics activities and multiple scenarios of the operations function of the supply chain such as cross-docking as an alternative storage solution are analysed in this paper.
3. Hybrid LCA Methodology
In this paper, the top-down environmental input-output methodology and the bottom-up process analysis methodology are integrated together to develop the hybrid LCA framework. The environmental input-output methodology is formulated on the concept of Multi-Regional Input-Output (MRIO) analysis based on the Supply and Use format. Because supply chains are generally complex with extended system boundary as a result of the globalized nature of all the interconnecting and theoretically infinite tier-level product, process and service inputs, the use of the MRIO framework enables the complexity issue to be resolved. Fundamentals of this methodology are described in the following.
3.1 General Input-Output Model
An input-output (IO) model records the flows of resources (products and services) from each industrial sector considered as a producer to each of the other sectors considered as consumers (Miller and Blair 2009). An IO model is therefore a matrix representation of all economic (production and consumption) activities taking place within a country, region or multi-region.
The general input-output approach has been well documented in literature (Albino et al., 2002; ten Raa, 2007; Ferng, 2009; Minx et al., 2009). It can be shown that:
𝑥 = (𝑰 − 𝑨)−1∙ 𝑦
matrix because it describes the technology of a given industry which is characterised by the mix of supply chain inputs (including raw materials, machinery, energy, goods, transport, services, etc) required to produce a unit output (Barrett and Scott 2012). Vector 𝑥represents the total output in a given sector and is equal to the sum of those products consumed by other industries and those consumed by the final demand 𝑦 (households, governments, exports, etc).
(𝑰 − 𝑨)−1 is referred to as the Leontief Inverse matrix and (𝑰 − 𝑨)−1∙ 𝑦 describes the total (direct and indirect) requirements needed to produce the total output, 𝑥 for a given final demand 𝑦 (Miller and Blair, 2009). Hence, in terms of supply chain visibility, the supply chain of a given product can be set up in such a way that not only direct inputs are captured, but also, irrespective of the origin of these inputs (domestic or imported), indirect supply chain input can also be captured in the analysis. This is as a result of the extended system boundary of the IO framework (Acquaye and Duffy 2010, Mattila et al. 2010, Wiedmann et al. 2011). As a result, the whole lifecycle perspective, which is a key principle of green supply chain management (Sundarakani et al., 2010; Carter and Easton, 2011), can be adopted based on the generalised ideas surrounding Multi-Regional Input-Output (MRIO) analysis (Wiedmann, 2009).
3.2 Multi-Regional Input-Output (MRIO) Hybridized Framework
developed within the integrated hybrid LCA methodology (Suh and Huppes, 2005) is presented below. The general equation is given by Equation 1 (see also Acquaye et al., 2011)).
Equation 1:
Total Emissions Impact = [𝐄̂𝐩 𝟎 𝟎 𝐄̂𝐢𝐨] [
𝐀𝐩 −𝐃
−𝐔 (𝐈 − 𝐀𝐢𝐨)] −1
[𝑦 0]
Where: Where:
𝐀𝐩 represents the square matrix representation of process inventory (dimension: s × s)
𝐀𝐢𝐨 represents the MRIO technology coefficient matrix (dimension: m × m) 𝐈 represents an identity matrix (dimension:m × m)
𝐔 provides the matrix representation of upstream cut-offs to the process system (dimension:m × s)
𝐃 reproduces the matrix of downstream cut-offs to the process system (dimension: s × m)
𝐄𝐩 represents the process inventory environmental extension matrix. CO2-eq emissions are diagonalised (dimension:s × s)
𝐄𝐢𝐨 represents the MRIO environmental extension matrix. CO2-eq emissions are diagonalised (dimension:m × m)
[𝑦
0] represents the functional unit column matrix with dimension (s + m, 1) where all entries are 0 except y
The following sub-sections details how each part of the MRIO model is set-up.
3.2.1 Process LCA
would be of dimension (𝑛 + 1) by (𝑛 + 1); where there are 𝑛 supply chain product inputs and 1 main product output. Let 𝑞𝑛 represent the quantity of supply chain inputs used for any given input, 𝑛 and Ap= [𝑘𝑟𝑐];𝑟 (rows) represents inputs and 𝑐 (columns) processes in the process LCA system. The mathematical formulation of the Process LCA system becomes:
𝐴𝑝= [𝑘𝑟𝑐] =
3.2.2 Input-Output LCA System, 𝐴𝑖𝑜
Following on from Equation 1, the input-output LCA system in this paper is setup as a multi-regional input-output LCA system (Aio) presented in the Supply and Use format. In Matrix representation, this becomes
𝐀𝐢𝐨= [
𝟎 𝑨(𝑼𝑲)𝑼 𝑨(𝑼𝑲)𝒔 𝟎
𝟎 𝟎
𝑨(𝑼𝑲)𝑰𝑴𝑷 𝟎
𝟎 𝟎
𝑨 (𝑼𝑲)𝑬𝑿𝑷 𝟎 𝟎 𝑨(𝑹𝑶𝑾)𝑼 𝑨(𝑹𝑶𝑾)𝑺 𝟎 ]
Where Aio becomes the 2-region MRIO technical coefficient matrix. This includes the following technical coefficient matrices:
• 𝑨(𝑈𝐾)𝑈, representing the UK Domestic Use. • 𝑨(𝑈𝐾)𝑠, representing the UK Domestic Supply. • 𝑨(𝑈𝐾)𝐸𝑋𝑃, representing the UK Export to ROW. • 𝑨(𝑅𝑂𝑊)𝑈, representing ROW Use.
• 𝑨(𝑈𝐾)𝐼𝑀𝑃 , representing UK Imports from ROW. • 𝑨(𝑅𝑂𝑊)𝑠, representing ROW supply to ROW.
All of the individual 𝑨 matrices are of dimensions 224 𝑥 224; hence, Aio and 𝑰 (the Identity Matrix) are therefore of dimension 896 𝑥 896.
𝑘𝑟𝑐 = 0 𝑖𝑓 𝑟 ≠ 𝑐
𝑘(𝑟𝑐)𝑛 = 𝑞𝑛 𝑖𝑓 𝑟 = 𝑐
𝑘𝑟𝑐 = 𝑘𝑟,𝑛+1= −𝑘𝑟𝑟 ∀ 𝑟 𝑎𝑛𝑑 𝑖𝑓 𝑐 = 𝑛 + 1
The Technical Coefficient Matrix for UK Imports from ROW, 𝑨(𝑈𝐾)𝐼𝑀𝑃 , for example is defined as:
𝑨(𝑈𝐾)𝐼𝑀𝑃 = [𝑞𝑖𝑗
(𝑅𝑂𝑊,𝑈𝐾) 𝑥𝑗 ]
Where: 𝑞𝑖𝑗(𝑅𝑂𝑊,𝑈𝐾) represents elements of UK imports input-output table from the ROW region indicating the input of product (𝑖) from ROW into the industry (𝑗) of the UK while 𝑥𝑗 represents the total output of UK industry, (𝑗).
3.2.3 Upstream (𝑈) and Downstream (𝐷) Inputs
From Equation 1, the upstream inputs or Matrix 𝑈 is assigned a negative sign because it represents inputs from the upstream supply chain (IO system) into the process system. Matrix D, is also assigned a negative sign, because it represents inputs from the process system into the background economy (IO system). Both Strømman et al. (2009) and Acquaye et al. (2011) explains that the downstream inputs from process LCA system into the wider economy or (IO system) can be considered negligible; hence matrix 𝐷 set to zero. Using the basic principles of input-output analysis, Acquaye et al. (2011) provides details in estimating the upstream inputs 𝑈.
3.2.4 Final Demand 𝑦
As shown in Equation 1, 𝑦 represents the final demand; in this instance, the output of the hybrid LCA system. In matrix notation, 𝑦 is a column matrix of dimension: ((𝑛 + 1 + 896) 𝑏𝑦 1 ; where 𝑛 is the number of supply chain product inputs of the process LCA system, represents the main product output and 896 the dimension of the MRIO matrix used in this paper. It is given as:
𝑦 = [𝑓𝑑,1]; where 𝑓𝑑,1 = 1 𝑖𝑓 𝑑 = 𝑛 + 1 𝑎𝑛𝑑 0, ∀ other 𝑑
The MRIO component of the hybridized model can be extended to an Environmental MRIO lifecycle assessment (LCA) to generate results which can be used in the assessment of product supply chain emissions.
Given that 𝑥 = (𝑰 − 𝐴𝑖𝑜)−1∙ 𝑦 defines the total (direct and indirect) requirements needed to produce an output 𝑥 for a given final demand, 𝑦; the MRIO based hybrid LCA can therefore be defined in a generalised form as:
𝐸 = 𝑬𝑖𝑜∙ 𝑥 = 𝑬𝑖𝑜 ∙ (𝑰 − 𝐴𝑖𝑜)−1∙ 𝑦
Where 𝑬𝑖𝑜 is the direct emissions intensity (kg CO2-eq/£) of the IO industries and
𝑬𝑖𝑜 ∙ (𝑰 − 𝑨𝒊𝒐)−1 the total (direct and indirect) emissions intensities (kg CO2-eq/£) of the IO industries.
By extension, the matrix 𝑬𝑖𝑜 expressed in terms of the MRIO Supply and Use structure becomes:
𝑬𝑖𝑜 = [
𝑬̂𝑼𝑲 𝟎
𝟎 𝟎
𝟎 𝟎 𝟎 𝟎 𝟎 𝟎
𝟎 𝟎
𝑬̂𝑹𝑶𝑾 𝟎
𝟎 𝟎
]
Where 𝑬̂𝑼𝑲 and 𝑬̂𝑹𝑶𝑾 are respectively the diagonalised direct emissions intensity (Sector emissions in kg CO2-eq per total output in £) of each industrial sector in the UK and the ROW.
Similarly, the environmental extended component for the process LCA system 𝑬𝑝 (Refer to Equation 1) is defined by a diagonalised matrix of the respective environmental values 𝑒𝑛 of each input 𝑛 into of the process LCA system. 𝑒𝑛 is obtained by multiplying the quantity of each product inputs 𝑞 and the respective emissions intensity 𝑒𝑖𝑛𝑡.
𝑬𝑝 = [𝑒̂𝑛]
Where ∀ 𝑛 into the process LCA system;
𝑒𝑛 = 𝑞𝑛∙ 𝑒(𝑖𝑛𝑡)𝑛
between the reverse supply chain management system and a linear production paradigm of the forward supply chain. Indeed, by interconnecting the domestic and ROW Supply and Use input-output tables into a 2-region MRIO table as shown, the model can overcome the complexity of product supply chains as a result of the globalized nature of all the interconnecting and theoretically infinite tier-level product, process and service inputs. This is so because in addition to direct inputs, the model captures all indirect upstream requirement that are needed to produce all the individual supply chain inputs either from resources from the UK or from outside the UK (that is ROW).
In this study, the Hybrid LCA has been employed to evaluate carbon emissions across the supply chain.
3.2.6 Supply Chain Mapping
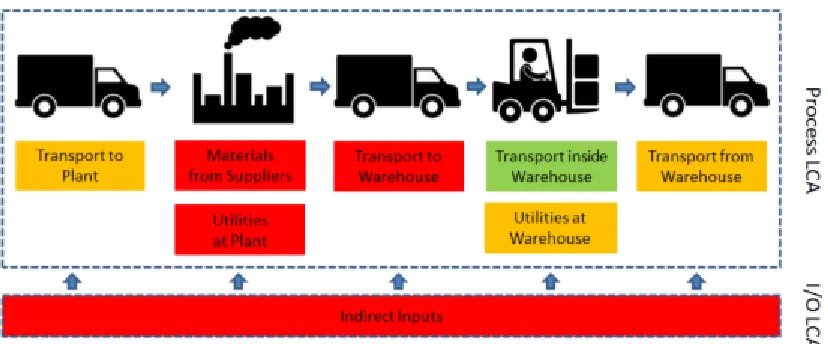
The output of the Hybrid LCA methodology will be organised and presented in tables (reporting supply chain inputs and related amounts, reference units, unit cost, emission intensities per reference unit, total emissions, emissions percentages over total and input category) and supply chain maps. Supply chain maps visually represent the interaction between different entities within a supply chain and can be presented at different levels of the value chain such as product, process, firm and industry levels. In this paper, a product-level perspective is used highlighting the direct and indirect supply chain interactions. Acquaye et al (2014) explains that the concept of a supply chain map can be used to provide clear understanding of the exact flow of materials and impacts along the supply chain and hence form the basis for managing and benchmarking the environmental performance of the supply chain. Specifically, supply chain inputs will be classified according to the following categories:
• Transport to Plant, involving the transport of raw materials and semi-finished goods to intermediate production stages and to the main manufacturing plant. • Materials from Supplier, involving manufacturing activities related to the
• Utilities at Plant, including the use of electricity, gas, fuels, water and other types of energy/utilities at the main manufacturing plant within the supply chain.
• Transport to Warehouse, representing logistical activities related to the transport of finished products from the main manufacturing plant to the distribution warehouse.
• Transport inside Warehouse, being related to loading, unloading and handling operations happening at the distribution warehouse (involving, for instance, the use of forklifts).
• Utilities at Warehouse, including the use of electricity, gas, fuels, water and other types of energy/utilities at the distribution warehouse.
• Transport from Warehouse, representing logistical activities related to the transport of finished products from the distribution warehouse to the final customer.
Inputs (and related aggregated categories) will be classified (in both tables and maps) according to their related emissions amount according to the colour-code and thresholds shown in Table 1.
<< Insert Table 1 here >>
4. Implementation 4.1 The Case Study
management. It has achieved ISO 14001 certification in 2006 and introduced the Low Carbon Business Policy which has resulted in gaining Carbon Trust Standard.
Plasterboards are a commonly used construction product due to its inherent qualities such as low flammability, acoustic benefits and ease of build. Approximately 270 million m2 of plasterboard is produced, distributed and used in the UK every year (DEFRA, 2010). This high consumption also generates waste by the refurbishment and demolition of plasterboard at the end of the life cycle. Every year, over 2400 tonnes of plasterboard is produced and supplied to the case company warehouses. This study identifies the emission ‘hotspots’ across the lifecycle of the plasterboard and analyse different interventions in the supply chain in an attempt to reduce greenhouse gas emissions.
4.2 Data Collection
In this study, data has been collected using primary and secondary sources. The primary data is collected using a data collection protocol completed by the company, and through a number of interviews conducted during meetings with company managers. The data protocol is provided to the company listing the data requirements and the units of the primary dataset. The following specific information was provided by the company:
• The total energy usage (electricity, gas, petrol and diesel) by 1 tonne of plasterboard annually with their quantities and units.
• The total output of insulation plasterboard distribution annually.
• The percentage of total energy usage that can be allocated to Insulation plasterboard (through production, storage or transportation).
• All the inputs and related quantities and unit cost that goes into the production of 1 tonne of insulation plasterboard.
• The average distance (in km) travelled by 1 tonne of plasterboard for delivery of final product to customer.
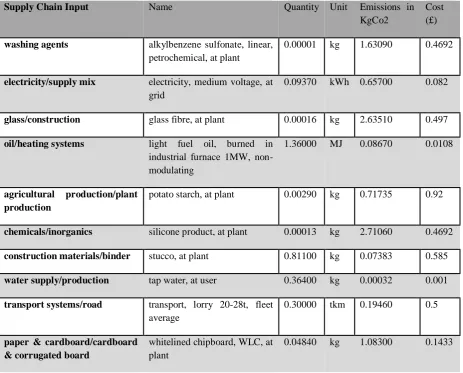
Relevant secondary data are collected from eco-invent; a widely used emission inventory database. In this study, Ecoinvent (2012) data provides the information about the emissions related to the activities involved in the manufacturing. The cumulative effects of emissions are represented using CO2 kilogram equivalents (kgCO2-eq) of the unit of input over a 100 year period. The secondary data for plasterboard supply chain inputs was retrieved from the Ecoinvent (2012) database version v2.2. It consists of more than 4000 up-to-date lifecycle inventory (LCI) datasets for a wide range of areas including: energy supply and production, agriculture, transportation, construction materials, packaging materials, metals, biofuels and bio materials, electronics and ICT and also waste treatment.
The data from both primary and secondary sources are used as inputs to the hybrid LCA methodology to calculate total lifecycle carbon emissions and develop the supply chain maps.
4.3 Data Analysis
4.3.1 Preliminary findings
The primary data supplied by the company are mainly related to their logistical (storage and transportation) activities, considering a distribution centre located in the North-West of England. Approximately 200 tonnes of plasterboards per month are produced by the suppliers, sourced and stored in the warehouse until distributed to the customers. The company transports plasterboard all around UK by road using its own fleet of 1,300 vehicles. The data sheet provided by the company includes the distance from a national distribution centre to the warehouse and from the warehouse to the customers. Based on primary data provided by the company, the average distance for customer deliveries was calculated to be 54 km to and from the warehouse (or 27km one way). On average, 255,477 kWh of electricity is consumed per year by one of the warehouses in UK. The total cost of water consumption in a month by the warehouse is £2,169. In the warehouse, 9 diesel forklifts operate for 42.5 hours per week and are used to load, unload and store the plasterboard in the warehouse.
information on plasterboard’s upstream supply chain is obtained from the GHG Scope 3 emission report by World Resources Institute and WBCSD (Greenhouse Gas Protocol, 2011). According to the report, Scope 1 emissions are the direct emissions that are controlled and owned by the companies while Scope 2 emissions are related to indirect use of energy (electricity, heat, steam). Scope 3 emissions are the indirect emissions that are not reported in the company’s value chain. These potential Scope 3 emission activities are also analysed in this paper using the following upstream indirect inputs in the supply chain:
a. Travelling of employees by Air, Road and Rail b. Construction of commercial buildings
c. Manufacturing of plasterboard d. Machinery used in production e. Extraction of gypsum
f. Collection and treatment of waste in the whole supply chain g. Landfill of waste
h. Computer services
The primary data of the warehouse are converted according to the standard unit of 1kg of plasterboard and the emissions are calculated in kgCO2. The carbon emission per unit weight of plasterboard due to inbound logistics, forklift trucks used in the warehouse, outbound logistics, and electricity and water consumption are summarised in Table 3.
<< Insert Table 2 here >>
<< Insert Table 3 here >>
4.3.2 Supply chain mapping
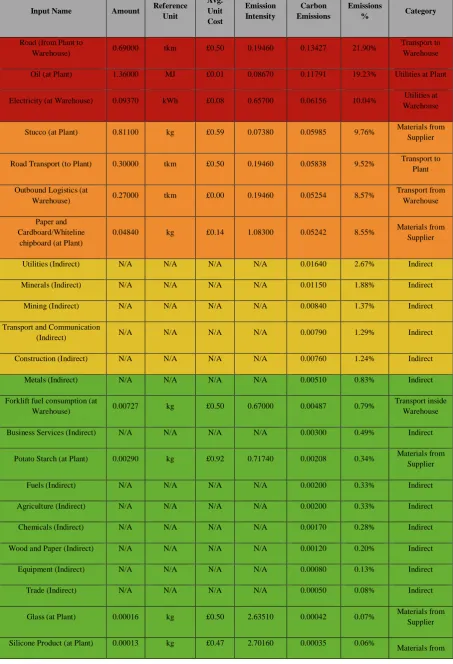
In this step, the data calculated from the primary and secondary resources are mapped and emissions are calculated to evaluate the environmental impact of the plasterboard supply chain based on the hybrid LCA methodology. Figure 1 presents the upstream and downstream carbon emission of the plasterboard supply chain.
gas and electricity consumption where the company does not control the production process. In addition, Scope 3 indirect emissions produced as a consequence of ‘other’ activities. Table 4 reports the complete break-out of carbon emissions across the supply chain, including both direct and indirect emissions.
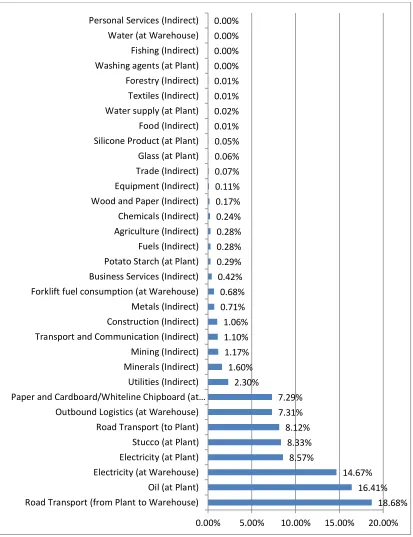
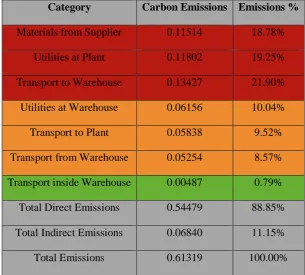
The total lifecycle carbon emission of the supply chain is estimated to be 0.7187 kg-CO2 equivalent for per kilogram of plasterboard production. This analysis estimates that 90.47% of the total lifecycle emission is contributed by direct inputs, and 9.53% originates from the indirect emissions associated with the plasterboard supply chain. The indirect emissions in the supply chain are based on the inputs from different sectors such as, construction, trade, minerals, fuels, wood and papers, food, textiles, chemicals, fishing forestry, personal and business services, transport and communication, utilities and mining. In the case of plasterboard, the indirect emissions are linked to the operations related to Extraction of minerals (1.60%), Utilities (2.30%), Transport and Communication (1.10%), Mining (1.17%) and Construction (1.06%).
The Hybrid LCA model helps to identify the carbon ‘hotspots’ and quantify their impacts in the plasterboard supply chain. This is translated in a supply chain carbon map (as seen in Figure 1) aggregating the different direct emission inputs into identified categories identified in Table 4 and Table 5. In particular, the utilities consumption at the manufacturing plant account for 24.99% of the total emissions. Transport of finished products to the warehouse accounted for 18.68% of emissions, while materials received from suppliers and utilised at the manufacturing plant account for 16.02%. Utilities consumption at the warehouse estimated to account for 14.67% share of total emissions.
<< Insert Table 4 here >>
<< Insert Table 5 here >>
<< Insert Figure 1 here >>
<< Insert Figure 2 here >>
In this section, different scenarios are modelled to identify the potential strategies to reduce the environmental impacts of the plasterboard supply chain. Scenario analysis is an important tool for strategic decision-making, particularly in environmental impact assessments, due to its ability to define future developments for cumulative impact assessment and to determine the effects of contextual change (for example climate change) on possible interventions (Duinker and Grieg 2007).
During the production of plasterboard many of the raw materials used need to be utilized efficiently to cut down on environmental impacts. The impacts related to oil consumption, electricity and utilities are very high in production and manufacturing operations such as:
• Gypsum Production – Environmental impact due to the extraction of natural gypsum and production of Flue Gas Desulphurisation (FGD) is significant. Mining and extraction of minerals causes 2.77% of the total emissions (see Table 3).
• Stucco Production – Various stages in this process require energy to heat up to 150 degree Celsius using natural gas to convert calcium sulphate di-hydrate to calcium sulphate hemidi-hydrate. The impact associated gets higher according to the quantity of fuels used.
• Plasterboard Production – During the formation of plasterboard slurry, hemihydrate is mixed with water, which is shaped between ‘facing papers’ and passed through a dryer at a moderate temperature to prevent re-calcination.
• Disposal – Emissions from the disposal of plasterboard are related to landfill and transportation.
emissions of LPG forklift is smaller when compared to electric forklifts because the emissions related to charging the electric vehicle are higher.
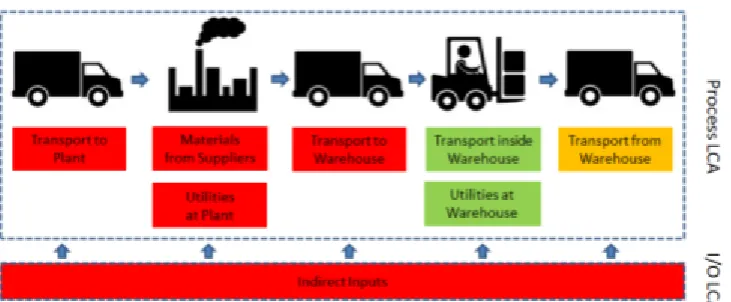
5.1 Scenario 1: Implementation of Cross Docking principles
In this scenario, the cross-docking principle would be analysed in context of the warehouse activities at the case company. The hybrid LCA methodology would be used to estimate the carbon emission reductions after implementing the cross docking principles. In this activity, the inbound flow of plasterboard is synchronized with the outbound flow of plasterboard at a warehouse without moving them to the storage facility. Greater degree of coordination is required to implement the cross-docking activities smoothly; however it significantly reduces the inventory level (Kinnear 1997, Savasakan et al. 2004).
Cross docking will create a lean system facilitating distribution, which benefits both the company and their suppliers. The highly coordinated working environment will reduce warehouse usage and as a result will reduce the emissions associated with it due to the reduction in electricity usage. Savasakan et al. (2004) found evidence in their case company that the implementation of cross-docking principles reduces the inbound product order cycle time by 71% (decreasing from 7 days to 2 days), inventory levels reduced by 76% and the floor space required to store inventory at the plant reduced by up to 50%. However, for the successful implementation cross-docking, there is a need for advance information systems like Manufacturing Resource Planning (MRP 2) or Enterprise Resource Planning (ERP). These information systems drive the synchronization of deliveries related to cross docking and enable an enhanced information flow in the supply chain by integrating production, warehouse and distribution operations related to plasterboard.
with the suppliers distribution system would allow the company to reduce a significant proportion of emissions from inbound and outbound logistics. In the supply chain map, as shown in Figure 3, the aggregated carbon ‘hotspots’ are related to the manufacturing of raw materials at suppliers plant, utilities at manufacturing plant and transportation activities to the company warehouses (as shown in Table 7 and Figure 3). By implementing cross docking the plasterboard will not stay in the warehouse for more than 24 hours, therefore it can be safely assumed that emissions related to energy use would be reduced further. In addition, these emissions could be even further reduced by enhancing collaboration with suppliers to encourage the use of greener sources in the extraction of raw materials and in production (such as adopting energy-efficient machinery).
<< Insert Table 6 here >>
<< Insert Table 7 here >>
<< Insert Figure 3 here >>
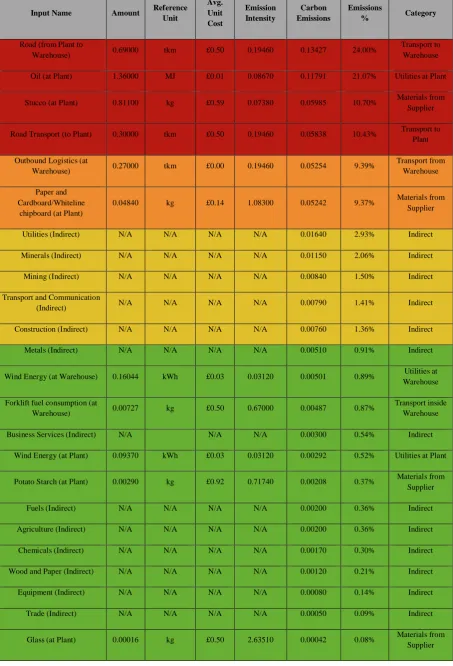
5.2 Scenario Analysis 2: Implementation of Renewable Energy Sources
The European Union Directive on renewable energy states that at least 15% of gross energy consumption needs to be generated from renewable sources by 2015 and 25% by 2020 (European Commission, 2007). At present, onshore wind energy accounts for 28% of energy supplied by renewable sources in the UK and represent an economically attractive option compared to offshore and other renewable sources (DECC, 2011). According to a report by Deloitte (Boweyer et. al, 2009), UK has one of the best onshore and offshore wind energy resources in the world. In the past 35 years there has been a continuous flow of wind in this country. Although, this does not obligate the case company directly, the possible adoption of onshore wind energy provides a good solution for reducing carbon footprint of the firm.
al. (2009), the following three factors must be considered to make an informed decision:
• The long-term costs of climate change and resource depletion associated with the continuing rate of energy consumption and carbon emissions.
• The costs expected from the rise of fuel prices.
• The comparison of cost with the long-term benefits of renewable energy (in particular the reduced costs of procuring electricity from this source)
Moreover, to understand the costs associated with various sources of energy, a life-cycle cost perspective needs to be taken into account. This cost includes the fuel, operation, maintenance and supply of energy over the period of the economic life of power plant. Given the economic and environmental trade-offs, a report by the Committee on Climate Change (CCC, 2011) state that onshore wind energy is a feasible solution compared to other non-renewable sources as it provides a more stable and reliable source of energy generates less financial impacts over the long-term, such as costs involved in mining to obtain fuel, water consumption and the disposal of waste products (IPCC, 2011).
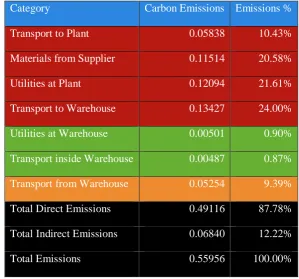
The scenario analysis is performed to analyse the reduction in the lifecycle emissions of plasterboard SC by implementing wind energy. Sourcing electricity from wind energy suppliers or installing a wind energy turbine to sustain the company’s needs of heat and electricity would reduce the carbon emissions of the case company. The analysis of the plasterboard SC is shown in Figure 4 after using renewable energy from wind turbine at warehouse and production facilities of the plasterboard. Reduction of 22.14% of carbon emission is estimated in the supply chain, which will result in the total emission of 0.55956 kg-CO2 equivalent. This intervention will remove electricity inputs (and the aggregated category of utilities) as main ‘hotspots’; and the hotspots in the lifecycle would then be shifted to transportation and manufacturing activities (see Tables 8 and 9 and Figure 4). Following this, the company can re-prioritize its decarbonzation efforts to these new hot-spots.
technology and capacity. However, the analysis of this scenario is important to provide an insight into the possibilities for emission reductions that could be achieved by implementing renewable energy sources, even for a proportion of current energy consumption. Based on the analysis of above scenarios, the most effective and reasonable interventions will be selected and utilised as a recommendation to the company for consideration in any future environmental decision-making.
<< Insert Table 8 here >>
<< Insert Table 9 here >>
<< Insert Figure 4 here >>
6. Discussion
Developing a sustainable supply chain is a complex process; it needs collaboration and integration of different activities with the supply chain partners. Measuring the life cycle emission of the product and monitoring the carbon intensive activities are important activities to be undertaken in order to encourage green practices. The proposed hybrid LCA methodology can be an effective means in evaluating the carbon emissions in the supply chain and assessing the impact of potential intervention options on the life cycle emissions. The successful implementation of green supply chain practices to reduce the carbon emissions, however, depends on a number of factors that will be discussed in the following.
6.1 Emission data sharing in the SC
emission of the product. Transparency in data sharing should be encouraged to analyse the impact of potential green interventions on the SC. Long-term collaboration not only overcomes challenges in data sharing, but also provides innovative ideas to create win-win situation for all entities involved. Instead of designing separate policies, suppliers and customers of the product can collectively work on single policy to reduce overall environmental impact, increasing triple bottom line benefits for all involved.
In the above-mentioned case study, suppliers of the company are already engaged in the Plasterboard Sustainability Action Plan by DEFRA (DEFRA, 2010). However, the company can initiate further environmental collaboration to develop a transformational relationship with suppliers to mutually work to reduce the environment impact of plasterboard from cradle-to-grave.
6.2 Green Sourcing
The ‘green’ component in sourcing can act as a catalyst for the company by: building its green credentials, by developing better public image and reputation among stakeholders and allowing them to meet their cost reduction goals improving their financial results. Green sourcing is not just about finding new sustainable technologies or sourcing from green suppliers, it can also help in reducing waste throughout the whole supply chain by lowering the usage of raw materials and benefiting from the recyclable materials. This strategy should be adopted at every level of the SC.
6.3 Logistics Activities
investment. They can also make use of alternate modes of transportation such as railways to better fit the supply of plasterboard and lower the carbon emission. McKinnon (2006) suggests that increasing vehicle capacity, energy efficiency and reducing externalities can further reduce the CO2 emissions. The company needs to benchmark the fuel efficiency of trucks and optimize routes to continuously improve their carbon emissions in long term.
6.4 Warehousing Activities
Results have shown that the influence of logistical activities on the overall carbon emissions figures for a typical product in the construction supply chain may not be negligible.
The scenario analyses showed that the best solution to reduce lifecycle emissions originating from warehousing activities is represented by the implementation of cross-docking principles. This will help to reduce carbon emissions related to electricity and water consumption. Other factors to reduce the environmental impact of the warehouse could include.
• Adopting energy efficient practices: Housekeeping (such as turning off lights when not in use) can save up to 50% of the direct energy used for the equipment, heating and lighting (Carbon Trust, 2006). Renewable sources of energy such as wind and solar energy could be used in the warehousing operations.
• Maintaining the warehouse temperature: The warehouse should be maintained at a satisfactory temperature condition to store the materials by controlling the maximum or minimum temperature level, however by reducing temperature by 1 degree Celsius, a saving of up to 10% can be achieved.
• Handling equipment: With reference to the findings, diesel forklifts could be replaced with LPG forklifts which would reduce the carbon emissions.
• Avoid Packaging: Get rid of primary or extra packaging of plasterboard and find greener solution of packaging. A reusable common pallet can be used in the whole supply chain to stop the wastage of packing materials. This will help in reducing the cost as well as carbon emissions related to packaging.
6.5 Reverse Logistics
Responsible sourcing and ordering the right amount of materials helps in reducing the quantity of waste going to landfill. However, reverse logistics can play an important role in the reduction of waste disposal. According to the hybrid LCA analysis, the emission associated with waste is not a major concern for the current company. However, empty running of trucks is an issue. The company needs to collaborate and encourage reverse logistics with their suppliers to reduce fuel consumption from under-utilised routes. The company can look for opportunities to use the lorries and trucks on return journey to get both environmental and economic benefits. Also, the company can look at solutions for the reverse flow of the products after the end-of-life. Companies are becoming more proactive in achieving their sustainability goals through reverse logistics. They are looking forward to building carbon neutral buildings, which will involve green sourcing, recycling and re-usage of plasterboards. Companies can also collaborate with its customers to discover an innovative application of the reverse logistics principles. This will create a win-win situation for both the companies in reducing their carbon footprint by utilizing empty trucks and recycling plasterboard waste.
6.6 Logistics Network Optimisation
environment benefits. Reducing the total distance will automatically provide environmental benefits as the vehicle will consume less fuel, emit less pollution and indirectly place less pressure on the road infrastructure. Redesigning logistics networks to optimise both economical and green objectives should be considered in collaboration with SC members. Mixed mode of transportation including the low emission options should also be considered along with network optimisation.
6.7 Aligning Sustainable Practices in SC
The strategic plan for reducing the environmental impact could be short-term, mid-term or long-mid-term. However, the strategic planning should be properly aligned with the operational measures to ensure the implementation of the sustainable practices in the SC.
• Strategic Planning: Current sustainability goals of the SC can be examined to see how much they align with the future sustainability planning and goal setting. If the current goals are not promising enough then there is a need to work on the design of new goals and policies.
• Sustainability Review: As soon as the goals are defined, suppliers’ evaluation should be performed to check the alignment with the sustainability goals of the SC. The evaluation process should identify and rank the suppliers on their alignment to the SC green goals. It could be the reduction of waste, implementation of reverse logistics, logistics route optimization, green packaging, JIT, energy efficient products or sustainable warehousing. A review of the progress made by the suppliers would be undertaken over a fixed period to check if the company is improving at the required pace.
• Execution: Execution of strategic goal needs efficient coordination and information sharing with suppliers. Due to the limited sharing of data with suppliers, sustainability goals will not be achieved. If required, training to suppliers to understand the execution process should be provided.
7. Concluding Remarks
In context to the problems related to climate change and global warming, this study discussed the need to consider sustainability goals in the supply chain. Hybrid LCA based methodology is proposed in the paper to measure the carbon emission in the supply chain and evaluate potential strategies to reduce the carbon emission. Plasterboards, the most commonly used product in the UK construction industry and responsible for a significant impact on the environment was use to exemplify developments made in the paper. The case study presented assess the carbon emissions at the SC level and analyses multiple interventions in an attempt to develop sustainable SC. Calculating and monitoring the emission level in the SC is a complex process. Therefore, collaboration along the SC is required to collect relevant data to identify the emission hotspots and implement strategies to reduce the emission level. The holistic view of SC considering the product life cycle would be appropriate for implementing the green practices in the SC.
References
Acquaye, A. A. and Duffy, A. P. (2010). Input-output analysis of Irish construction sector greenhouse gas emissions. Building and Environment 45(3), 784-791.
Acquaye, A. A., Wiedmann, T. and Feng, K. (2011). Identification of ‘Carbon Hot-Spots’ and Quantification of GHG Intensities in the Biodiesel Supply Chain Using Hybrid LCA and Structural Path Analysis. Environmental Science & Technology 45 (6), 2471-2478.
Acquaye, A., Genovese, A., Barrett, J., & Koh, L. (2014). Benchmarking Carbon Emissions
Performance in Supply Chains. Supply Chain Management: An International Journal,
19(3), 306-321.
Albino, V., Izzo, C. and Kühtz, S. (2002). Input–output models for the analysis of a
local/global supply chain. International journal of production economics, 78(2),
119-131.
Barrett, J. and Scott, K. (2012). Link between climate change mitigation and resource efficiency: A UK case study. Global Environmental Change 22(1): 299-307.
Bassi A.M., Powers R.,Schoenberg W. (2009). An integrated approach to energy prospects for North America and the rest. Energy Economics, 30-42.
Bernon, M. and Cullen, J. (2007). An integrated approach to managing reverse logistics,
International Journal of Logistics: Research & Applications,10 (1), 41-56.
Bowyer, C., Baldock, D., Tucker, G., Valsecchi, C., Lewis, M., Hjerp, P., and Gantioler, S. (2009). Positive planning for onshore wind expanding onshore wind energy capacity while conserving nature, [online] London: RSPB. Available at: http://www.rspb.org. uk/Images/Positive%20Planning%20for%20Onshore%20Wind_tcm9-213280.pdf (Last Accessed: 10th September 2013).
Brass, B. and McIntosh, M. W. (1999). Product, process, and organizational design for remanufacture - an overview of research, Robotics and Computer-Integrated Manufacturing, 15, 167-178.
Carbon Trust (2006). Carbon Footprints in the Supply Chain: The Next Step for Business.
Carter, C. and Easton, P. (2011). Sustainable supply chain management: evolution and future directions. International Journal of Physical Distribution & Logistics Management
41(1): 46-62.
Carter, C. R., & Ellram, L. M. (1998). Reverse logistics: A review of the literature and framework for future investigation. Journal of Business Logistics, 19, 85-102.
Committee on Climate Change (CCC) (2011). Costs of low carbon generation technologies – 2011 Renewable Energy Review – Technical Appendix. London: CCC. Available at: http://hmccc.s3.amazonaws.com/Renewables%20Review/RES%20Review%20Techn ical%20 Annex%20FINAL.pdf
Department of Energy and Climate Change (DECC) (2011). Estimated impacts of energy and climate change policies on energy prices and bills, London: DECC. Available at: http://www.decc.gov.uk/en/content/cms/meeting_energy/aes/impacts/impacts.aspx. DEFRA (2009). Plasterboard Sustainability Impacts and Initiatives – September 2009.
[Online]. Available at
http://archive.defra.gov.uk/environment/business/products/roadmaps/documents/plast erboard0909.pdf (Last accessed 12th September 2013).
DEFRA. (2010). Plasterboard Sustainability Action Plan – October 2010. [Online]. Available at http://www.defra.gov.uk/publications/files/pb13439-plasterboard-101019.pdf (Last accessed 15th September 2013).
DEFRA. (2011). Guidelines to Defra/DECC’s GHG Conversion factors for Company
Reporting, Available at
:http://archive.defra.gov.uk/environment/business/reporting/pdf/110707-guidelines-ghg-conversion-factors.pdf. (Last accessed 12th October 2013).
Duinker, P. and Greig, L. (2007). Scenario analysis in environmental impact assessment: Improving explorations of the future. Environmental Impact Assessment, 27 (3), 206 – 219.
Ecoinvent (2012). Database. [Online]. Available at http://www.ecoinvent.org/database/ (Last accessed 11th August 2013).
EUROSTAT (2008). Eurostat Manual of Supply, Use and Input-Output Tables,
European Commission (2007). Renewable Energy Road Map-Renewable energies in the 21st century: building a more sustainable future, COM(2006) 848 final.
Available at:
http://eur-lex.europa.eu/legal-content/EN/TXT/PDF/?uri=CELEX:52006DC0848&from=EN
(Accessed 25 February 2013)
Ferng, J.-J. (2009). Applying input–output analysis to scenario analysis of ecological footprints. Ecological Economics 69(2): 345-354.
Fiksel, J. (1996). Design for environment: Creating eco-efficient products and processes. New York: McGraw-Hill.
Gavirneni, S. (2005). Information centric optimization of inventories in capacitated supply chains: Three illustrative examples, In J. Geunes and P. M. Perdalos (eds.), Supply Chain Optimization, New York, USA: Springer Science Business Media, Inc.
Genovese, A., Lenny Koh, S. C., Kumar, N. and Tripathi, P. K. (2013a). Exploring the
challenges in implementing supplier environmental performance measurement
models: a case study. Production Planning & Control, (ahead-of-print), 1-14.
Genovese, A., Lenny Koh, S. C., Bruno, G., amd Esposito, E. (2013b). Greener supplier
selection: state of the art and some empirical evidence. International Journal of
Production Research, 51(10), 2868-2886.
Greenhouse Gas Protocol. (2011). Corporate Value Chain (Scope 3) Accounting and Reporting Standard. USA: World Resources Institute and World Business Council for Sustainable Development.
Gungor, A., and Gupta, S. M. (1999). Issues in environmentally conscious Manufacturing and product recovery: A survey, Computers & Industrial Engineering, 36, 811-853. HM Government (2010). Low Carbon Construction: Innovation & Growth Team, Final
Report. (Accessed 15th March 2013).
https://www.gov.uk/government/uploads/system/uploads/attachment_data/file/31773/ 10-1266-low-carbon-construction-IGT-final-report.pdf
Pichs-Madruga, Y. Sokona, K. Seyboth, P. Matschoss, S. Kadner, T. Zwickel, P. Eickemeier, G. Hansen, S. Schlömer, C. von Stechow (eds)]. Cambridge University Press, Cambridge, United Kingdom and New York, NY, USA.
Jayaraman, V., Patterson, R. A. and Rolland, E. (2003). The design of reverse distribution networks: Models and solution procedures, European Journal of Operational Research, 150(1), 128-149.
Johnson E. (2008). Disagreement over carbon footprints: A comparison of electric and LPG forklifts. Energy Policy. 36(4), 1569–1573.
Kassaye, W. and Verma, D. (1992). Balancing traditional packaging functions with new packaging concerns, SAM Advanced Management Journal, Autumn,15-29.
Kinnear E. (1997). Is there any magic in cross-docking?, Supply Chain Management: An International Journal, 2(2), 49 – 52.
Koh, S. C., Acquaye, A. A., Rana, N., Genovese, A., Barratt, P., Kuylenstierna, J., Gibbs, D. and Cullen, J. (2011). Supply Chain Environmental Analysis: A new system for delivering a low carbon supply chain. York, UK: The Centre for Low Carbon Futures.
Koh, Y. and Aoshima, Y. (2001). Recycle and reuse, Hitotsubashi Business Review, 49(3), 144-158.
Kolk, A. and R. van Tulder. (2005). Setting New Global Rules? TNCs and Codes of Conduct,
Transnational Corporations, 14(3), 1–17.
Lake, A., Acquaye, A., Genovese, A., Kumar, N., & Koh, S. C. L. (2014). An application of hybrid life cycle assessment as a decision support framework for green supply chains. International Journal of Production Research, 1-27. DOI:10.1080/00207543.2014.951092
Lund, R. (1984). Remanufacturing, Technology Review, 87 (2), 18–23.
Mattila, T. J., S. Pakarinen, and Sokka, L. (2010). Quantifying the Total Environmental Impacts of an Industrial Symbiosis - a Comparison of Process-, Hybrid and Input−Output Life Cycle Assessment. Environmental Science & Technology 44(11): 4309-4314.
McGregor, P. G., Swales, J. K. and Karen, T. (2008). The CO2 ‘trade balance’ between Scotland and the rest of the UK: Performing a multi-region environmental input– output analysis with limited data. Ecological Economics 66(4): 662-673.
McKinnon, A. C. (2006). A review of truck tolling schemes and assessment of their possible impact on logistics systems, International Journal of Logistics: Research and Applications, 9(3), 191-205.
McKinnon, A., Cuillinane, S., Browne, M. and Whiteing, A. (2010). Global Logistics: Improving the Environmental Sustainability of Logistics. London, UK: Kogan Page Limited.
Miller, R. E. and P. D. Blair (2009). Input-output analysis: Foundations and extensions. Cambridge, Cambridge University Press.
Minx, J. C., Wiedmann, T., Wood, R., Peters, G.P., Lenzen, M., Owen, A., Scott, K., Barrett, J., Hubacek, K., Baiocchi, G., Paul, A., Dawkins, E., Briggs, J., Guan, D., Suh, S. and Ackerman, F. (2009). Input–Output Analysis and Carbon Footprinting: An Overview of Applications. Economic Systems Research 21(3): 187-216.
Moon J. (2007). The contribution of corporate social responsibility to sustainable development. Sustainable Development 15(5), 296–306.
Porter, M. E. (2008). Competitive advantage: Creating and sustaining superior performance. New York: Simon and Schuster.
Ranconteur (2012). Low Carbon Business. [online] Ranconteur Special Publication. 3rd September 2012, Available at http://theraconteur.co.uk/category/business/low-carbon-business-business/ (Last Accessed 6th September 2013).
Sarkis, J., Zhu, Q., Lai, K. (2011). An organizational theoretic review of green supply chain management literature. International Journal of Production Economics 130(1): 1-15. Savasakan R.C., Bhattacharya S., and Wassenhove L.N.V. (2004). Closed-Loop Supply
Chain Models with product remanufacturing. Management Science. 50(2), 239–252. Scherer A.G., Palazzo G., Baumann D. (2006). Global Rules and Private Actors: Toward a
New Role of the Transnational Corporation in Global Governance. Business Ethics Quarterly, 16(4), 505–532.
Srivastava, S. (2007). Green supply-chain management: A state-of-the-art literature review.
International Journal of Management Reviews, 9(1), 53-80.
Strømman, A. H., Peters, G. P. and Hertwich, E. G. (2009). Approaches to correct for double counting in tiered hybrid life cycle inventories. Journal of Cleaner Production. 17(2), 248-254.
Suh, S. and Huppes, G. (2005). Methods for Life Cycle Inventory of a product. Journal of Cleaner Production 13(7): 687-697.
Sundarakani, B., De Souza, R., Goh, M., Wagner, S. M. and Manikandan, S. (2010).
Modeling carbon footprints across the supply chain. International Journal of
Production Economics, 128(1), 43-50.
Tan, K.C., Handeld, R.B. and Krause, D.R. (1998). Enhancing firm's performance through quality and supply base management: an empirical study. International Journal of Production Research, 36 (10), 2813-2837.
ten Raa, T. (2007). The Extraction of Technical Coefficients from Input and Output Data.
Economic Systems Research 19(4): 453-459.
Tibben-Lembke, R. and Rogers, D. (1998). The impact of reverse logistics on total cost of ownership. Journal of Marketing Theory and Practice, 6 (4), 51 – 60.
UK Green Building Council (2008). Construction and Sustainable Development. [Online].Available at http://www.ukgbc.org/content/key-statistics-0 (Last accessed 15th September 2013).
Vachon, S. and Klassen, R. D. (2008). Environmental management and manufacturing
performance: the role of collaboration in the supply chain. International Journal of
Production Economics, 111(2), 299-315.
Varma, A. and Clayton, A. (2010). Moving Goods Sustainably in Surface Transportation,
Institute of Transportation Engineers Journal, 80(3), 20-24.
Volvo (2012). Volvo Trucks Global. [online]. Available at http://www.volvotrucks.com/trucks/global/en-gb/trucks/new-trucks/Pages/volvo-fe-hybrid.aspx. (Last accessed 7th September 2013).
Wiedmann, T. O., Suh, S., Feng, K., Lenzen, M., Acquaye, A., Scott, K. and Barrett, J. R. (2011). Application of Hybrid Life Cycle Approaches to Emerging Energy Technologies – The Case of Wind Power in the UK. Environmental Science & Technology 45(13): 5900-5907.
Winkler, H. (2011). Closed Loop Production Systems-A Sustainable Supply Chain Approach.
CIRP Journal of Manufacturing Science and Technology, 151, 1-5.
Zhang, H. C., Kuo, T. C., Lu, H. and Huang, S. H. (1997). Environmentally conscious design and manufacturing: A state of the art survey. Journal of Manufacturing Systems, 16, 352-371.
Zhu, Q. and Sarkis, J. (2004). Relationships between operational practices and performance among early adopters of green supply chain management practices in Chinese manufacturing enterprises. Journal of Operations Management, 22, 265-289.
Zhu, Q., Sarkis, J., and Lai, K. H. (2008). Confirmation of a measurement model for green
supply chain management practices implementation. International Journal of
Figure 2: Distribution of life cycle emissions in plasterboard supply chain (base-case scenario). 18.68% 16.41% 14.67% 8.57% 8.33% 8.12% 7.31% 7.29% 2.30% 1.60% 1.17% 1.10% 1.06% 0.71% 0.68% 0.42% 0.29% 0.28% 0.28% 0.24% 0.17% 0.11% 0.07% 0.06% 0.05% 0.01% 0.02% 0.01% 0.01% 0.00% 0.00% 0.00% 0.00%
0.00% 5.00% 10.00% 15.00% 20.00% Road Transport (from Plant to Warehouse)
Oil (at Plant) Electricity (at Warehouse) Electricity (at Plant) Stucco (at Plant) Road Transport (to Plant) Outbound Logistics (at Warehouse)
Paper and Cardboard/Whiteline Chipboard (at…
1 Figure 3: Scenario 1- Life cycle emissions after introducing cross- docking in Plasterboard Supply chain
[image:38.595.117.483.346.497.2]2 Table 1: Color-code for emissions
Impact Interval Color-code
Low 𝑒𝑛≤ 1.00%
Moderate 1.00% < 𝑒𝑛≤ 5.00%
High 5.00% < 𝑒𝑛≤ 10.00%
3 Table 2: Relevant Secondary data retrieved from ECOINVENT
Supply Chain Input Name Quantity Unit Emissions in KgCo2
Cost (£)
washing agents alkylbenzene sulfonate, linear, petrochemical, at plant
0.00001 kg 1.63090 0.4692
electricity/supply mix electricity, medium voltage, at grid
0.09370 kWh 0.65700 0.082
glass/construction glass fibre, at plant 0.00016 kg 2.63510 0.497
oil/heating systems light fuel oil, burned in industrial furnace 1MW, non-modulating
1.36000 MJ 0.08670 0.0108
agricultural production/plant production
potato starch, at plant 0.00290 kg 0.71735 0.92
chemicals/inorganics silicone product, at plant 0.00013 kg 2.71060 0.4692
construction materials/binder stucco, at plant 0.81100 kg 0.07383 0.585
water supply/production tap water, at user 0.36400 kg 0.00032 0.001
transport systems/road transport, lorry 20-28t, fleet average
0.30000 tkm 0.19460 0.5
paper & cardboard/cardboard & corrugated board
whitelined chipboard, WLC, at plant
4
Table 3: Carbon emission data related to different operations in the warehouse
Activity Quantity Unit Emissions in KgCO2 Cost (in £)
Road Transport (from Plant to Warehouse) 0.69000 tkm 0.19460 0.50
Forklifts 0.00727 kg 0.67000 0.50
Outbound Logistics
(at Warehouse)
0.27000 tkm 0.19460 0.50
Electricity 0.16044 kwh 0.65700 0.08
5 Table 4: Life-Cycle Analysis Calculation (Base Case)
Input Name Amount Reference
Unit Avg. Unit Cost Emission Intensity Carbon Emissions Emissions % Category
Road Transport (from Plant to Warehouse)
0.69000 tkm £0.50 0.19460 0.13427 18.68% Transport to Warehouse Oil (at Plant) 1.36000 MJ £0.01 0.08670 0.11791 16.41% Utilities at Plant Electricity (at Warehouse) 0.16044 KWh £0.08 0.65700 0.10541 14.67% Utilities at
Warehouse Electricity (at Plant) 0.09370 KWh £0.08 0.65700 0.06156 8.57% Utilities at Plant
Stucco (at Plant) 0.81100 kg £0.59 0.07380 0.05985 8.33% Materials from Supplier Road Transport (to Plant) 0.30000 tkm £0.50 0.19460 0.05838 8.12% Transport to Plant Outbound Logistics (at Warehouse) 0.27000 tkm £0.00 0.19460 0.05254 7.31% Transport from
Warehouse Paper and Cardboard/Whiteline
Chipboard (at Plant)
0.04840 kg £0.14 1.08300 0.05242 7.29% Materials from Supplier Utilities (Indirect) N/A N/A N/A N/A 0.01650 2.30% Indirect Minerals (Indirect) N/A N/A N/A N/A 0.01150 1.60% Indirect Mining (Indirect) N/A N/A N/A N/A 0.00840 1.17% Indirect Transport and Communication
(Indirect)
N/A N/A N/A N/A 0.00790 1.10% Indirect
Construction (Indirect) N/A N/A N/A N/A 0.00760 1.06% Indirect Metals (Indirect) N/A N/A N/A N/A 0.00510 0.71% Indirect Forklift fuel consumption (at
Warehouse)
0.00727 kg £0.50 0.67000 0.00487 0.68% Transport inside Warehouse Business Services (Indirect) N/A N/A N/A N/A 0.00300 0.42% Indirect
Potato Starch (at Plant) 0.00290 kg £0.92 0.71740 0.00208 0.29% Materials from Supplier Fuels (Indirect) N/A N/A N/A N/A 0.00200 0.28% Indirect Agriculture (Indirect) N/A N/A N/A N/A 0.00200 0.28% Indirect Chemicals (Indirect) N/A N/A N/A N/A 0.00170 0.24% Indirect Wood and Paper (Indirect) N/A N/A N/A N/A 0.00120 0.17% Indirect Equipment (Indirect) N/A N/A N/A N/A 0.00080 0.11% Indirect Trade (Indirect) N/A N/A N/A N/A 0.00050 0.07% Indirect Glass (at Plant) 0.00016 kg £0.50 2.63510 0.00042 0.06% Materials from
Supplier Silicone Product (at Plant) 0.00013 kg £0.47 2.70160 0.00035 0.05% Materials from
6 Food (Indirect) N/A N/A N/A N/A 0.00010 0.01% Indirect Water supply (at Plant) 0.36400 kg £0.00 0.00030 0.00011 0.02% Utilities at Plant
Textiles (Indirect) N/A N/A N/A N/A 0.00010 0.01% Indirect Forestry (Indirect) N/A N/A N/A N/A 0.00010 0.01% Indirect Washing agents (at Plant) 0.00001 kg £0.47 1.63090 0.00002 0.00% Materials from
Supplier Fishing (Indirect) N/A N/A N/A N/A 0.00000 0.00% Indirect Water (at Warehouse) 0.00001 kg £0.01 0.65510 0.00001 0.00% Utilities at
Warehouse Personal Services (Indirect) N/A N/A N/A N/A 0.00000 0.00% Indirect
7 Table 5: Life-Cycle Analysis Calculation (Base Case) - Emissions by Category
Category Carbon Emissions Emissions %
Materials from Supplier 0.11514 16.02% Utilities at Plant 0.17958 24.99% Transport to Warehouse 0.13427 18.68% Utilities at Warehouse 0.10542 14.67% Transport to Plant 0.05838 8.12% Transport from Warehouse 0.05254 7.31% Transport inside Warehouse 0.00487 0.68% Total Direct Emissions 0.65020 90.47% Total Indirect Emissions 0.06850 9.53%