EUROPEAN COAL AND STEEL COMMUNITY
COMMISSION OF THE EUROPEAN COMMUNITIES
Financial report
for the year
1970No.16
2-EUROPEAN COAL AND STEEL COMMUNITY
COMMISSION OF THE EUROPEAN COMMUNITIES
Franco Maria Malfatti President Sicco L. Mansholt Vice-President Raymond Barre Vice-President Wilhelm Haferkamp Vice- President Albert Coppe Member Jean-Fran~ois Deniau Member Altiero Spinelli Member Albert Borschette Member Ralf Dahrendorf Member
The figures given in this report and in the attached balance sheet and statement of revenues and expenditures; together with the main features of loans contracted, summarized in annexel), are expressed in units of account of the European Monetary Agreement (EMA). All such amounts are the equivalents of sums in national currencies computed at the following rates for
1 EMA unit
US$ 1.00 OM 3.66
BFr
50.00FFr
5.55419 Lit. 625LFr
50.00Fl. 3.62
SFr
4.37282£
0.41666CONTENTS
Page
!-Borrowing operations . . . 8
II-Lending and guarantee operations. 9
III-Movement of reserves and allocations and the results of the year 15
ANNEXES .
!-Balance sheet as of 31 December 1970 19 II-Statement of revenues and expenditures for 1970
25
III-Main characteristics of loans contracted to 31 December 1970 30LUXEMBOURG, JULY 1971
This financial report relates to the calender year 1970, the eighteenth year of the European Coal and Steel Community's financial operations.
It may be recalled that since the entry into force of the Treaty establishing a single Council and a single Commission of the European Communities (1967), the Com-mission exercises the powers vested in the former High Authority by the Treaty of Paris, each of the three Communities continuing to be governed by its own Treaty. Consequently, this report refers only to the "Commission" of the European Com-munities unless the name "High Authority" has to be used.
During the year covered by this report, Community crude steel production in-creased by 1.9 million tons from 107.3 million tons in 1969 to 109.2 million tons in 1970. At the same time, coal production continued its downward trend, de-creasing from 171.2 million tons to 164.6 million tons.
Capital expenditures in the coal and steel industries in 1970 can as yet only be estimated on the basis of the forecasts by ECSC enterprises to the Commission on 1 January 1970.(1)
According to these estimates, about 156 million units of account should have been invested in the coal sector(2) in 1970 and 23 million in iron-ore mining. Experience shows, however, that the amounts estimated for the ECSC mining industries at the beginning o: the year are, in fact, in the Community mines no more than 85 to 90% correct. Real capital expenditures in 1970 may be expected to be something like 10% below the forecast referred to above ..
After four years marked by high capital investment (averaging 1 300 million units of account from 1961 to 1964), the years 1965, 1966 and 1967 were marked by a sharp downturn to only 932, 848 and 730 million units of account respectively in the iron and steel sector. 1968, however, marked the beginning of an upward trend with capital expenditure at 802 million units of account, followed by 1 039 million in 1969. According to the forecasts submitted by the iron and steel enterprises, this trend became even more marked in 1970, capital expenditure reaching about 1 688 million units of account, and new records may be expected in 1971 and 1972. Taken together, capital expenditure in the ECSC industries is expected to increase from 1 164 million units of account in 1969 to about 1 821 in 1970.
(1) See "Investment in the Community's coal and steel industries : Report on the 1970 survey",
Luxembourg, July and November 1970.
(') Without pithead power stations and other generating plants.
17'""BORROWING OPERATIONS
1970 was marked by a high level of interest rates, both on the national and inter-national capital markets. In these circumstances, the Commission decided to restrict its borrowing operations to .the simple accumulation of funds required for financing the most urgent projects, postponing others.
From January to November, only one loan was contracted : a private loan of 500 million Belgian francs raised in June 1970 from a group of Belgian banks at 8.75% per annum for a term of 20 years.
A slight relaxation was observed towards the end of the year, and the Commission issued in December 1970 a debenture loan of 50 million units of account on the European capital market. This loan, issued at par at 8% per annum for a term of 15 years, was guaranteed by a syndicate of banks from the six Community countries. The value of the EMA units, symbolised by the sign
t,
was fixed for the whole term .of the loan at DM3.66 of BFr50.00 or FFr5.55419 or Lit.625 or Lfr.SO.OO or F1.3.62 at the discretion of the holder.The use of this formula which, for the first time, links together in terms of their official parities the currencies of the Member Countries, made it possible to forestall the downward trend and obtain better conditions than those prevailing on the various markets for long-term loans. The attraction of the formula moreover aroused the interest of savers from a number of different countries, thereby mobil-ising a volume of funds which was quite considerable in size compared to that of conventional issues.
Although these operations would be carried out on the international capital market, they enable the monetary authorities concerned to gain an appreciation of the movements of funds to which they give rise, since the currency used must be that of one of the six countries both on subscription and on payment of interest and capital to title holders.
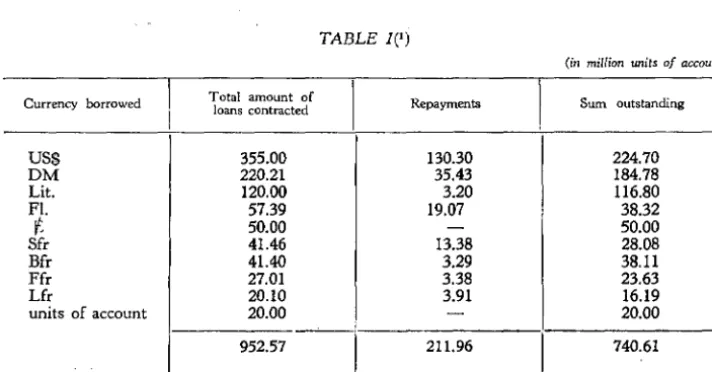
Ta~ing these two operations for 1970 into account, the total amount of loans con-tracted by the ECSC since it began functioning, to 31 December 1970 reached the value of 952.57 million EMA units of account.
The following Table shows the loan position as of 31 December 1970.
TABLE 1(1)
(in miC/ion units of account)
Currency borrowed
l
Total amount of loans contractedI
Repayments Sum outstandingUS$ 355.00 130.30 224.70
DM 220.21 35.43 184.78
Lit. 120.00 3.20 116.80
Fl. 57.39 19.07 38.32
t
50.00-
50.00Sfr 41.46 13.38 28.08
Bfr 41.40 3.29 38.11
Ffr 27.01 3.38 23.63
Lfr 20.10 3.91 16.19
units of account 20.00
-
20.00952.57 211.96 740.61
{1) The main characteristics of loans contracted by the ECSC to 31 December 1970 are set· out in Annex III.
[image:6.597.118.474.505.691.2]II-LENDING AND GUARANTEE OPERATIONS
The total amounts available to the Commission in 1970 for lending to enterprises was 40.78 million units of account.
The total amount is made up as follows :
1) Borrowed funds
(i) already available at beginning of year (ii) Belgian loan(1)
(iii) anticipated repayments
2) Own resources
(i) unexpended receipts from previOus years (ii) drawings on allocations
{iii) repayments on earlier loans
22.51 10.00 1.79
34.30
2.56 1.02 2.90
6.48
Total 40.78
As in 1969, these funds were used to loans to industry, for redevelopment and reconversion projects and for the building of workers' housing. It is worth men-tioning that the loans to industry and the loans for redevelopm2nt and reconversion projects were financed wholly out of borrowed funds and the home-building loans out of the ECSC' s own resources.
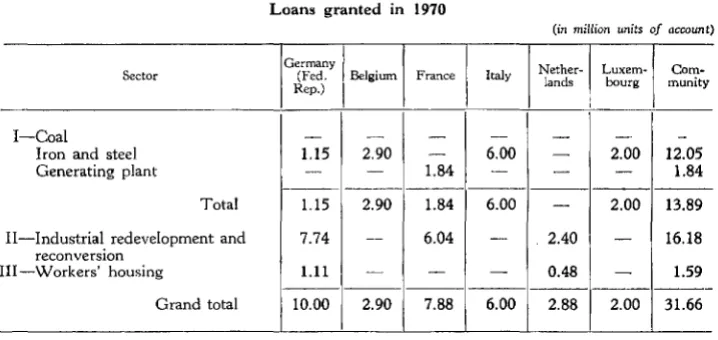
For reasons already explained, only applications deemed to have priority and to be of an urgent nature were considered during the period of prevailing high interest rates. In 1970 loans worth a total of 31.66 million units of account were granted, leaving unexpended funds of 4.89 units of account from the ECSC's own resources and 4.23 from loan capital.
TABLE 2
Loans granted in 1970
(in million units of account)
Germany
I
Nether-I
Luxem- Com-Sector (Fed. Belgium France Italy lands bourg munityRep.)
I
' 'I-Coal
-
- - - --
-·-Iron and steel 1.15 2.90 - 6.00 - 2.00 12.05 Generating plant - - 1.84 -
-
- 1.84- - - -- - -
- - -
-Total 1.15 2.90 1.84 6.00
-
2.00 13.89ll-Industrial. redevelopment and 7.74 - - 6.04 - 2.40 - 16.18 reconversiOn
III-Workers' housing 1.11 -
-
- 0.48-
1.59- - -- - - -
-Grand total 10.00 2.90 7.88 6.00 2.88 2.00 31.66
(1) The product of the loan of 50 million EMA units of account was not paid until January 1971.
[image:7.589.109.468.505.675.2]1. Loans for industrial investment projects
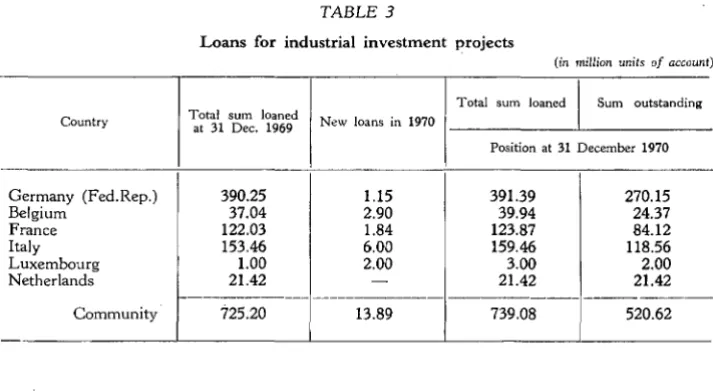
Loans to the coal and steel industries diminished in favour of the financing of industrial investment projects under Article 56 of the ECSC Treaty.
Loans to industry in 1970 amounted to 13.89 million of account. Owing to the steady increase during the year in the cost of raising such funds, the interest rates at which these loans were granted were 7.25% until 18 March 1970 and 8.25% after that date.
In present circumstances and within the limits of the resources available low-interest terms may, pursuant to a decision of the Commission published in the Official Gazette of the European Communities on 18 June 1970, be applied to loans for financing certain capital projects in the coal and steel industries which are of particular importance to the Community. The investment which the Commission has in mind are those which concern safety and hygiene in industrial plants, the integration within the Community of ESCC enterprises (multinational investments), the elimination of bottlenecks affecting an entire ECSC industry, or the establish-ment of research or vocational training centres within the ECSC field. These new low-interest rate terms were first applied at the beginning of 1971 for coking plant investment.
The projects assisted in 1970 all fall within the priority classes laid down in the Community's "General Objectives", as follows :
Coal mining industry :
Pithead power stations likely to use low-grade fuels
Charbonnages de France, Paris (Houilleres du Bassin de Lorraine)
Iron and Steel Industry :
Oxygen steel-making :
Italsider Spa, Genoa (Taranto Works);
Continuous casting :
Mannesmann AG, Dusseldorf (Duisburg-Huckingen Works);
Rolling mill modernization and specialization :
· Cockerill-Ougn~e-Providence and Esperance-Longdoz SA, Seraing (Marchien-ne and Athus Works);
SA Miniere et Metallurgique de Rodange, Rodange;
SA Siderurgique maritime "Sidmar", Ghent.
TABLE 3
Loans for industrial investment projects
(in million units of account)
Total sum loaned Sum outstanding Country Total sum loaned at 31 Dec. 1969 New loans in 1970
Position at 31 December 1970
Germany (Fed.Rep.) 390.25 1.15 391.39 270.15
Belgium 37.04 2.90 39.94 24.37
France 122.03 1.84 123.87 84.12
Italy 153.46 6.00 159.46 118.56
Luxembourg 1.00 2.00 3.00 2.00
Netherlands 21.42 - 21.42 21.42
t--
-Community 725.20 13.89 739.08 520.62
-2. Loans for industrial redevelopment and reconversion
During 1970, loans for redevelopment and reconversion projects, as in the previous years, accounted for a substantial part of the ECSC's financial activities. Borrowed funds once again provided the capital required.
Previous reports had already underlined the fact that the terms for redevelopment and reconversion were usually special ones. At the beginning of the year it was still possible to offer an interest rate as low as 4.5% for the first five years either for the whole loan or only for part of it, depending on the reemployment facilities provided. But this special rate had to be raised to 5.5% after 29 April 1970. The normal interest rate payable after the fifth year of the loan in any case followed the same trend as that applying to industrial loans, rising from 7.25% to 18 March 1970 to 8.25% subsequent to that date.
The total amount of loans granted in 1970 was 16.18 million units of account; this total consisted of 14 loans, the recipients of which are listed below according to region :
Germany (Fed. Rep.)
Leichtmetall-Gesellschaft mbH, Essen Signode System GmbH, Dinslaken
Mannesmann Aktiengesellschaft, Dusseldorf Pigment Chemie GmbH, Cologne
Salzgitter Huttenwerk AG, Salzgitter-Dri.itte
France
SA des Usines Chausson, Asnieres-sur-Seine (Hts-de-Seine)
Ste Constructions Mecaniques de Carvin, Ermenonville (Oise)
SA Automobiles Citroen, Paris
Netherlands
Natron-Chemie NV, Rotterdam NV Raypak Produkten, Kerkrade
NV van der Burg's Borstelfabrieken, Kerkrade NV Ventair, Maastricht
NV Sigrano Nederland, Heerlen NV Interchrome Nederland, Maastricht
Ruhr Region Ruhr Region Ruhr Region Ruhr Region Lower Saxony
Northern France
Northern France Lorraine
South Holland Limburg Province Limburg Province Limburg Province Limburg Province Limburg Province
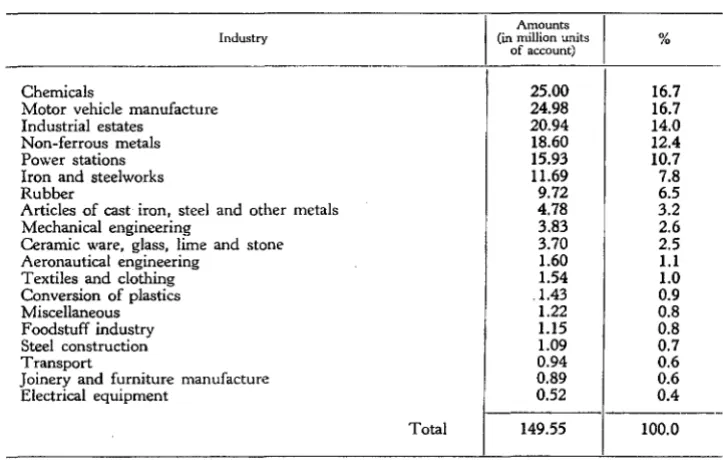
[image:9.588.109.466.86.281.2]Table 4 summarizes these types of loans by countries and by industries, whatever branch of industry may be concerned. The firms involved undertook to find jobs for former miners and steelworkers made redundant by the closure of pits or steel-works, or by the reduction or the change in the activities of those enterprises at which they were employed.
TABLE 4
Loans for industrial redevelopment and reconversion
A-Breakdown by countries
(in million units of account)
Total sum Total sum
I
Total
re-I
Sum out-loaned at New loans loaned payments standing Country 31 December in 19701970 Position at 31 December 1970
Germany (FR) 36.04 7.73 43.77 0.09
Belgium 29.02 - 29.02 3.04
France 20.90 6.04 26.95 0.70
Italy 26.76 - 26.76 3.81
Luxembourg - -
-
-Netherlands 20.65 2.40 23.05 0.35
Community 133.37(1) 16.17 149.55 7.99
(') 126.48 million loaned from borrowed funds and the balance from the Community's own resources.
B-Breakdown by industries
Chemicals
Motor vehicle manufacture Industrial estates
Non-ferrous metals Power stations Iron and steelworks Rubber
Industry
Articles of cast iron, steel and other metals Mechanical engineering
Ceramic ware, glass, lime and stone Aeronautical engineering
Textiles and clothing Conversion of plastics Miscellaneous Foodstuff industry Steel construction Transport
Joinery and furniture manufacture Electrical equipment
Total
Amounts
(in million units
of account) 25.00 24.98 20.94 18.60 15.93 11.69 9.72 4.78 3.83 3.70 1.60 1.54 .1.43 1.22 1.15 1.09 0.94 0.89 0.52 149.55
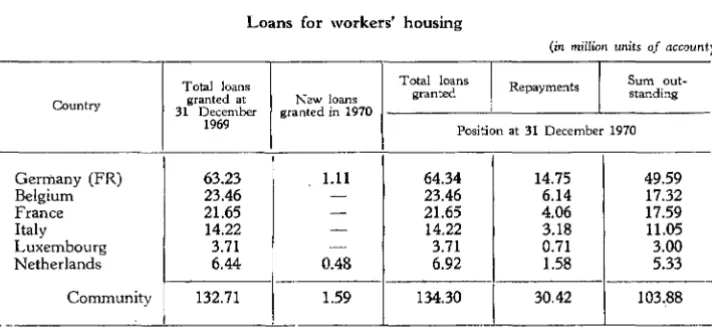
3. Loans for workers' housing
43.67 25.98 26.25 22.95 -22.70 141.55 % 16.7 16.7 14.0 12.4 10.7 7.8 6.5 3.2 2.6 2.5 1.1 1.0 0.9 0.8 0.8 0.7 0.6 0.6 0.4 100.0
[image:10.588.116.477.190.343.2] [image:10.588.114.476.386.616.2]be increased subsequently, depending on the funds available from the Community's own resources. During 1970, the Commission paid out 1.59 million units of account under its sixth workers' housing programme, and, concerning the seventh pro-gramme, completed the consultation procedure and sounded out the wishes of national and regional authorities, the employers' associations and the workers' trade unions. The first payments under the seventh programme will be made in 1971.
It will be recalled that loans for workers' housing are, in principle, financed from the Special Reserve, i.e. the ECSC's own resources. These loans are also, as a rule, furnished in the currency of the country concerned to avoid any exchange risks to the recipients.
The very low interest rates applied enable borrowers to combine this type of loan with other capital raised from national sources at terms prevailing on these markets. This combination makes it possible to increase considerably the means available, while at the time maintaining the average rate at a favourable level. The Community raises other capital either directly by using borrowing funds or indirectly by asso-ciating institution investors with the financing of the projects concerned.
TABLE 5
Loans for workers' housing
(in million units of account)
Total loans Total loans Repayments
I
Sum out·
granted standing
Country 31 December granted at granted in 1970 New loans
1969 Position at 31 December 1970
Germany (FR)
I
63.23 1.11 64.34 14.75 49.59Belgium 23.46 - 23.46 6.14 17.32
France 21.65 - 21.65 4.06 17.59
Italy 14.22 - 14.22 3.18 11.05
Luxembourg 3.71 -- 3.71 0.71 3.00 Netherlands 6.44 0.48 6.92 1.58 5.33
-Community 132.71 1.59 134.30 3Q.42 103.88
4. Guarantees
The ECSC Treaty provides that the Commission may also facilitate the implemen-tation of enterprises' investment programmes by guaranteeing loans which they obtain from outside sources.
Since the Commission studies both the technical and financial aspects of the in-vestment programme concerned before making a decision, such a guarantee has the double advantage of covering lenders against all financial risks and providing them with guidance as to the economic soundness of the project, particularly regarding the compatibility of iron and steel and colliery projects with the General Objectives as provided by Article 54, and of redevelopment and reconversion projects with the Community's industrial, regional and social policy.
This type of financial backing, of course, does not aim to cover the lenders' risks but assists the firms concerned in negotiating loans on capital markets outside their own countries, to which access would normally be difficult for them, on the same terms as borrowers regarded as first-class risks.
[image:11.590.113.469.315.478.2]The commission charged for such guarantees has been kept so low that it has little effect on the cost of the operations concerned. No new requests for guarantees were received in 1970. Contractual repayments on loans previously guaranteed, amount-ing to 48.72 million units of account, have reduced commitments under this heading to 31.80 million units of account on 31 December 1970.
5. Overall survey of direct lending operations
(1954-1970)
Up to 31 December 1970 and since its inception, the ECSC has granted loans amounting in all to 1 033 million units of account made up of 927.66 million units of account from borrowed funds and 105.34 million units of account from its own resources.
Including guarantees furnished over the same period, the total amount of ECSC financial assistance was 1 081.72 million units of account.
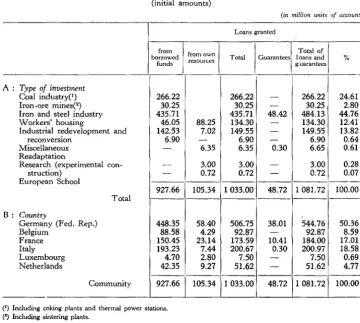
Table 6 below gives a detailed breakdown of this assistance by sectors and by countries.
TABLE 6
Loans and guarantees granted to 31 December 1970 by sector and by country (initial amounts)
bo~~~~ed
I
from own funds resourcesA : Type of investment
Coal industry{') 266.22 Iron -ore mines(2) 30.25 Iron and steel industry 435.71
\Vorkers' housing 46.05 88.25 Industrial redevelopment and 142.53 7.02
reconversion 6.90
-Miscellaneous - 6.35
Readaptation
Research (experimental con- - 3.00
struction) - 0.72
European School
927.66 105.34 Total
B: Countrv
Germi'ny (Fed. Rep.) 448.35 58.40
Belgium 88.58 4.29
France 150.45 23.14
Italy 193.23 7.44
Luxembourg 4.70 2.80 Netherlands 42.35 9.27
Community 927.66 105.34
(1) Including coking plants and thermal power stations. (') Including sintering plants.
(in million units of account)
Loans granted
I
I
Tom! of Tom! Guarantees. I oans and %guarantees
266.22 - 266.22 24.61 30.25
-
30.25 2.80 435.71 48.42 484.13 44.76 134.30-
134.30 12.41 149.55 - 149.55 13.82 6.90 - 6.90 0.64 6.35 0.30 6.65 0.613.00 - 3.00 0.28 0.72 - 0.72 0.07
1033.00 48.72 1 081.72 100.00
506.75 38.01 544.76 50.36 92.87 - 92.87 8.59 173.59 10.41 184.00 17.01 200.67 0.30 200.97 18.58 7.50 - 7.50 0.69 51.62
-
51.62 4.77 [image:12.592.117.478.380.703.2]The financial activity of the past year related in this report was made possible by the active help of banking groups and the agents in the various ECSC countries. The Commission offers its sincere gratitude to all those who have given their assis-tance in this way. At the same time it wishes to thank the Bank for International Settlements in Basle for its efficient cooperation as a depository for those trans-actions passed under the "Act of Pledge". (1)
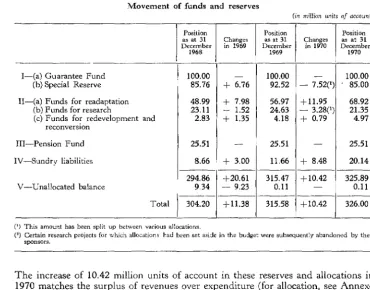
III-MOVEMENT OF RESERVES AND ALLOCATION AND THE RESULTS OF THE YEAR
The Table below shows the movement of reserves and allocations of the ECSC for each year from 31 December 1968 to 31 December 1970.
TABLE 7
Movement of funds and reserves
(in million units of account)
Position Position Position as at 31 Changes as at 31 Changes as at 31 December in 1969 December in 1970 December
1968 1969 1970
I-(a) Guarantee Fund
I
100.00 - 100.00 - 100.00 (b) Special Reserve 85.76 + 6.76 92.52 - 7.52(1) 85.00
II-(a) Funds for readaptation 48.99 + 7.98 56.97 + 11.95 68.92 (b) Funds for research 23.11 + 1.52 24.63 - 3.28(1) 21.35 (c) Funds fo~ redevelopment and 2.83 + 1.35 4.18 + 0.79 4.97
reconversiOn
III-Pension Fund 25.51 - 25.51 - 25.51
IV-Sundry liabilities 8.66 + 3.00 11.66 + 8.48 20.14
-294.86 +20.61 315.47 +10.42 325.89 V-Unallocated balance 9.34 - 9.23 0.11 - 0.11
Total 304.20 + 11.38 315.58 +10.42 326.00
(l) This amount has been split up between various allocations.
(2) Certain research projects for which allocations had been set aside in the budget were subsequently abandoned by their
sponsors.
The increase of 10.42 million units of account in these reserves and allocations in 1970 matches the surplus of revenues over expenditure (for allocation, see Annexe II).
Revenues consisted mainly of :
i) the levy which was fixed at 0.30% on 1 July 1967 and has remained unchanged since that date;
ii) income from the management of funds.
(1) A contract of surety concluded by the ECSC at the start of its operations in favour of its fund raisers in order to provide better access to the international market. The Act of Pledge goYerns all loans contracted before 1961, when the ECSC obtained the consents of its lenders to issue its loan stock without special surety.
[image:13.594.100.471.287.577.2]ECSC funds available for investment did not undergo any major fluctuations during 1970. As in the past, the investment policy pursued was designed to produce the maximum yield from assets compatible with the maintenance of adequate liquidity.
ANNEXES
I-BALANCE SHEET AS OF 31 DECEMBER 1970
II-REVENUES AND EXPENDITURES FROM I JANUARY TO 31 DECEMBER 1970
Annexe I
BALANCE SHEET
OF THE EUROPEAN COAL AND STEEL COMMUNITY
AS OF 31 DECEMBER 1970
All amounts are stated in EMA units of account and are the equivalent of various currencies computed at the following rates for 1 EMA unit of account: US$1
=
ASSETS
!-Disbursed loans 770 978 185.40
II-Cash and due from banks 159 735 683.18
III-Investments 66 270 449.97
IV-Fixed assets 1.00
V-Recoverable issuing costs 12 357 765.33
VI-Miscellaneous 16 511 486.03
VII-Regularization account 20 768 729.80
1 046 622 300.71
I-Due on debentures 50 000 000.00
II-Enterprises' liabilities under guarantees 31 804 329.66
Auditor's Note
Having examined the books, vouchers and documents of the book-keeping and the explanations supplied to me, I herewith certify that the financial position of the European Coal and SteeLCommunity as of 31 December 1970 is correctly and properly reflected in the above document.
Luxembourg, 26 April 1971.
20
J.
DE ST AERCKE!-Loans
II-Reserves
A. Guarantee Fund
B. Special Fund
III-Allocations
A. For financial aid
B. For other purposes
IV-Former Pension Fund
V-Miscellaneous
VI-Regularization account
VII-Unallocated balance
!-Debentures to be paid
II-Liabilities under guarantees
100 000
85 000
000.-95 240 411.38
20 142 946.66
LIABILITIES
690 605 721.49
185 000
000.-115 383 358.04
25 509 350.79
15 189 333.55
14817581.79
116 955.05
1 046 622 300.71
50 000
000.-31 804 329.66
For the European Coal and Steel Community
The Commission of the European Communities
F.
GILLETExplanatory Notes to the Balance Sheet as of 31 December 1970
ASSETS
!-Disbursed loans
A. Loans from funds borrowed
in US dollars
m German (W) marks
ln I tali an lire
ln Belgian francs
ln Dutch guilders
ln French francs
m units of account
in Swiss francs
in Luxembourg francs
222 727 200.00
183 179 769.25
116 800 000.00 47 200 634.54
38 139 502.78
23 630 808.45
20 000 000.00
18 070 947.36
16 191 080.72 685 939 943.10
The loans from funds borrowed in Belgian francs amount to 10 092 434.54 units of account, or 43 729 000.- Swiss francs granted with exchange guarantee.
B. Other loans
Loans from Special Fund for the financing of housing projects
Loans from Special Fund for reconverswn
Loans from funds allocated for readaptation
Loans from funds allocated for research
Miscellanea us
III-Investment
73 217 215.84
6 892 422.39
436 667.92
2 462 504.69
2 029 431.46
Total investments amount to 66 270 449.97 units of account.
IV-Fixed assets
This item refers to building owned by the ECSC. These are :
85 038 242.30
1) a building in Paris, rue des Belles-Feuilles (in co-ownership with the other two European Communities);
2) a building in London owned by the Community on long-lease tenure.
Their purchase prices have been written-off to a value of one unit of account.
V-Recoverable issuing costs
The amount of 12 357 765.33 units of account represents issuing costs on loans. They are recoverable in annual fractions over the remaining life of the loans.
VI-Miscellaneous
The total amount of 16 511 486.03 units of account consists of :
1) 1 404 803.13 units of account due from debtors subject to the ECSC-levy;
2) 501 970.85 units of account due from various other debtors;
3) 14 604 712.05 units of account, funds set aside for the payment of overdue coupons and of drawn bonds.
VII-Regularization account
This item consists of :
1) interest and commissions receivable but not yet due on 31 December 1970 : 17 839 010.59 units of account;
2) levy claimed over the month of December, but becoming due after 31 December: 2 929 719.21 units of account.
LIABILITIES
!-Loans
in U.S. dollars
in German (W) marks
in Italian lire
in Dutch guilders
in Belgian francs
in Swiss francs
in French francs
in units of account
in Luxembourg francs
III-Allocations
A. For financial aid
1) for readaptation
224 700 000.00 184 781 955.05
116 800 000.00
38 321 546.98
38 109 200.00
28 071 130.29
23 630 808.45
20 000 000.00
16 191 080.72
commitments entered into for grants
2) for research
commitments entered into for grants
3) for reconversion
B. For other purposes
IV-Former ECSC Pension Fund
690 605 721.49
68 919 330.47
21 346 413.55
4 974 667.36
95 240 411.38
20 142 946.66
V-Miscellaneous
Of the total, a sum of 14 604 711.19 units of account refers to bonds and coupons payable as well as to commissions on these operations. The remainder of 584 622.36 units of account refers to various liabilities.
VI-Regularization account
Consists of interest and commissions payable but not yet due on 31 December 1970, totalling 14 817 581.79 units of account.
VII-Unallocated balance
The sum of 116 955.05 units of account represents unallocated excess of revenues over expenditures.
-Note : Till July 1961 the claims and related securities under loans granted from
funds borrowed as well as other items of the assets are pledged to the Bank for International Settlements in Basle in favour of the holders of Secured Notes and Coupons issued by the ECSC,
on the assets, Item I for 121 368 555.81 units of account, Item II for 2 177 718.20 units of account and Item VII for 2 258 268.07 units of account,
on the liabilities, Item I for 123 341 355.81 units of account and Item VI for 2 162 691.62 units of account.
24
Annexe II
REVENUES AND EXPENDITURES
OF THE EUROPEAN COAL AND STEEL COMMUNITY
FROM 1.1.1970 TO 31.12.1970
(Including revenues and expenditures in connection with borrowing and lending operations)
All amounts are stated in EMA units of account and are the equivalent of various currencies computed at the following rates for 1 EMA unit of account: US$1 =
EXPENDITURES
A. Expenditures in connection with borrowing operations 43 990 735.32
B. Budgetary expenditures :
Administrative expenditures 18 000 000.00
Expenditures for research 12 459 424.99
Expenditures for readaptation 11 362 948.95
Coke aid 2 626 800.00 44449173.94
c.
Other expendituresFinancial expenses 45 078.16
Bonification reconversion 1 089 637.22 1 134 715.38
D. Excess of revenues over expenditures 10 426 408.83 100 001 033.47
The following allocations and withdrawals were made
Allocations
to the Special Fund
for financial aid
to other funds
7 518 103.46
9 458 002.41
8 486 509.88
10 426 408.83
Auditor's Note
Having examined the books, vouchers and documents of the book-keeping and the explanations supplied to me, I herewith certify that the financial position of the European Coal and Steel Community as of 31 December 1970 is correctly and properly reflected in the above document.
Luxembourg, 26 April 1971.
26
J.
DE STAERCKEA. Revenues from lending operations
B. Levy
C. Other revenues
· Interest on deposits and investments
Fines
Miscellaneous
15 070 380.77
212 254.24
38 733.65
REVENUES
45 174 329.44
39 505 335.37
15 321 368.66
100 001 033.47
For the European Coal and Steel Community
The Commission of the European Communities
F. GILLET
Explanation of the revenues and expenditures of the ECSC during the period from 1 January 1970 to 31 December 1970 (in units of account)
EXPENDITURES
A-The expenditures in connection with borrowing operations totalling 43 990 735.32 units of account consist of :
Interest on funds borrowed
Fees to agent banks
Miscellaneous
Redemption of recoverable issuing costs
REVENUES
39 744 147.80
763 799.49
351 040.47
3 131 747.56
B-The revenues from lending and guarantee operations totalling 45 174 329.44 units of account consist of :
Interest on loans
Guarantee fees
Sundry receipts
28 -:t ~
42 650 886.60
165 476.40
Annexe III
I
Initial amount
An1ount outstanding at
Year
of Interest Term 31 December 1970
issue % p.a. (years) Equivalent in (equivalent in In currency of loan EMA Units of account
E1v1A units of account
1954 37/s 25 US-Dollar. 100 000000 100 000 000 51200 000 1957 5 '/z 18 25 000 000 25 000000 9 800 000 1957 5 5 10 000000 10 000000 -1958 5 20 35 000000 35 000000 18 900 000 1958 4'/z 5 15 000000 15 000000 -1960 5 Sfs 20 25 000 000 25 000 000 16 750 000 1960 4 8/4 -5 3-5 10 000000 10 000 000 -1962 5 '/4 20 25 000 000 25 000 000 20 050 000 1964 5 '/ 4 20 30000 000 30 000 000 28 000000 1966 6'/z 20 15 000 000 15 000000 15 000000 1966 6'' /2 20 20 000000 20 000000 20 000 000
1967 6'/a 20 25 000 000 25 000000 25 000 000 1967 6 5/s 20 20 000 000 20 000 000 20 000 000
355 000 000 224 700 000
1955 3
a;4
25 DM 50 000 000 13 661 202 6 800 246 1957 4'/ 4 20 2 977 450 813 511 358 758 1964 5s;.
12 100 000 000 27 322 404 18 306 011 1964 5 '/z 15 100 000 000 27 322 404 20 519 126 1%4 5s;4
12 30 000 000 8 196 722 4918 033 1965 5 '/z 18 150 000 000 40 983 607 40 983 607 1965 5 '/z 5 23 000 000 6 284153 -1967 6 s;, 5 30 000 000 8196 722 5 464481 1968 6'/z-67/s 10 120 000 000 32 786 885 32 786 885 1968 6'/, 13 60 000 000 16393 443 16 393 443 1969 6'/ 4 15 40 000 000 10 928 961 10 928 961 1969 6'/z 13 50 000 000 13 661202 13 661 202 1969 6a;4
15 50 000 000 13 661 202 13 661 202220 212 418 184 781 955
1963 5'/a 20 Lit. 15 000 000 000 24 000000 20 800 000 1966 6 20 15 000 000 000 24 000000 24 000 000 1966 6 20 15 000 000 000 24000000 24 000000 1968 6 20 15 000 000 000 24000000 24 000 000 1968 6 20 15 000 000 000 24000000 24000000
120 000 000 116 800 000
1961 4'/, 5 Fl. 10 000 000 2 762 431 -1961 4'/a 20 50 000000 13 812 155 10110 497 1962 4 a;, 20 25 000000 6 906077 5 538 674 1962 4 3(, 25 6 000000 1657 459 1 127 072 1962 4'/a 5 20 000000 5 524862
-1963 4'/a 5 10 000 000 2 762431 -1963 4 5fs 30 1750 000 483 425 371271 1964. 5 s;, 20 25 000 000 6 906 077 6 450 276 1965 5 a;' 20 40 000 000 11049 724 11049 724 1967 6 a;, 5 20 000 000 5 524 862 3 674 03357 389 503 38 321 547
1970 8 15
t (')
50 000 000 50 000 000 50 000 0001956 4'/, 18 SFr 50 000000 11434269 3 716 137 1961 5'/' 5 9 000000 2058 168
-1961 4'/z 5 2 290 000 523 689
-1962 4'/a 18 60000 000 13 721 123 10633 870 1969 5'/a 18 60 000 000 13 721 123 13 721123
- - - 41 458 372 28 071130
Initial amount
I Amount outstanding at
Year
of Interest Term
I
31 December 1970 issue % p.a. (years) Equivalent in (equivalent in
In currency of loan EMA units of account E1v1A units of account
brought forward 844 060 293 642 674 632
1957 3'/z 25 BFr 200 000 000 4 000 000 2 372 000 1957 3 '/2 25 20000 000 400 000 237 200 1962 51/, 20 300 000 000 6 000 000 5 040 000 1963 5 '/s 20 300 000 000 6 000 000 5 460 000 1968 6 s/, 15 750 000 000 15 000 000 15 000 000 1970 8 s/, 20 500000 000 10 000 000 10 000 000
41 400000 38109 200
1964 5 20 Fr 150 000 000 27 006 638 23 630 808
1957 31/2 25 FL. 5 000 000 100 000 -1957 5 Bfs 25 100 000 000 2 000 000 1 398 854 1961 5 lj, 25 100 000 000 2 000 000 1 697 663 1961 5 25 100 000 000 2 000 000 1 690 608 1962 4 a;, 15 300 000 000 6 000 000 4 200 000 1962 5 lfs 25 250000 000 5 000 000 4 403 956 1964 5 B' Is 20 150000 000 3 000 000 2 800 000
20100 000 16 191 081
1966 5 s;, 20 RE (2) 20 000 000 20 000 000 20 000 000
952 566931 740 605 721
(') The European Monetary Unit ( ~ ) is a unit of account, the value of which is invariably fixed at DM 3.66 or BFr 50 or FFr 5.55419 or Lit. 625 or LFr 50 or Fl. 3.62 depending on the choice of the holder. This loan was guaranteed on 11 December 1970 and paid on 5 January 1971.
(') At present, this unit of account has the same value as that used by the former European Payments Union, as defined in Article 26(a) of the latter's charter, i.e. 0.88867088 grammes of fine gold. This value may change under certain circumstances.