Deliberation and implementation activity in
forced-choice decision making environments:
Variations in information processing within a
neurocognitive framework
Thesis submitted in accordance with the requirements of the
University of Liverpool for the degree of Doctor of Philosophy
By
Michael H. D. Humann
i
ABSTRACT
This thesis examined decision making in the context of forced-choice situations, as characterised by high-risk consequences and time-limited conditions, within an experimental decision paradigm. By mapping onto basic decision-making stages relating to evaluation, deliberation and implementation of a choice, this research looks at how environmental conditions (emotion) and information (advice) affect cognitive processing in forced-choice or “do or don’t” scenarios. In order to identify these variations on a more fundamental level, a methodological framework was developed, which incorporates neurocognitive, behavioural and qualitative measures.
Results identified the distinct sequence of cognitive processes as predicted from basic decision-making models. When individuals lacked any meaningful information to assist in solving the tasks, their responses varied based on the consequential conditions they faced, leading to an accelerated engagement with the decision and faster response, the riskier the outcome. On the other hand, when information was available during the task, differences in responses followed predictions about information processing and cognitive effort required for the different levels of clarity. Here, the consequential conditions did not affect performance, as individuals prioritised the information available. Further, when solving a task lacking any meaningful information on which to base their choice, individuals still engaged in redundant deliberation. Taken together, the research suggests that outcome uncertainty and task ambiguity have a demonstrable effect on the decision-making process.
ii
ACKNOWLEDGEMENTS
A number of people have contributed to the completion of this
thesis, and a few of those merit special thanks for their support and
significant contribution.
Professor Laurence Alison, for whom I am immensely grateful to
for his support, advice and patience. He was always able to encourage
ideas and conversations, allowing me to articulate new propositions,
enthusiastic about the possibility of advancing work in more unfamiliar
areas.
Professor Andrej Stancak, whose guidance was invaluable in the
development of my ideas, and whose support helped me to advance these
into new territories.
Everyone at the University of Liverpool, and especially those
people in the Centre for Critical and Major Incident Psychology, for their
help and friendship. I would like to thank all those who assisted me
during the data collection, and further supported me throughout my time
in Liverpool.
My good friends, near and far, who have helped me more than they
will ever know.
My family, for being supportive and enabling me to pursue new
challenges, and encouraging me always to follow the goals that I set-out
for myself.
iii
CONTENTS
Abstract i
Acknowledgements ii
Contents iii
List of Tables v
List of Figures vii
Chapter I Introduction 1
1.1 Problem of Choice 3
1.2 Decision Making 4
2. Neuroscience 11
3. Methodology 13
3.1 References from Executive Functions 13
3.2 Decision-making – Models & Movement 14
3.3 ERPs from EEGs 15
4. Contribution 18
5. Chapter Outline 19
Chapter II Experiment 1 – Emotional Influence 20
1. Introduction 21
2. Method 25
3. Results 29
4. Discussion 38
5. Conclusion 48
Chapter III Experiment 2 – Feedback Influence 49
1. Introduction 50
2. Method 53
3. Results 57
4. Discussion 64
iv
Chapter IV Experiment 3 – Information Load 68
1. Introduction 69
2. Method 72
3. Results 76
4. Discussion 84
5. Conclusion 86
Chapter V Experiment 4 – Stroop Advice 87
1. Introduction 88
2. Method 93
3. Results 97
4. Discussion 121
5. Conclusion 129
Chapter VI Experiment 5 – Advice Clarity 130
1. Introduction 131
2. Method 135
3. Results 139
4. Discussion 162
5. Conclusion 168
Chapter VII General Discussion 169
1. Summary of Results 171
2.1 Emotion 173
2.2 Information 174
3. Methodology 176
3.1 Visual Processing 177
3.2 Decision-making Stages 178
4. Conclusion 180
References 182
Appendices 209
A – Picture Rating Task 210
B – Attitude Scales 211
C – Task Experience 215
v
LIST OF TABLES
Chapter II
Table 1. Decision Paradigm 27
Chapter III
Table 1. Decision Paradigm 55
Table 2. Mean (SD) response times for each feedback group in all three consequence conditions
58
Table 3. Median scale ratings across all three feedback groups 58 Table 4. Mean (SD) response times for each consequence
condition in all three feedback groups
60
Chapter IV Table 1. Decision Paradigm 74
Table 2. Mean (SD) response times with significant differences between three blocks of the decision task, for all consequence scenarios in each confidence group
76
Table 3. Mean (SD) response times for each feedback group in all consequence conditions, during each of the three blocks
78
Table 4. Mean (SD) response times for each feedback group in all three consequence conditions
79
Table 5. Median scale ratings across all three feedback groups 80 Table 6. Mean (SD) response times for each consequence
condition in all three feedback groups
81
Chapter V Table 1. Decision Paradigm 95
Table 2. Mean activity recorded for perception components with significant differences between consequence conditions
99
Table 3. Mean activity recorded for advice-perception
components with significant differences between consequence conditions, for all three advice conditions
103
Table 4. Mean activity recorded for advice-perception components with significant differences between advice conditions, for both consequence scenarios
105
Table 5. Mean activity recorded for movement components with significant differences between consequence conditions, for all advice conditions
111
vi
significant differences between advice conditions, for both consequence scenarios
Table 7. Mean (SD) response times for each advice condition for both consequence levels
118
Chapter VI Table 1. Decision Paradigm 137
Table 2. Mean activity recorded for scenario-perception components with significant differences between consequence conditions
141
Table 3. Mean activity recorded of advice-perception
components with significant differences between consequence conditions, for all types of advice
144
Table 4. Mean activity recorded for movement components with significant differences between consequence conditions, for all types of advice
151
Table 5. Mean activity recorded for movement components with significant differences between advice conditions, for both consequence scenario conditions
154
Table 6. Mean (SD) response times for each advice condition for both consequence levels
vii
LIST OF FIGURES
Chapter I
Figure 1. 3-Stage Decision Making Model 5
Figure 2. EEG Waves and ERP Averages 15
Chapter II
Figure 1. Perception Components 31
Figure 2. Movement Components 34
Figure 3. Interaction graph 37
Chapter III
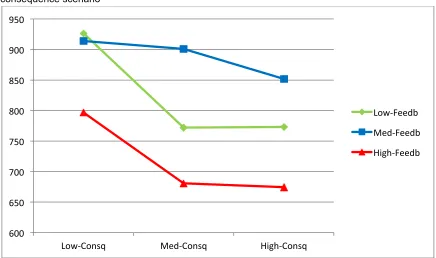
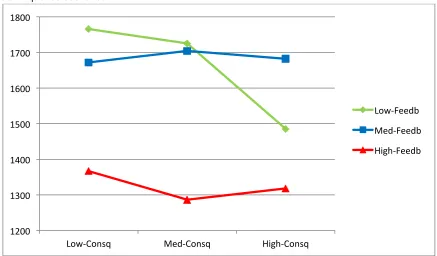
Figure 1. Mean response times for the three separate feedback groups in each individual consequence scenario
60
Chapter IV
Figure 1. Mean response times for the three separate confidence groups in each individual consequence scenarios
81
Chapter V
Figure 1. Scenario Consequence Components 101
Figure 2.1 Difference between the advice conditions for the advice-perception components when presented in the low-consequence scenarios
108
Figure 2.2 Difference between the advice conditions for the advice-perception components when presented in the high-consequence scenarios
109
Figure 3.1 Difference between the advice conditions for the movement components when presented in the low-consequence scenarios
113
Figure 3.2 Difference between the advice conditions for the movement components when presented in the high-consequence scenarios
114
Figure 4. Interaction graph for the mean activity recorded for the advice conditions in both consequence scenarios near the frontal lobe prior to making a choice (-340ms to -250ms)
115
Figure 5. Interaction graph for the mean activity recorded for the advice conditions in both consequence scenarios near the frontal lobe after making a choice (290ms to 350ms)
117
viii
consequence scenarios
Chapter VI
Figure 1. Scenario Consequence Components 142
Figure 2.1 Difference between the consequence scenario
conditions for the advice-perception components when presented with congruent advice
146
Figure 2.2 Difference between the consequence scenario
conditions for the advice-perception components when presented with incongruent advice
147
Figure 2.3 Difference between the consequence scenario
conditions for the advice-perception components when presented with unclear advice
148
Figure 3.1 Difference between the advice conditions for the movement components when presented in the low-consequence scenarios
156
Figure 3.2 Difference between the advice conditions for the movement components when presented in the high-consequence scenarios
157
Figure 4. Mean response times for the advice conditions in both consequence scenarios
Chapter I
2
From thinking about acting,
to doing so
One of the most-challenging characteristics of decision making in so-called critical incidents is that it often requires choosing between to equally unattractive options. This is done in environments of high ambiguity about the information available, while at the same time dealing with uncertain outcomes. Individuals in these settings are faced with high performance expectations, operational pressures, limited time available and mostly dealing with highly consequential situations, due to the high-risk nature of the problems. This translates to the potential for negative outcomes and a heightened emotional state. The main goal of this thesis is to identify – through the application of techniques and methodologies from the fields of social psychology and neuroscience – the individual cognitive processes during key stages of decision making, and how these are affected by factors relating to situational settings and information available.
3
While simple decision-making environments allow for clear constraints and the assignation of values for the available alternatives, more challenging ones demand high operational competency from individuals under extreme conditions. This translates into additional task pressures and factors influencing the whole decision-making process. Leading on from a naturalistic decision making (NDM)
perspective, the challenge here has focused on identifying key factors, which characterise unstructured problems, and incorporate those in basic decision-making tasks. The aim has been to develop experimental paradigms which mirror fundamental pressures of particular environments, in order to isolate individual decision-making processes, with a view to identifying the stages of evaluation, deliberation and implementation of choices.
Our focus here is on forced-choice environments, as encountered in situations of high risk and uncertainty. The prime challenge during critical incidents lies in the need to choose between two equally (un)attractive options, under conditions of high time pressure and significant risk. The goal is to combine neurocognitive,
behavioural and qualitative measures, to further identify the particular decision making processes that individuals engage in when solving tasks under those conditions. This insight will contribute to the fundamental understanding of the interplay between performance pressures and information, and how these affect individuals’ response.
1.1 Problem of Choice
4
Furthermore, these environments are often characterised by time constrains, and involve a high degree of risk and negative consequence as potential outcomes. These can include pilots in emergency situations, missile operators needing to reassess launch settings, or operators faced with an unexpected system shut-down. It is not only the sheer complexity of these environments, but the notion that individual steps are needed to gain clarity and an overview of the situation. It is these forced-choice decision-making environments that are of interest here, as the aim is to describe if, and how, individuals’ decision making is affected by these particular operational settings. The goal is to trace the neurocognitive processing during the decision-making process, with particular emphasis on the final commitment to a choice, which requires both deliberation (evaluation of alternatives) and implementation (commitment to a course of action).
1.2 Decision Making
Decision making has been defined as “the process commonly portrayed as occurring early in the ‘problem-solving process’ - the sensing, exploration, and
definition of problems or opportunities - as well as the generation, evaluation, and selection of solutions” (Huber & McDaniel, 1986; p.576). All of these dynamic and
interrelated processes have been observed and analysed from a number of research perspectives, and the challenge has focused on establishing a valid narrative, describing reasoning and behaviour applicable to each setting. Research has approached the task from two distinct starting points, with varying degrees of concordance (Kahnemann & Klein, 2009), but an understanding of both is key here, in order to advance the current proposals.
TDM
5
It is important to bear in mind that while the distinction of these three stages of decision making is to some extent arbitrary, it still provides a starting point for a more systematic examination of the individual component processes.
Figure 1. 3-Stage Decision Making Model (adapted from Fellows, 2004)
It is within this model that we consider the generation of possible options, the evaluation process applied to all of these available options, and the final commitment to one specific one.
Options
The generation and recognition of options has been investigated by a number of researchers (Baron, 1994; Russo & Schoemaker, 1990; Gigerenzer & Todd, 1999), but the effect of forced-choice environments has received little attention. These particular settings lack the options-generation component, but raise other questions about the lack of influence and effect the decision-maker has over the task or problem. These are environments of do-or-don’t moments, from the simple level of deciding whether or not to make a purchase, or the more high-risk levels in law-enforcement, deciding whether or not to shoot a suspect. These lack the option-generation stage, but still follow a similar dynamic on the most fundamental level. So it is worth looking at the subsequent stages, and see how these play out in forced-choice environments.
Evaluation
Evaluation has been examined principally from an economic framework, as the subjective utility an individual places on the particular courses of action (Keeney
OPTIONS
• Generate/identify possible choices.
EVALUATION
• Assign value to an alternative. • Based on context, experience and (internal or
external ) assessment.
CHOICE
6
& Raiffa, 1976; Glimcher & Rustichini, 2004) and from a reward perspective, seen as an intrinsic stimulus property (Baxter & Murray, 2002), fulfilling primary needs (Richardson & DeLong, 1991), as well as dependence needs (Breiter & Rosen, 1999), with some mixed results for studies using specific rewards (Knutson, Adams, Fong, & Hommer, 2001; Breiter, Aharon, Kahneman, Dale, & Shizgal, 2001; Pochon, Levy, Fossati, Lehericy, Poline, Pillon, Le Bihan, & Dubois, 2002).
In these environments, the focus is on uncertain problems, with no clear value stated for each of the (prescribed) options and with limited feedback. This makes it almost impossible for the individual to develop or learn a pattern of value, thus reinforcing the difficulty and complexity of the task. As a result of the characteristics of these environments, it is impossible to develop a meaningful assessment of the alternatives, or assign to them a neural currency (Montague & Berns, 2002). Decision makers have no information on which to generate value or judgement about individual alternatives, from which to develop a meaningful preference.
Further, research has shown that beliefs about outcomes are vital to the evaluation process, particularly when assessing the various attributes of choice alternatives (Shanteau, 1980), as well as during the active search for information relevant to the decisions (Böckenholt, Albert, Aschenbrenner, & Schmalhofer, 1991). Barlas (2003) proposed that the importance with which one perceives a decision is crucial, because such perceptions are instrumental in evaluating tradeoffs between conflicting attributes of choice. It is this added dimension which influences levels of cognitive processing invested in decision formulation. These environments include varying levels of outcome, which directly influence the evaluation process at different stages, providing another factor affecting the overall decision-making process.
Choice
7
individual’s previous evaluation of the decision context (Bush, Vogt, Holmes, Dale, Greve, Jenike, & Rosen, 2002; Gehring & Willoughby, 2002; Knutson, Fong, Bennett, Adams, & Hommer, 2003; O’Doherty, Critchley, Deichmann, & Dolan, 2003), while research into simple decision-making has recognized the frequent dissociation between hypothetical preferences and actual choices (Barlas, 2003). This idea describes the process of informing a choice based on available information, and assessing this choice against anticipated knowledge about the subsequent consequences.
The difficulty that arises here relates to the differentiation between choices, based on a value developed and assigned to the different options, as assessed during the evaluation stage. This process is significantly hindered when there is no prior knowledge or feedback to inform such a value assignment. It is within this limited decision environment that feelings and emotions have been brought back into the discourse.
Some researchers have explicitly identified affect as central in decision processes (Raghunathan & Pham, 1999) and have equated feelings to heuristics (Clore, 1992; Pham, 1998; Schwarz & Clore, 1988), insofar as recognising that they increase in value as a basis for information when decisions are bereft of other judgment processes (Clore, Schwarz, & Conway, 1994; Strack, 1992). The question that is raised here relates to the extent to which these factors influence decision making in these environments (Mosier & Fischer, 2009), and what is their interaction with other, more informative factors (Loewenstein & Lerner, 2003).
8
NDM
The reality of decisions in the real world is that they arise out of an interaction of environmental influences and influences related to the motivation and goals of the person. It is within this setting that decision-making has been recognised as a complex process, dependent on the unique characteristics of the operational setting and influenced by a number of internal as well as external factors (Klein, Orasanu, Calderwood, & Zsambok, 1993). The complexity of these processes holds the key to understanding how individuals operate in real-world environments. And in order to have a clear idea of what this entails, our focus here will be on some of the main factors and what have been termed wicked problems.
The concept of wicked problems was proposed in the context of social policy, where a lack of clear definition and competing agents add to the complexity of the task (Rittel & Webber, 1973). The main challenge remained the clear definition of the problem, seeing as most other stages to solving it depended on this premise. Further, the fact that no idealised system could be applied to these, made the basic application of models and heuristics impossible. Work in this area was advanced within the fields of design (Rittel, 1988; Stolterman, 2008), systems engineering (Sølvberg & Kung, 1993) and economics (Hogarth, 2001). On a more general level, defining characteristics of wicked problems have been identified as follows (Conklin, 2005):
1. The problem is not understood until after the formulation of a solution. 2. Wicked problems have no stopping rule.
3. Solutions to wicked problems are not right or wrong. 4. Every wicked problem is essentially novel and unique. 5. Every solution to a wicked problem is a 'one shot operation'. 6. Wicked problems have no given alternative solutions.
9
and identification of the outcome. It is the combination of the naturalistic setting and the formulation of these characteristics where the definition of problem-solving steps beyond traditional decision making theory, and requires the inclusion of a number of external factors, in order to be understood in terms of processes at play.
Individuals tasked with solving these problems often operate in dynamic and fast-paced environments, where the setting brings added stresses to already complex situations. Beyond simply defining these as stressing factors in the traditional sense (Janis & Mann, 1977; Ivanicevich & Matteson, 1980; Hogan & Hogan, 1982), the definition which best matches these type of problems defines stress in these environments as the “process by which certain environmental demands ... evoke an appraisal process in which perceived demand exceeds resources and results in undesirable physiological, psychological, behavioral and social outcomes” (Salas,
Driskell, & Hughes, 1996; p. 6).
They main stressors identified in these environments include the high risk of negative outcomes, changing conditions, time constrains, and uncertainty and ambiguity (Cannon-Bowers & Salas, 1998). Within these settings, individuals still need to gather, process, integrate and act on the data available, in order to inform their decisions. One of the key factors that describe these problems is the notion of uncertainty, which is a defining characteristic of human performance in NDM environments (Fiore, Rosen, & Salas, 2011). It builds on the fact that the available information does not provide sufficient details on which to construct expectations, as described in wicked problems, while the operational settings still require a commitment from the decision maker. This uncertainty is further amplified by these extraneous factors, surrounding performance pressure (Lerner & Tetlock, 1999), which add to the cognitive load of the task. Individuals operating in these environments are also extremely susceptible to anticipated regret (Zeelenberg, van Dijk, Manstead, & van der Pligt, 2000) and emotional affect (Loewenstein & Lerner, 2003).
10
(i.e. subjective expected utility theory, multiattribute theory, Bayesian inference). Despite the validity and application of these models in a number of fields, they fall short in being validated in these naturalistic environments (Collyer & Malecki, 1998). On the one hand, they require a relatively long time in order to identify problems and assess judgements necessary to develop solutions. On the other, the explicit judgements used in these models are artificial and fail to incorporate implicit and dynamic considerations. So it is precisely the variation in information, in terms of its contribution to the uncertainty of the situation and the ambiguity of the delivered insight, which forms a key part of the factors it adds to the decision-making environment.
11
2. Neuroscience
A number of sub-disciplines have emerged, each addressing the various influencing factors and taking stock of the varying results. The main approach here is to use a simplified model of decision making, taking into consideration the key factors identified within NDM environments, to identify cognitive processes on a fundamental level. Part of the challenge, as highlighted above, has been to identify the right models to describe decision making in particular environments. The aim here lies in looking at those models from a different perspective, as most of the current insight into decision making has largely been based on qualitative and observational research. The goal is to go further in our understanding, using the current advances in cognitive neuroscience, to develop a more fundamental model of the processes at play. Significant inroads have been made in terms of the emerging field of decision neuroscience (Shiv, Bechara, Levin, Alba, Bettman, Dube, Isen, Mellers, Smidts, Grant, & McGraw, 2005; Gold & Shadlen, 2007), and it is important to see how this has included ideas from social neuroscience and neuroeconomics.
Social Neuroscience & Neuroeconomics
12
psychology, identifying the fundamental substrates and correlates, using a multilevel analytical approach (Cacioppo & Berntson, 1992).
It is from within this framework that questions have been raised about the cognitive processes at play during decision-making problems. Significant advances have come from the field of neuroeconomics (McCabe, 2003), focused on applying brain-based methods and theories to account for economic decision-making (Loewenstein, Rick, & Cohen, 2008; Glimcher, Camerer, Fehr, & Poldrack, 2008). This has been in line with proposals from TDM, looking at decisions that require allocation of resources (e.g. time) or an assignment of value (e.g. neural value, preferential judgement).
13
3. Methodology
3.1 References from Executive Functions
In order to identify decisions on a neurological level, it is important to be aware of what processes one is observing. Being part of high-order processing, situations involving planning or decision-making, involving error correction or trouble-shooting, requiring responses to novel actions, requiring dangerous or difficult judgements, or requiring overcoming strong habitual response or resisting temptation, have all been recognised to involve executive functions (Norman & Shallice, 1986). These are identified as complex responses, by which individuals optimise their performance in situations that require the operation of a number of cognitive processes (Baddeley, 1996). This results in instructions about which regions of the brain to activate, generally coordinating their synchronised activity (Goldberg, 2001). So it is these functions that are of interest in decision-making processes, in terms of their interaction within the brain, focusing on their influence, as well as dictating effects on responses based on the available stimuli and related information.
3.2 Decision-making – Models & Movement
A number of models have been proposed based on neurological insight in relation to these executive functions, and it is worth considering these models and their development, onto which to incorporate factors more closely related to making research. Thus, despite the acknowledged complexity of decision-making, it is necessary to find a reference point from which to identify these processes and the accompanying brain activity. In this case, the best starting point involves considering movement as a choice, based on the idea of goal-driven action, as opposed to automatic movements and functions (Schneider & Shiffrin, 1977; Shiffrin & Schneider, 1977).
14
functionally been related to responses (i.e. ‘willed’ action) in conditions in which response was essentially arbitrary or drawn from a set of responses (Frith, Kriston, Liddle & Frackowiak, 1991; Jahanshahi & Frith, 1998). These sets of actions, within more complex environments, are carried out along sets of stored information (termed
schemas), which provide biasing mechanisms that activate or suppress particular actions or action routines according to current goals (Norman & Shallice, 1986). This model describes the activation of these schemas as the result of the balance between bottom-up processes (e.g. environmental cues, habit) and top-down processes (e.g. task demands, consequential planning). The revised SAS is more complex, taking into consideration three separate stages: specifying a new schema, implementing it, and monitoring the results (Shallice & Brugress, 1996).
Aimed at describing the overall control of cognition, the integrative model
of voluntary choice again places a strong emphasis on the prefrontal cortex (Miller & Cohen, 2001). In this model, the brain region provides biasing signals, enabling novel and non-automatic mapping between sensory inputs (environmental information), internal states (emotional affect), and response outputs (choice). Within this model, research has also highlighted that the prefrontal cortex responds primarily to the rules of the task, rather than the specific stimulus (Asaad, Rainer, & Miller, 1998, 2000); fulfilling the role of goals and plan processing, rather than basic input and information processing.
15
3.3 ERPs from EEGs
To gain a valid insight into these processes, it is important to maintain a good time resolution, as the focus is on the effect of high-pressure and uncertain environments have on decision making, as a combination of the factors identified from within NDM. Experimentally, the emphasis is on the particular time-intervals where these changes are present in individuals’ responses to these fast-paced situations, and how they are further reflected when referenced against behavioural measures. For this purpose, the best approach for this involved taking electroencephalographic recordings, with the view on identifying key evoked-response potentials.
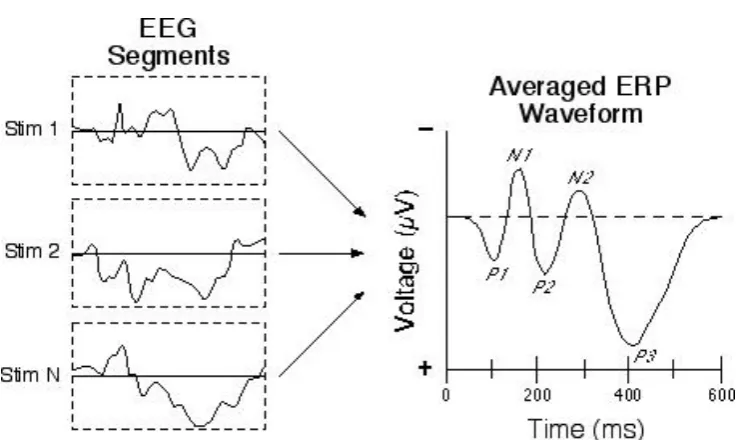
[image:24.595.135.504.508.728.2]Electroencephalographic (EEG) waveforms reflect neural activity from all parts of the brain, where some of this activity is related to specific tasks (e.g. visual perception, reading, movement), while most will be related to activity of other neurons, not directly engaged in the task (regarded as background-noise of electrical activity) (cf. Luck, 2005; cf. Handy, 2005). This noise can be accounted for through the repetition of the stimuli, in order to reduce the so-called signal-to-noise ratio. The resulting graphs describe the changes over time (x-axis, in milliseconds) for the electrode potential (y-axis, in microvolts).
16
Recordings provide an insight into brain processing, using EEG as a remote measurement of the electrical potential directly generated by neuronal activity, in the form of signals originating in the postsynaptic dendritic currents, rather than the axonal currents associated with the action potential (Nunez & Srinivasan, 2006). This allows one to study perceptual and cognitive processes, by averaging the electrical activity that is time-locked to particular stimulus categories. Designing a specific decision-making paradigm enables one to observe and quantify complex cognitive processing through a continuous measure (Luck, Woodman, & Vogel, 2000), based on event-related potentials (ERPs), used to describe activity relating to individual stimuli, where these stimuli have been paired with proposed decision-making stages.
ERPs are changes in electrical activity, which can be recorded noninvasively from the surface of the scalp and reflect summated postsynaptic potentials from large sets of synchronously-firing neurons (Allison, Woods, & McCarthy, 1986; Fabiani, Gratton, & Coles, 2000). The identified ERPs are important to the study of psychological processes, based on the association of individual components with distinct information-processing operations, time locked to sensory, motor, or cognitive events (Gehring, Gratton, Coles, & Donchin, 1992). In these cases, component amplitude is thought to reflect the extent to which the associated psychological operation has been engaged with, and latency of the component’s peak is thought to reflect the point in time by which the operation has been completed (Ito, Willadsen-Jensen, & Correll, 2007).
17
neuroanatomical location of the source of activity, based on 3-dimensional source modelling.
Seeing as the emphasis is on identifying decision-specific ERPs, in line with the recognised decision-making stages, the reference was taken from movement-specific components. Recordings in these instances focused on the
Bereitschaftspotential (readiness potential), identified as activity prior to a movement (Shibasaki & Kato, 1975; Boschert, Hink, & Deecke, 1983). These potentials have been shown to appear as negative shifts prior to the movement over the primary sensorimotor areas (Kornhuber & Deecke, 1965; Deecke, Scheid, & Kornhuber, 1969; Kristeva, Keller, Deecke, & Kornhuber, 1979). Considering the fast response times for some of the conditions, the emphasis has also been on the negative slope (NS’), observed as the steepest part of the negative shift prior to the onset of muscular contraction (Shibasaki, Barrett, Halliday, & Halliday, 1980).
The overall idea is to simplify the decision-making implementation, relying on choices as voluntary movement, accounting for any variations in terms of oral or written commitment to an alternative. Further, the focus in this situation is not on the specificity of a choice, but on the making of a decision (deliberation) and the final commitment to it (implementation). This framework allows capturing any changes in terms of urges to move, as observed for participants who may not be fully committed to act and may still be able to suppress the action, as part of a late-checking mechanism (Brass & Haggard, 2007). Similarly, the translation of mental decisions into motor-responses allows for experimental confirmation based on lateralisation of readiness potentials (Haggard & Eimer, 1999), as well as activity linked to planning, preparation and movement (Passingham, 1996; Ball, Schreiber, Feige, Wagner, Lϋcking & Kristeva-Feige, 1999).
18
psychological and behavioural process (Harmon-Jones & Beer, 2009). Furthermore, whereas traditional research on social cognition and motivation has had to infer the activity of underlying cognitive mechanisms only by the proxy of behavioural expressions (e.g., on reaction-time tasks), ERPs and other neuroimaging methods allow researchers direct access to the cognitive machinery that drives social behaviour, thereby providing a powerful tool for testing theories of social cognitive and motivational processes (Bartholow & Amodio, 2009). These ideas expand on early suggestions that we should try and bring real-world problems to an experimental setting to assess their cognitive make-up, in an attempt to improve our understanding of cognition in the wild (Hutchins, 1995). While this particular paradigm does not claim to provide an exhaustive description of real-world decision making, it will further contribute to the emerging models of cognitive architectures (Taatgen & Anderson, 2009), aimed at providing predictive descriptions and overall identification of individual processes and their relationship in particular tasks.
4. Contribution
The main goal is to further contribute to the current understanding of decision-making processes in forced-choice environments. This contribution is based on recent developments in the field of cognitive neuroscience, adding insight through the use of EEG measures, as a way of isolating key factors relating to information processing, deliberation and implementation of decisions. We will look at if, and how, behavioural responses and cognitive measures interact when making decision, in environments characterised by ambiguous information and high-risk conditions, as prescribed by the operational limitations.
19
5. Chapter Outline
The rest of the PhD dissertation is structured around the five different experiments carried out. Each experiment is described in an individual chapter (Chap. II – VI), focusing on a specific introduction, and information on methodology and results. These are then discussed in detail for the particular experiment. Finally, all of these results are discussed in the last chapter (Chapter VII), in order to draw final conclusions from the findings, before moving on to the overall research contributions and implications for the proposed hypotheses.
Chapter II
Experiment 1: lack of information, on which to base deliberation and decision; only emotional-consequences available to base references on.
Chapter III
Experiment 2: addressing questions raised in Experiment 1, to see if higher cognitive loading (merging) influences the behavioural response.
Chapter IV
Experiment 3: addressing questions raised in Experiment 1, to see if confidence manipulation (mood setting) influences the behavioural response.
Chapter V
Experiment 4: information provided, to inform the deliberation and decision; based on advice manipulations in relation to the Reverse Stroop Effect.
Chapter VI
Experiment 5: information provided, to inform the deliberation and decision; based on advice manipulations of unclear information.
Chapter VII
Chapter II
Emotional Influence
21
1. INTRODUCTION
This study examined individuals’ decision-making processes in an experimental environment characterised by an absence of information, time pressure and risk. Not uncommonly, decision makers have to make rapid decisions where aversive outcomes are inevitable but task specification is ambiguous and more information (ideally) would be forthcoming but ultimately is not available. For example, ‘Do I, or do I not, deploy paramedics to injured victim X in terrorist scenario? If I do deploy and there is another device I could be risking further loss of life. If I do not, I run the risk of losing the currently injured victim’. Alison, Humann, and van Den Heuvel (2011) have described these high risk binary choice decisions as ‘damned if I do or don’t decisions’ and argued that they are especially difficult because both options look aversive and there is no capacity for further useful information upon which to develop a sufficiently clear situational model that would help lead to a more informed decision. As such, no matter which decision is taken, it could lead to a bad outcome.
22
and verbal feedback from participants after the task that the following distinct phases will emerge: evaluation (of task), deliberation (of options) and implementation (of action). We argue that distinct phases will emerge and that although deliberation is redundant (i.e. it does not help solve the task) individuals will still consider options and seek to ‘solve’ the task. We argue that this will be especially pronounced in the high consequence conditions and that there will be greater urgency to implement action.
1.1 Phases of Decision Making
Decision making is defined as “the process commonly portrayed as occurring early in the ‘problem-solving process’ - the sensing, exploration, and definition of problems or opportunities - as well as the generation, evaluation, and selection of solutions” (Huber & McDaniel, 1986; p.576). However, there has been little effort to establish the cognitive activity associated with these proposed shifts from evaluation - deliberation - implementation (Gollwitzer, Heckhausen, & Steller, 1990) or options, evaluation, and choice (Herrnstein & Prelec, 1991; Baron, 1994; Lipshitz, Klein, Orasanu, & Salas, 2001).
Some researchers have explicitly identified affect as central in decision processes (Raghunathan & Pham, 1999) and have equated feelings to heuristics (Clore, 1992; Pham, 1998; Schwarz & Clore, 1988), insofar as recognising that they increase in value as a basis for information when decisions are bereft of other judgment processes (Clore, Schwarz, & Conway, 1994; Strack, 1992).
1.2 Cognitive Processes
23
potentials in the supplementary motor area (Kornhuber & Deecke, 1965; Shibasaki, Barrett, Halliday, & Halliday, 1980; Kawashima et al., 1995) and early activity, known as the Bereitschaftspotential (Shibasaki & Kato, 1975; Boschert, Hink, & Deecke, 1983). Both of these were regarded as indicators of decision deliberation and, ultimately, commission to a choice, as fundamental reflections of movement-commission. The emphasis was on changes in source activation, analysing the phases of voluntary preparation and execution.
Research has repeatedly shown that large, positive slow-waves of event-related potentials (ERP) reflect the allocation of more attentional resources in cases of motivational significant stimuli (Hamm, Schupp, & Weike, 2003). Further, results have consistently described these affective evaluations as routine processes involved in virtually all processes of perceptions (Cacioppo, Gardner, & Bernston, 1999). The basic premise here followed on from the notion that emotional tasks result in prolonged periods and elevated intervals of brain activity, as more cognitive resources are necessary to assess situations.
This is linked to the idea that emotional experience is a by-product of neural computations associated with processing of value-laden stimuli (LeDoux, 1996). Thus, extensive visual cortex activity has been recorded when participants view emotional pictures (Bradley et al., 2003). Further, the anterior cingulate cortex plays a role in representing subjective emotional responses, which has also been found to be consistent with a suggested role for associated medial prefrontal structures in representing states of mind (Lane, Fink, Chau, & Dolan, 1997). The expectation thus follows on from the idea that emotional-laden information will result in increased cognitive activity at a visual as well as an affective processing level.
1.3 Objectives and Hypotheses
24
choices and whether they engaged in (redundant) deliberative processing before implementing their decisions. The following objectives were also considered:
> To identify the neural processes involved at each stage of decision-making (evaluation, deliberation, pre-implementation, and implementation).
> Emotional stimuli that suggest more significant and consequential outcomes will result in increased and prolonged amplitudes at the stages of deliberation, preparation (frontal lobe and cingulate cortex) and implementation (parietal lobe).
> In the overt absence of any information on which to deliberate individuals will show neural signs associated with deliberation (which from a purely rational perspective is redundant).
25
2. METHOD
2.1 Participants
Fourteen individuals (9 females, 5 males) participated in the study. They ranged in ages from 21 to 34 years, with a mean age of 27 years. Participants were drawn from a sample of psychology students, all without any disclosed health issues, and were all right-handed.
2.2 Procedure
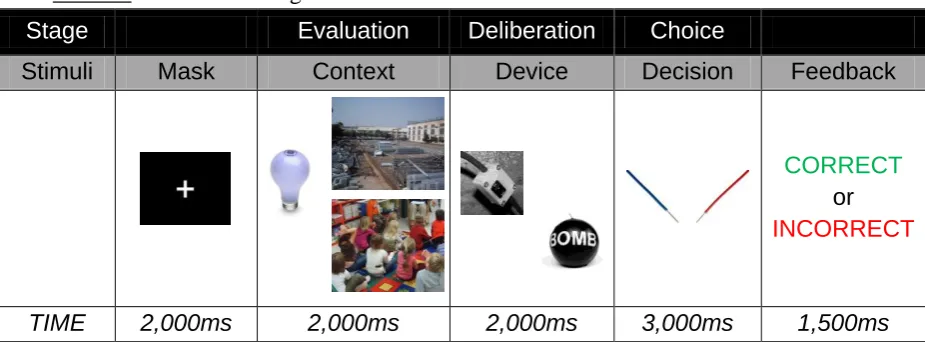
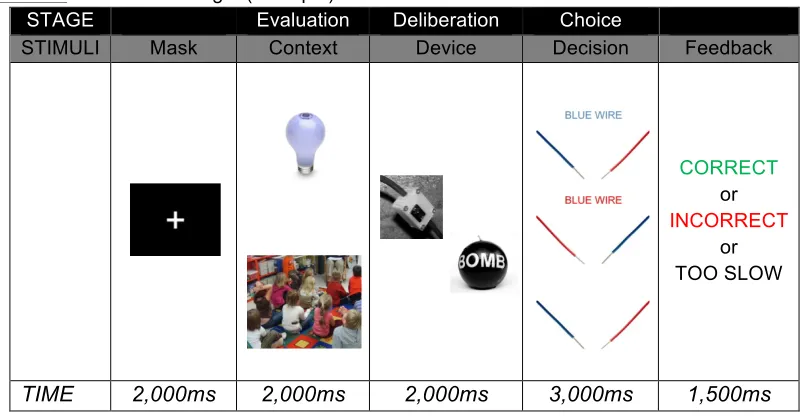
Participants were presented with task-related information on a computer screen, and they used a mouse placed below their right hand to give their responses. The experiment consisted of a series of decision situations, at the end of which individuals were asked to make a choice between two random alternatives under time pressure. The task consisted of a ‘bomb scenario’, where participants were asked to imagine themselves operating in the various scenarios and where the objective was to ‘cut’ the correct of two wires to disarm a bomb. Following this, they faced a decision stage and had to choose between two alternatives, in the form of two different-coloured wires (see Table 1) (failing to do so, automatically led to ‘detonation’). The basic premise of the decision problem focused on a binary negative outcome paradigm, where participants had to choose between two arbitrary alternatives, not knowing which would be the correct wire - reinforced through time constrains and performance pressures - and where a ‘wrong’ decision lead to a negative outcome.
First, they were presented with a context-setting scenario involving either:
(i) a light-bulb, which they had to switch off by picking a wire (low consequence condition),
26
(iii) children on a playground, in which the wires were used to disarm a bomb (high consequence condition).
In summary then, the stimulus indicated one of three conditions: 1) low consequence, 2) medium consequence, and 3) high consequence. This was followed by an image of a light switch (low consequence condition) or explosive device (medium- and high-consequence conditions), to reinforce the situational context. Finally participants were prompted to choose between a red or blue wire ‘connected’ to the particular device. Failure to make a decision or a wrong one, led to detonation of the device. Following each choice, they received feedback in the form of a “CORRECT” or “INCORRECT” on-screen message.
The instructions, prior and during the experiment, all emphasised the need to take quick and decisive action. Participants were told that they would be assessed on their accuracy as well as their speed, forming part of an overall learning task. What participants did not know, was that the order and number of correct or incorrect decisions was set prior to the experiment, and they had no influence on the decision task. This was done in order to maintain a uniform pattern across participants. A total of 180 stimuli series were presented in two blocks, with a 5 minutes break between them. Each block also contained 3 interludes, where participants were presented with a progress report about their performance so far. All of these reports contained the same information about mistakes made so far, stating that they had been performing “below average” and reinforcing the need for them to take decisive and quick action, as well as the need to improve their performance and accuracy.
27
brief open-ended questionnaire about their performance, their individual strategy and their focus during the task, and three different scales after the rating task. These included Barratt’s Impulsivity scale (Patton, Stanford, & Barratt, 1995), the Regulatory Mode Concerns (Assessment-Locomotion) scale (Higgins, Kruglanski, & Pierro, 2003), and the Need for Closure scale (Kruglanski & Webster, 1996) (see
[image:36.595.87.550.270.441.2]Appendix B). Finally, they were debriefed about the research and the pre-determined task conditions. The whole experimental procedure took a maximum of 1 hour and 30 minutes for each participant.
Table 1. Decision Paradigm
Stage Evaluation Deliberation Choice
Stimuli Mask Context Device Decision Feedback
CORRECT
or
INCORRECT
TIME 2,000ms 2,000ms 2,000ms 3,000ms 1,500ms
2.3 Recordings
28
2.4 Data Analysis
Averaged EEG epochs were segmented after band pass filtering and analyzed using the Brain Electrical Source Analysis (BESA) program (MEGIS Software, Munich – Germany). Trials containing ECG artefacts or large EOG variations (> 75 mV) were discarded from further analysis. For the vision-related measures, 2,269 averaged EEG epochs were segmented to a length of 1,100 ms (100 ms pre- to 1, 000 ms post-stimulus). For the movement-related measures, 2,264 averaged EEG epochs were segmented to a length of 2,000 ms (1,500 ms pre- to 500 ms post-stimulus). A source model of the EEG potentials was constructed from the grand average data (N = 14) for each of the measures. The data were transformed into the Talairach coordinate system, and the locations of the EEG sources were evaluated for each individual source dipole (Talairach Client v2.4.2, Research Imaging Centre, UTHSCSA - USA).
2.5 Statistical Analysis
29
3. RESULTS
Results will detail the two parts of the experiment. First, the focus will be on the perception components within the EEG recordings, describing the differences in amplitudes for each of the source dipoles directly following the presentation of the scenario context stimuli. Secondly, the focus will be on the movement component of the EEG recordings, describing the differences in amplitudes for each of the source dipoles prior to the commission to a particular choice. Data for the response times were also considered at this stage, to gain a fuller picture of the relationship between cognitive and behavioural processes. For both of these recordings, the data will be compared based on the three scenario conditions, looking for significant differences in the source waveforms.
3.1 Perception-related components
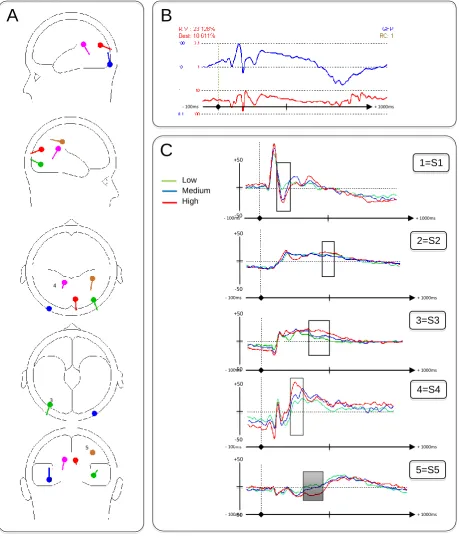
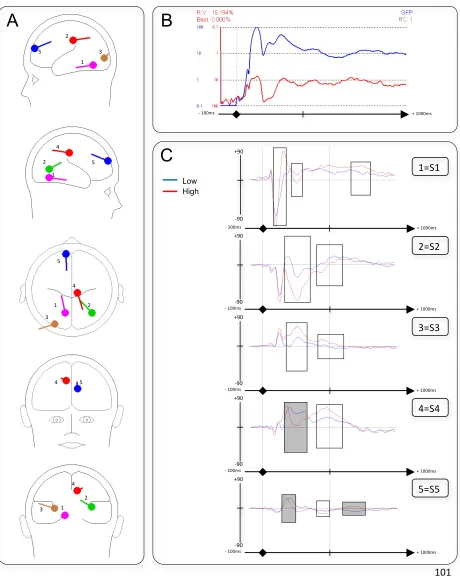
Five regional source dipoles were fitted to describe the 3-dimensional source currents contributing to the data (see A, in Figure 1). Three sources were located in the occipital lobe. The central source (S1, Talairach coordinates in mm [8, -82, 19], Brodmann area 18), peaked at 170 ms. Two secondary sources, occupying lateral locations, (S2L [-41, -99, -23] and S3R [42, -81, -12]) peaked at 184 ms and 176 ms respectively. Two other sources were located in the parietal lobe. One source was located contralateral to the movement hand (S4 [-13, -46, 24], peak 258 ms), while the other source was located ipsilateral to the hand (S5 [39, -40, 39], peak 550 ms). The grand-average model was tested for all conditions, and the residual variances were similar in all conditions (all 23%, low-consequence 18%, medium-consequence 11%, high-consequence 17%) (see B, in Figure 1).
To evaluate the differences between the three scenario conditions, individual source waveforms for each were obtained using the grand-average model. The average source waveforms with time intervals showing statistically significant deviation (p < 0.05) between the different conditions are show in Figure 1.
30
26) = 6.6, p = .005), with post-hoc tests showing that high-consequence scenarios (M
= -8.38, SD = 45.52) resulted in a larger decrease in amplitude than low-consequential ones (M = 12.41, SD = 25.23), F (1, 13) = 9.5, p = .009. Similar significant differences were observed at both lateral source dipoles (S2 & S3) located in the occipital lobe, when looking at later time intervals. In this case, amplitudes for the contralateral source dipole (S2) showed a significant difference (400 ms to 500 ms), F (2, 26) = 17.4, p = .000, with post-hoc tests showing that high-consequence scenarios (M = 26.94, SD = 11.82) resulted in a slower decrease in amplitude than did low-consequence ones (M = 19.52, SD = 10.17), F (1, 13) = 20.8, p = .001). Similarly, amplitudes for the ipsilateral source dipole (S3) showed a significant difference (300ms to 500ms), F (2, 26) = 22.9, p = .000), with post-hoc tests showing that high-consequence scenarios (M = 30.74, SD = 19.81) resulted in a slower decrease in amplitude that did low-consequence ones (M = 9.72, SD = 15.88),
F (1, 13) = 30, p = .000.
31
Figure 1. Perception Components
(A) Localisation of source dipoles shown schematically in the transparent glass brain. Short lines in each source indicate the orientation of the primary component of the respective regional source. Source labels: 1 = S1 Occipital Lobe; 2 = S2 Occipital Lobe; 3 = S3 Occipital Lobe; 4 = S4 Parietal Lobe; 5 = S5 Parietal Lobe. (B) Global field power (blue scale) and residual variance (red scale). (C) Source waveforms of source dipoles derived from the grand average data. Averages for each scenario condition overlaid (low-consequence = green; medium-consequence = blue; high-consequence = red). Empty rectangles indicate statistically significant (p < .05) increase for source amplitudes in more consequential scenario conditions, while filled rectangles indicate statistically significant (p < .05) decrease for source amplitudes in more consequential ones. Numbers of source waveforms correspond to (A).
A
B
C
Low Medium High
- 100ms + 1000ms
+50
-50
- 100ms + 1000ms
+50
-50
- 100ms + 1000ms
+50
-50
- 100ms + 1000ms
+50
-50
4
3
5
2
- 100ms + 1000ms
1=S1
2=S2
- 100ms + 1000ms
+50
-50
3=S3
4=S4
32
3.2 Decision Components
3.2.1 Movement-related components
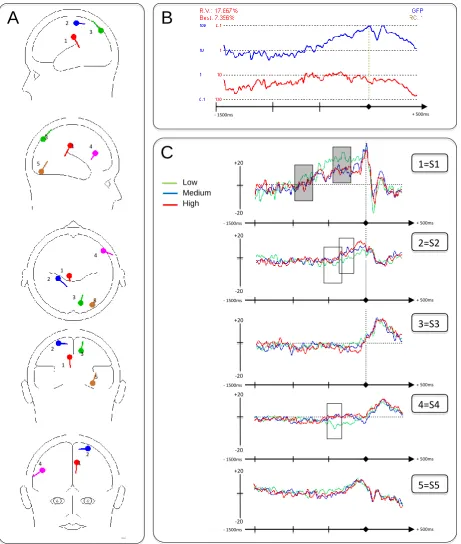
For the analysis five regional source dipoles were fitted to describe the 3-dimensional source currents contributing to the data (see A, in Figure 2). One source was located in the cingulate cortex (S1 [-8, -25, 37]), peaking at -313 ms before the decision was. Two other sources were located in the parietal lobe. One source was located contralateral to the movement hand (S2 [-28, -34, 64], peak -65 ms), while the other source was located ipsilateral to the movement (S3 [13, -84, 42], peak 156 ms). Two more ipsilateral sources were identified, one located in the frontal lobe (S4 [55, 29, 27], peak 225 ms), and a last one located in the ventral posterior lobe (S5 [34, -82, -23], peak 102 ms). Again, the grand average model was tested for all conditions, and the residual variances were similar in all conditions (all 18%, no-emotion 25%, low-no-emotion 25%, high-no-emotion 21%) (see B, in Figure 2).
To evaluate the differences between the three scenario conditions, individual source waveforms for each were obtained using the grand average model. The average source waveforms with time intervals showing statistically significant deviation (p < 0.05) between the different conditions are show in Figure 2. Analysis of the selected Bereitschaftspotential parameters was performed, using a three-way ANOVA for repeated measures. The focus was on particular time intervals, prior to the participants’ voluntary movements, identifying their commitment to a particular choice through movement-related potentials (see C, in Figure 2).
33
low-consequence scenarios (M = 34.05, SD = 33.43) resulted in larger increase in amplitudes than did high- (M = 17.71, SD = 25.86), F (1, 13) = 7.8, p = .015, or medium-consequence ones (M = 14.85, SD = 32.46), F (1, 13) = 5.6, p = .035.
For the source in the contralateral parietal lobe (S2), we selected two overlapping time intervals, to analyse the differences between conditions. An early interval (-450 ms to -200 ms) showed a significant difference between the source amplitudes, F (2, 26) = 9.5, p = .001, with post-hoc tests showing that the high- (M = 8.9, SD = 14.07), F (1, 13) = 11.1, p = .005, and medium-consequence ones (M = 10.63, SD = 14.11), F (1, 13) = 12.3, p = .004, resulted in larger increase in amplitudes than did the low-consequence ones (M = -2.17, SD = 12.18). A later interval (-350 ms to -100 ms) also showed a significant difference between the source amplitudes, F (2, 26) = 6.9, p = .004, with post-hoc tests showing that the high- (M = 12.4, SD = 16.54), F (1, 13) = 8.5, p = .012, and medium-consequence ones (M = 12.67, SD = 16.61), F (1, 13) = 10.2, p = .007, resulted in larger increase in amplitudes than did the low-consequence ones (M = 0.97, SD = 11.3). On the other hand, analysis for the source in the ipsilateral parietal lobe (S3) at the time interval (-220ms to -120) around the pre-movement peak amplitude at -170 ms, showed that there was no significant difference between the three scenario conditions in this particular location.
When looking at the source located in the frontal lobe (S4), we again identified two separate time intervals. An early interval (-450 ms to -350 ms) showed a significant difference between the source amplitudes, F (2, 26) = 4.5, p = .02, with post-hoc tests showing that the high-consequence scenarios (M = 7.01, SD = 8.31) resulted in larger increase in amplitudes than the non-emotional ones (M = -6.5, SD
34
Figure 2. Movement Components
(A) Localisation of source dipoles shown schematically in the transparent glass brain. Short lines in each source indicate the orientation of the primary component of the respective regional source. Source labels: 1 = S1 Cingulate Cortex; 2 = S2 Parietal Lobe; 3 = S3 Parietal Lobe; 4 = S4 Frontal Lobe; 5 = S5 Posterior Lobe. (B) Global field power (blue scale) and residual variance (red scale). (C) Source waveforms of source dipoles derived from the grand average data. Averages for each scenario conditions overlaid (low-consequence= green; medium-consequence = blue; high-medium-consequence = red). Empty rectangles indicate statistically significant (p < .05) increase for source amplitudes in more consequential scenario conditions, while filled rectangles indicate statistically significant (p < .05) decrease for source amplitudes in more consequential ones. Numbers of source waveforms correspond to (A).
A
B
- 1500ms + 500ms
C
Low Medium High 2=S2 1=S1 3=S3 4=S4 5=S5 4 1 1 2 2 34 4 5 5 4 4 3
3 1 1 5 5 3 3 1 1 2 2 2 2 1 1 4 4 2 3 3 4 2 1 2 3 1 2 5 1 2
- 1500ms + 500ms
+20
-20
- 1500ms + 500ms
+20
-20
- 1500ms + 500ms
+20
-20
- 1500ms + 500ms
+20
-20
+20
-20
35
3.2.2 Reaction Times
When analysing the recorded reaction times, the scenario conditions were associated with statistically significant differences (F (2, 26) = 5, p = .015), with times for high-consequence scenarios (M = 804.48, SD = 201.16) being significantly slower than those recorded for medium- (M = 876.73, SD = 186.49), F (1, 13) = 12,
p = .004, r = 0.69, and low-consequence ones (M = 904.99, SD = 202.97), F (1, 13) = 7.1, p = .019, r = 0.59. Results showed an overall tendency, where the more consequential a presented scenario was, the faster individuals made a decision about their choice of wire to cut. The results for the differences in reaction times were overlaid with the significant differences in amplitudes observed for two of the movement-related sources (see Figure 3). The time differences were of less than 100 ms, with deviations of around 200 ms, which pointed to a very narrow margin of difference between the reaction times for all three conditions.
When looking at the movement-component located in the parietal lobe (S2), the graph showed an inverse trend for the waveform amplitudes in comparison to the reaction times (see A, in Figure 3). While individuals recorded faster times as the consequentiality of the scenarios increased, the recorded activity showed a significant increase in amplitudes for both consequence scenarios, in both selected time intervals.
On the other hand, when looking at the movement-component located in the cingulate cortex (S1), the graph showed a similar trend for the waveform amplitudes when compared to the reaction times (see B, in Figure 3). As individuals recorded faster times with the increase of consequentiality in the scenarios, the recorded activity showed a significant decrease in amplitudes for both scenarios, again in both selected time intervals.
36
in both the early time intervals. The late interval did not show a significant difference between the conditions.
3.3 Ratings
Further, to look at the relationship between the different scenario conditions and the various measures taken, correlations were carried out based on the individuals’ picture ratings. Ratings were significantly different across all participants, for both the measure of how emotional they perceived the scenario to be (F (2, 26) = 74.6, p = .000), as well as how affected they would have felt if they made a wrong decision (F (2, 26) = 110.7, p = .000). For the emotionality ratings, results showed that, overall, the images were classed into the specific scenarios as predicted. Also, in terms of the affect ratings, the results revealed that the high-consequence scenarios were given a significantly higher emotionality rating (M = 6.39, SD = 1.12) than the medium- (M = 2.83, SD = 0.69) and low-consequential ones (M = 2.02, SD = 0.99), F (1, 13) = 444.5, p = .000). It should be noted, that although the analysis pointed to a significant difference between the medium- and low-consequential scenarios, both mean scores were very similar, with an overlapping standard deviation.
3.4 Attitude Scales
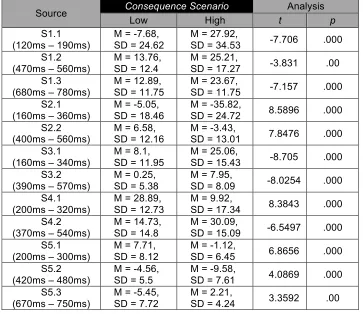
37 source locations, for each of the three scenario conditions. (A) Trends for S2, located in the parietal lobe, for the early (red line) and late (green line) time intervals. (B) Trends for S1, located in the cingulate cortex, for the early (red line) and late (green line) time intervals. (C) Trends for S4, located in the frontal lobe, for the early (red line) and late (green line) time intervals. The scale for the response times (in ms) was given on the left y-axis, while the scale for both waveform amplitudes sources (in µV) was given on the right y-axis.
> Reaction Times > S2.1 (-450 to -200)
> S2.2 (-350 to -100)
> S1.1 (-850 to -750)
> S1.2 (-350 to -250)
> S4.1 (-450 to -350)
> S4.2 (-300 to -150)*
[image:46.842.65.742.160.550.2]38
4. DISCUSSION
Based on a simplified forced-choice decision-making paradigm it was possible to identify differences in cognitive processing based on consequential variations, following on from propositions based on the decision-making phases. Further, results showed that individuals’ responses, when lacking any meaningful information, were affected significantly by the operational environment they were faced with, resulting in redundant deliberation and decision delay.
The analysis showed that the recorded amplitude waveforms at the decision stage of the experiment pointed to a difference in activity between the scenario conditions, proposing cognitive activity relating to deliberation and implementation processes. For the purpose of the discussion, first we focus on the basic visual and cognitive processing at the initial stage where individuals received contextual information about their operational environment. The second part then describes the basic decision-making phases proposed in the 3-stage model, retracing differences in cognitive and behavioural activity and finally, we discuss the extent to which it was possible to link the EEG results with our behavioural measure (reaction time).
4.1 Perception-related components
39
In relation to this, it is important to highlight that the images used for the more consequential scenarios were characterised by more complex visual information. This would be a clear explanation for the stronger activation in those conditions, seeing as no base-line activation was recorded for all three scenario conditions without the contextual information. This did not affect the overall validity of the design, but adds a caveat to any conclusions drawn solely from perception-related components at this stage of the decision-making paradigm.
4.2 Movement-related components & response times
The recordings for the second part of the experiment were aimed at identifying individual decision-related components, as well as the variations in brain activity for each of the scenario conditions, following on from the proposed 3-stage model. The individual’s decision was identified with regards to their choice of a wire. Since the focus was on the making of a decision, not which wire, these recordings provided a base-line from which to assess any variations in cognitive as well as behavioural activity.
Implementation Delay