Does G-quadruplex DNA have a
functional role in regulation of the
transcriptome?
Thesis submitted in accordance with the requirements of
the University of Liverpool for the degree of Doctor in
Philosophy by Paul David Myers
Acknowledgements
I would like to thank:
My UK supervisor Professor John Quinn for his initial encouragement and continued support, tolerance, laughter and understanding in matters of science and otherwise, without this I would not have a thesis to submit.
Quinn Lab members Dr. Kate Haddley, Dr. Abigail Savage, Miss Alix Warburton, Mrs Veridiana Pessoa, Dr Jill Bubb, Mr Maurizio Manca and Miss Olympia Gianfrancessco for creating a lively, fun, friendly and stimulating environment in which to work.
My NIH supervisor Dr David Levens for sharing insight and knowledge, challenging my abilities and developing me as a scientist.
Levens Lab members Fedour Kouzine, Suzanne Sanford, Eric Batchelor, Brian Fisher, Louisa Ho and Nie Z, for welcoming me into their lab. A special thanks to my friends; Weixin Zhou for sharing ice cream and bubble tea, Ashutosh Gupta for sharing fantastic food and conversation and Laura Baranello for sharing coffee, fun drinks and generally looking after me.
Nicola Sater and Otto for friendship advice and support during our morning walk in dogwood park.
My friend Kevin Garnet for coffee and conversation to keep my mind sharp.
An extra special thank you to my wife Elizabeth Myers for her belief, love, support and occasional harsh words of encouragement.
Abstract
All DNA transactions involving overtwisting or undertwisting of the double helix alter the topological state of DNA, yielding distortions known as DNA supercoiling or DNA torsional stress. Under conditions of negative supercoiling susceptible sequences within B-form DNA may be transformed to stable, non-B-DNA structures such as G-quadruplex. G-quadruplex DNA has the potential to create or destroy transcription factor binding sites or influence nucleosome positioning and so may contribute to gene regulation, making it an attractive therapeutic target. Although in
vitro and in silico studies support the notion that G-quadruplex is regulatory, a
compelling in vivo demonstration of G-quadruplex function is lacking.
Using computational and experimental approaches previously developed to identify DNA segments that actually adopt non-B DNA conformations in vivo, I have identified sequences with a high probability of secondary structure formation. Identified sequences are located in the promoters of three genes central to cancer biology where much of the work in G-Quadruplex has been focused. I have expanded this focus into the field of neuroscience by identifying a further three sequences in the promoters of genes implicated in a range of neurological disorders. Preliminary biochemical analysis of these regions assessed methylation status and transcription factor binding profiles corresponding to a dynamic model of G-quadruplex formation at the well characterised CT element in the c-MYC promoter. In order to provide definitive structure function analysis of G-quadruplex I designed a gene editing strategy to reengineer the well characterized CT element of c-MYC. The initial strategy used AAV- targeting vectors to introduce strategic mutations that destabilize G-quadruplex DNA conformations in the CT element of c-MYC in the HCT-116 cell line via homologous recombination. In parallel to these structure-destabilizing mutations, neutral base changes were targeted to the 5´-UTRs of the targeted alleles, distinguishing them from their respective unmodified homologous partners. qPCR and ChIP analysis of the relative expression and factor binding profiles of targeted and wild-type alleles will enable a definitive structure function analysis of basal or induced expression; determining whether these secondary structures have a functional role in regulating gene expression and the factors involved.
Contents
Acknowledgements & dedication ... 2
Abstract ... 4
List of Figures ... 12
List of Tables ... 16
List of abbreviations ... 17
Chapter 1 General Introduction………20-57 Gene regulation 1.1.1 Transcription ... 21
1.1.2 Transcription Dynamics ... 24
1.1.3 Chromatin organisation ... 26
1.1.4 Chromatin remodelling ... 28
1.1.5 Genetic variability ... 29
1.1.5.1 Allelic variation: micro-, mini-satellites, repeats and Variable Number Tandem Repeats (VNTR) ... 29
1.2 DNA structure and topology 1.2.1 DNA structure and DNA topology ... 31
1.2.2 The role of DNA supercoiling ... 32
1.2.3 Alternative DNA structure (Non-B DNA) ... 33
1.2.3.1 G-quadruplex ... 35
1.2.3.2 G-quadruplex DNA as therapeutic targets ... 36
1.3 Genes analysed for G-quadruplex DNA 1.3.1 c-MYC ... 39
1.3.1.1 G-quadruplex formation within the CT element of c-MYC ... 42
1.3.2 Monoamine oxidase A (MAOA) ... 44
1.3.2.1 MAOA polymorphic regions (VNTR) ... 44
1.3.3 The serotonin transporter (SLC6A4 / 5-HTT) ... 46
1.3.3.1 Serotonergic signalling pathway; a drug target ... 47
1.4 Transcription factors involved in gene regulation via G-quadruplex
1.4.1 Sp1 ... 50
1.4.2 CTCF ... 52
1.4.3 Nucleolin ... 53
1.4.4 hnRNP K ... 54
1.4.5 CNBP ... 56
1.5 Aims & objectives ... 57
Chapter 2: Materials and Methods……….58-101 2.1Materials 2.1.1 Commonly used solutions and reagents ... 59
2.1.1.1 General Molecular Biology ... 59
2.1.1.2 Chromatin Immunoprecipitation (ChIP) ... 59
2.1.1.3 Microbiology ... 60
2.1.1.4 Chemical stimuli given to cells ... 61
2.1.1.5 Cell and tissue culture media ... 62
2.1.1.6 Plasmids ... 63
2.2Methods 2.2.1 General cloning methods ... 64
2.2.1.1 Polymerase chain reaction (PCR) primer design ... 64
2.2.1.2 Standard PCR ... 64
2.2.1.3 PCR purification ... 65
2.2.1.4 Analysis of DNA using agarose gel-electrophoresis ... 66
2.2.1.5 Recovery of DNA from agarose-gels ... 67
2.2.2 Gibson Isothermal Assembly 2.2.2.1 Gibson Isothermal Assembly design ... 68
2.2.2.2 Removal of 3’ overhangs – T4 DNA polymerase treatment ... 68
2.2.3 Clustered Regularly Interspaced Short Palindromic Repeats - CRISPR associated system (CRISPR-Cas) specific cloning methods.
2.2.3.1 Annealing oligonucleotides ... 69
2.2.3.2 Golden Gate cloning ... 69
2.2.3.3 Transformation of chemically competent E. Coli cells DH5α .... 70
2.2.4 Isolation of DNA constructs from bacteria 2.2.4.1 Mini-preparation of plasmid DNA ... 71
2.2.4.2 Maxi-preparation of plasmid DNA ... 71
2.2.5 Analytical restriction enzyme digests ... 72
2.2.6 Sequencing ... 72
2.2.7 Measurement of nucleic acid concentration by spectrophotometry ... 73
2.2.8 Cell and tissue culture 2.2.8.1 Culture of JAr (human placental chorocarcinoma) cells... 74
2.2.8.2 Culture of SH-SY5Y (human derived neuroblastoma) cells ... 74
2.2.8.3 Culture of HEK-293 (Human embryonic kidney ) cells ... 74
2.2.8.4 Culture of HCT-116 (human colorectal carcinoma) cells ... 74
2.2.8.5 Lithium, cocaine and sodium valproate cell treatments ... 75
2.2.9 Co-transfection experiments 2.2.9.1 Lipofectamine LTX transfection ... 75
2.2.9.2 TurboFect transfection ... 76
2.2.10 mRNA analysis 2.2.10.1 Extraction of total RNA from cells lines ………...…77
2.2.10.2 DNase digestion of total RNA extraction……….….78
2.2.10.3 cDNA synthesis………..78
2.2.10.4 PCR to analyse mRNA expression ………80
2.2.10.5 Quantitative Real Time PCR ……….81
2.2.11 Chromatin Immunoprecipitation (ChIP)………...83
2.2.11.1 Cell fixation and chromatin isolation ………83
2.2.11.2 Shearing of chromatin using sonication……….…83
2.2.11.3 Chromatin capture using magnetic beads………...84
2.2.11.4 Chromatin elution, cross-link reversal and protein degradation………..84
2.2.12 Methylation analysis 2.2.12.1 Isolation of genomic DNA……….86
2.2.12.2 Isolation of methylated DNA……….87
2.2.13 Adeno-associated virus (AAV) gene editing 2.2.13.1 Antibiotic death curve………88
2.2.13.2 Generation of infectious AAV………...88
2.2.13.2.1 AAV Lipofectamine LTX Co-transfections…..……....89
2.2.13.2.2 Harvesting virus from HEK-293 cells …………...…...89
2.2.13.3 AAV purification ………..90
2.2.13.4 AAV quantification (qPCR)………...92
2.2.13.5 Infection of HCT-116 cells with G4KO-CT and rAAV-LoxP-CT………..95
2.2.13.6 Screen of infected cells to identify recombination events…..96
2.2.13.6.1 Visual screen of 96 well plates to identify colony formation………96
2.2.13.6.2 PCR screen of positive wells identified through visual screen………..………97
2.2.13.6.2.1 Expulsion of genomic DNA (gDNA) from cells 2.2.13.6.2.2 PCR screen setup………98
2.2.1.3.6.2 Expansion of positive targeted pools……….100
2.2.1.3.6.3 Single cell dilution (SCD) of targeted pools………..100
2.2.1.3.7 Visual screen of SCD cells to identify clonal cell colony formation………...………...100
Chapter 3: Repeat sequences in the promoter of selected genes have the potential to form the secondary DNA Structure G-quadruplex……….102-142
3.1 Introduction ... 103
3.2 Aims ... 105
3.3 Results ... 106 3.3.1 Mapping repeat elements in the promoters of selected cancer and
neuroscience genes with the potential to form G-quadruplex ... 105
3.3.2 hnRNP K and CTCF bind to the promoters of c-MYC and 5-HTT ……….115
3.3.3 Allelic specific interactions of hnRNP-K and CTCF at the LPR region ………...117
3.3.4 A model to explain the potential biophysical mechanism though which the CT element is able to form G-quadruplex and regulate c-MYC ... 119
3.3.5 Binding of G-Guqdruplex associacted transcription factors to the CT element ... 121
3.3.6 G-quadruplex associacted transcription factors bind in an allele specific manner at the 5-HTT 5’LPR ... 122
3.3.7 G-quadruplex associacted transcription factors bind in an allele specific manner at the MAOA promoter ... 124
3.3.8 Both 3 and 4 copy alleles of MAOA µVNTR are actively transcribing ... 128
3.3.9 Nucleosome exclusion regions overlap with MAOA distal VNTR ... 129 3.3.10 Methylation status of potential G-quadruplex target regions in
SH-SY5Y cells ... 131
Chapter 4: A strategy to destabilize G-quadruplex in the promoter of c-MYC via homologous recombination………143-177
4.1 Introduction ... 144
4.2 Aims ... 145
4.3 Results ... 146
4.3.1 Mutant sequence design ... 147
4.3.2 Assembly of AAV targeting vectors ... 150
4.3.2.1 AAV targeting vector design ... 150
4.3.2.2 AAV targeting vector assembly ... 152
4.3.2.2.1 Left homology arm assembly ... 154
4.3.2.2.2 Right homology arm assembly ... 155
4.3.2.2.3 Construction of the pAAV-G4-CT targeting vector .... 156
4.3.2.2.3.1 Linearization of pAAV-TK-accepter and insertion of RHA (gBlock 4) ... 156
4.3.2.2.3.2 Linearization of pAAV-Gb4 and insertion of LHA (gBlock 1,2,3): ... 159
4.3.2.3 Production of infective AAV particles ... 162
4.3.3 AAV targeting strategy ... 165
4.3.3.1 AAV targeting strategy 1... 165
4.3.3.2 AAV targeting strategy 2... 166
4.3.3.2.1 Co-transfection of pDP2rs rAAV-G4-CT / pAAV-LoxP-CT. ... 168
4.3.3.2.2 Range of cell to virus ratio (MOI) and range at which infected cells were plated (cell / well) ... 169
4.3.3.2.3 PCR screen: AAV-G4-CT and AAV-LoxP-CT ... 170
4.3.3.2.4 rAAV-G4-CT/ rAAV-LoxP-CT control PCR ... 171
4.3.3.2.5 rAAV-G4-CT PCR screen ... 172
4.3.3.2.6 rAAV-LoxP-CT PCR screen... 173
4.3.3.2.7 Positive rAAV-LoxP-CT and rAAV-G4-CT PCR re-screen ... 174
4.3.3.2.8 Sequence verification of positive rAAV-LoxP-CT ... 175
Chapter 5: CRISPR & AAV, an efficient approach to gene editing.178-205
5.1 Introduction ... 180
5.1.1 CRISPR-Cas ... 181
5.1.2 Gene targeting efficiency is increased by double strand breaks ... 185
5.2 Aims ... 186
5.3 Results ... 187
5.3.1 A strategy to KO Mir-137 using CRISPR-Cas & AAV ... 187
5.3.2 Overview of CRISPR-Cas gene editing system to KO Mir137 ... 189
5.3.3 Mir-137 gRNA oligonucleotide design ... 190
5.3.4 Inserting gRNA into pGUIDE ... 191
5.3.5 CRISPR-Cas transfection optimisation ... 193
5.3.6 Verification of CRISPR-Cas targeting efficiency ... 194
5.3.7 rAAV-Mir-137KO infection ... 197
5.3.8 PCR screen of AAV-Mir137-KO verifying positive recombination events ... 198
5.3.9 rAAV-Mir-137KO PCR screen ... 199
5.3.10 rAAV-Mir-137KO verification ... 201
5.3.11 Positive PCR screen of single cell diluted Mir-137 KO clone to verify hemizygous KO ... 203
5.3.12 Confirmation of positive PCR screen for single cell diluted Mir-137 KO clone. ... 204
5.4 Discussion ... 205
Appendix ... 206
List of Figures
Chapter 1
1.1 Initiation of transcription by RNA pol II: holoenzyme model vs. the stepwise
assembly mode ... 23
1.2 Random 3D scanning model of transcription factor binding ... 25
1.3 Levels of chromatin organisation ... 27
1.4 Examples of the various polymorphisms ... 30
1.5 Supercoiling generated during transcription and replication ... 32
1.6 Possible alternative DNA structures and their conformations ... 33
1.7 Possible G-quadruplex formations ... 36
1.8 HIV-1 G-Quadruplex ... 38
1.9 c-MYC promoter structure ... 40
1.10 Sequence and structures of the G‑quadruplex and i‑motif within the CT element ... 41
1.11 A model describing the dynamic transition trough alternative DNA conformations at the CT element ... 43
1.12 Schematic representation of the 5-HTT structure ... 48
1.13 Sequence of long and short variants of the 5’LPR with CTCF binding sites ... 49
Chapter 3
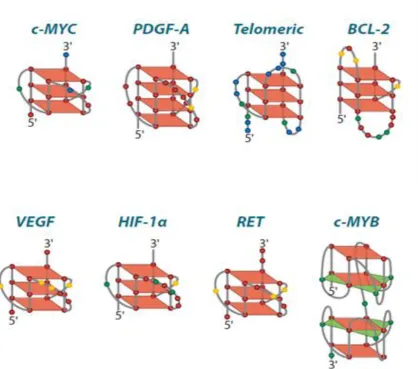
3.1 G-Quadruplex present in Cancer genes ... 103
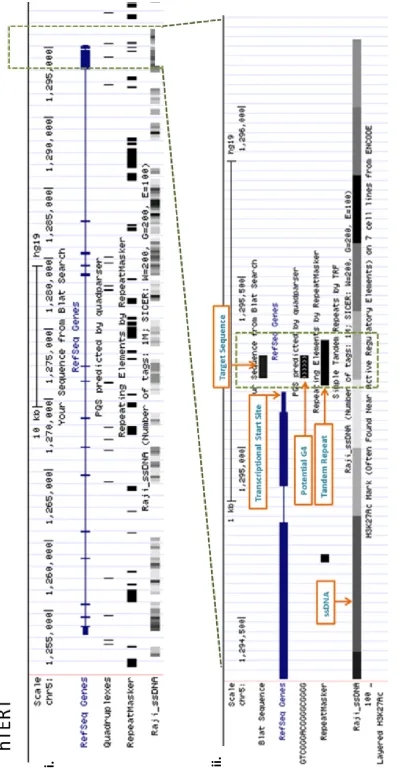
3.2a Key to Figure 1b-g ... 108
3.2b c-MYC UCSC in-silico analysis ... 109
3.2c hTERT UCSC in-silico analysis ... 110
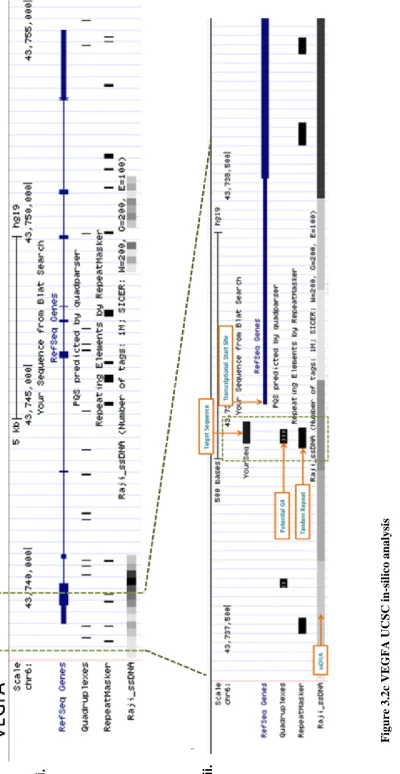
3.2d VEGFA UCSC in-silico analysis ... 111
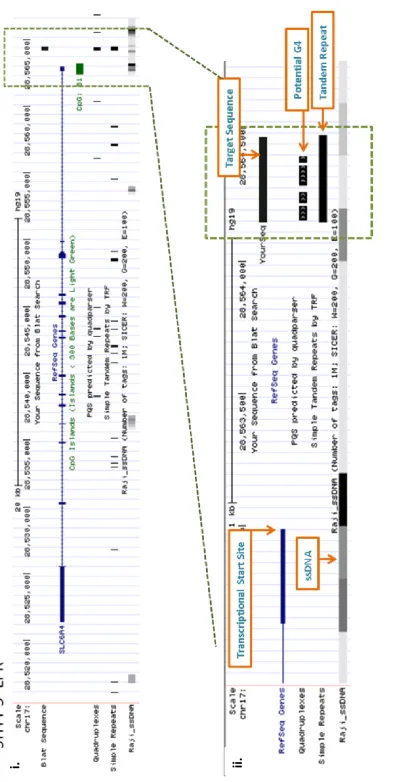
3.2e 5-HTT UCSC in-silico analysis ... 112
3.2f MAOA UCSC in-silico analysis ... 113
3.2g DAT-1 UCSC in-silico analysis ... 114
3.3 ChIP analyses of the CT element in HCT-116 cells ... 116
3.4 ChIP analyses over the LPR region, in HCT-116 cells ... 116
3.5 JAr cell line (heterozygous for long and short LPR) identifies allelic specific interactions at the region ... 118
3.6 A model to explain the potential biophysical mechanism though which the CT element is able to form G-quadruplex and regulate c-MYC ... 120
3.7 G-quadruplex associacted transcription factors bind at the CT-element….121 3.8 G-quadruplex associacted transcription factors bind in an allele specific manner at the 5’ LPR ... 123
3.9 MAOA promoter contains a proximal (µ) VNTR and a distal (d) VNTR ... 124
3.10 Bioinformatic analysis of the transcription factor binding sites across the MAOA Promoter ……….…126
3.11 G-quadruplex associacted transcription factors bind in an allele specific manner at the MAOA promoter………..….127
3.12 Both 3 and 4 copy alleles of MAOA µVNTR are actively transcribing in SH-SY5Y cells……….……..……….128
3.14 Methylation at the CT element and 5-HTT 5’ LPR………...132
3.15 Methylation at the MAOA promoter………...…....133
3.16 G-Quadruplex within the 5-HTT 5’ LPR (long and short)…………...136
3.17 Schematic describing possible events that can occur when formaldehyde enters a cell………..…...140
3.18 Schematic describing possible events that can occur when formaldehyde enters a cell……….………..141
Chapter 4 4.1 Mutated sequence design ... 150
4.2 Gibson Isothermal assembly ... 153
4.3 Left homology arm assembly ... 154
4.4 Linearized rAAV-TK-accepter ... 156
4.5 Insertion of RHA (gBlock 4) into the pAAV-TK-accepter ... 157
4.6 Restriction enzyme digestion analysis of pAAV-Gb4... 158
4.7 Construction of the pAAV-G4-CT targeting vector ... 160
4.8 Restriction enzyme digestion analysis of pAAV-G4-CT targeting vector ... 161
4.9 AAV virus particle production ... 162
4.10 Overview of AAV targeting approach to KO G-quadruplex at the CT element ………..163
4.11 Overview of AAV targeting approach to introduce LoxP internal control at the CT element……….….164
4.12 AAV targeting strategy 1………... 165
4.13 AAV targeting strategy 2……….…….166
4.14 Co-transfection efficiency - pDP2rs rAAV-G4-CT………..…....168
4.15 PCR screen primer design and strategy ………..…….170
4.17 rAAV-G4-CT PCR screen……….…..172
4.18 rAAV-LoxP-CT PCR screen……….….173
4.19 PositiverAAV-LoxP-CT and rAAV-G4-CT PCR re-screen………174
4.20 Sequencing data from positive pool of cells verified using the sequence alignment tool clustal omega (EMBL EBI). 175 Chapter 5 5.1 Type II CRISPR-Cas systems in bacteria. ... 186
5.2 Cas9-sgRNA targeting complex. ... 187
5.3 Modified gene editing strategy; CRISPR & AAV to KO Mir137 ... 188
5.4 Stages involved in CRISPR-Cas mediated gene targeting ... 189
5.5 Identification of CRISPR-Cas gRNA recognition sequence in Mir-137.190 5.6 Inserting gRNA into pGUIDE ... 192
5.7 Transfection optimisation ... 193
5.8 Verification of CRISPR-Cas targeting efficiency ... 196
5.9 rAAV-Mir137-KO PCR screen primer design and strategy ... 197
5.10 rAAV-Mir-137-KO PCR screen ……….200
5.11 rAAV-Mir-137 KO verification………...201
5.12 Positive PCR screen of single cell diluted Mir-137 KO clone………...203
List of Tables
Chapter 2
2.1 Standard curve using dilutions of rAAV-G4-CT ... 92
Chapter 4 4.1 Range of cell to virus ratio (MOI) and range at which infected cells were plated (cell / well) ... 169
Chapter 5 5.1 Range of cell to virus ratio MOI and range at which infected cells were plated (cell / well) ... 197
5.2 Comparison of targeting efficiencies between various approaches used. ... 206
Appendix 6.2 vectors cloned during this study... 210
6.1: Primer sequences and PCR conditions used during this study ... 211
6.3 Virus generated during this study ... 212
List of Abbreviations
A Adenine
AAV Adeno-associated virus ATP Adenosine-5'-triphosphate BLAT BLAST-like alignment tool
bp Base pairs
C Cytosine
cDNA complementary deoxyribonucleic acid ChIP Chromatin immunoprecipitation CNS Central nervous system
CpG CG dinucleotides CTCF CCCTC binding-protein
DAT1 Dopamine transporter (SLC6A3) dATP deoxyadenosine trisphosphate dCTP Deoxycytidine triphosphate dGTP Deoxyguanosine triphosphate dI/dC deoxyinosinic-deoxycytidylic acid dTTP Deoxythymidine triphosphate DHSs DNase-hypersensitive sites
DMEM Dulbecco's modified eagle's medium DMSO Dimethylsulphoxide
DNA Deoxyribonucleic acid
dNTP Deoxynucleotide triphosphate DTT Dithiothreitol
EDTA Ethylenediamine tetraacetic acid EGTA Ethylene glycol tetraacetic acid, FBS Fetal bovine serum
G Guanine
×g times gravity
GTFs General transcription factors
H3K4m2 di-methylation of lysine 4 in histone H3 H3K9m2 di-methylation of lysine 9 in histone H3 H3K36m3 tri-methylation of lysine 36 in histone H3 HDAC Histone deacetylase complex
HeLa Henrietta Lacks clonal cell line
HEPES 4-(2-hydroxyethyl)-1-piperazineethanesulfonic acid hnRNA Heterogeneous nuclear ribonucleic acid
JAr human placental choriocarcinoma
kb Kilobases
KCl Potassium chloride LiCl Lithium chloride
l-allele Long variants of the 5’ promoter VNTR of the 5-HTT gene LB Luria-bertani broth
LPR Linked polymorphic region MeCPs Methyl-CpG-binding proteins
µg Micro-grams
µM Micro-molar
µl Micro-litre
mM mill-molar
mRNA Messenger ribonucleic acid
NCBI National center for biotechnology information
ng nano-grams
nm nanometer
ORF Open reading frame
OCD Obsessive compulsive disorder p300 E1A binding protein p300 PBS Phosphate buffer saline PCR Polymerase chain reaction Pmol Pico-molar
Pol II polymerase II PFC Prefrontal cortex PIC Preinitiation complex qPCR Quantitative PCR RNA Ribonucleic acid RPM Revolutions per minute
RPMI Roswell Park Memorial Institute RT-PCR Reverse transcriptase PCR
s-allele short variants of the 5’ promoter VNTR of the 5-HTT gene SDS Sodium dodecyl sulphate
SeqChIP Sequential chromatin immunoprecipitation SERT Serotonin transporter
SLC6A4 Serotonin transporter SLC Solute carrier gene family
SNP Single nucleotide polymorphisms Stin2 VNTR in Intron 2 of 5-HTT
SPECT Sngle photon emission computed tomography SSRI selective serotonin reuptake inhibitors
SV40 Simian virus 40 TBE Tris/Borate/EDTA TBP TATA binding protein TCA Tricyclic antidepressants TF Transcription factor
TFBS Transcription factor binding sites TRD Transcription repression domain UCSC University of California Santa Cruz UTRs Untranslated regions
UV Ultraviolet irradiation
V voltages
VNTR Variable number of tandem repeat 5HT Serotonin
Chapter 1
1.1 Gene regulation
1.1.1 Transcription
Transcription is the key step in regulation of gene expression; a fundamentally stochastic process with randomness in transcription and translation leading to cell-cell variations in mRNA and protein levels (Raj and van Oudenaarden, 2008).
termination are all additional steps in eukaryotic gene expression reviewed in (Fuda et al., 2009, Lee and Young, 2000, Orphanides and Reinberg, 2000). It should be noted that although the PIC been implicated in selecting the accurate transcription start site (TSS), promoter melting, and Pol II promoter escape (Matsui et al., 1980, Roeder, 1996, Goodrich et al., 1996) the details as to how this essential complex assembles remain elusive (He et al., 2013).
Figure 1.1: Transcription initiation; association of RNA polymerase II and GTFs to core promoter.
A schematic showing the core promoter elements: TATA-box, promoter-proximal elements and promoter-distal elements interacting with RNA polymeraseII and the general transcription factors during transcription (adapted from B. Lewin, Genes IX).
1.1.2 Transcription Dynamics
Figure 1.2 Random 3D scanning model of transcription factor binding
1.1.3 Chromatin organisation
In order to fit the 2m length of DNA into the 6μm nucleus of eukaryotic
cells, DNA must be densely packaged as chromatin. The fundamental unit of chromatin is the nucleosome, in which 147 DNA base pairs are wrapped 1.65 turns around the core histone octamer. Histones are small basic proteins consisting of globular domains and a charged amino-terminus (N-terminus) tail. The core histone octamer consists of two copies of each of the histones H2A, H2B, H3 and H4 (Luger et al., 1997, Kornberg and Thomas, 1974). These strong and repetitive interactions between DNA and histones occur as a result of the negatively charged phosphate backbone of the DNA molecule, and the charged amino-terminus (N-terminus) tail of the histone; one fifth of these amino acids are positively charged (lysine and arginine). More than 14 contact points exist between histones and DNA which make the nucleosome a stable protein-DNA interaction under physiological conditions. Short stretches of naked DNA termed linker regions connect nucleosomes to one another. Linker DNA ranges in length between 20 and 90 bp and varies between different species and even within a single cellular genome (Woodcock et al., 2006, Godde and Widom, 1992). Decondensed chromatin; 11-nm fibre is often referred to as ‘beads on a string’, with each ‘bead’ a nucleosome and the ‘string’ the linker
DNA. The binding of a fifth histone creates a more condensed higher-ordered structure. The next level of compaction is termed ’30-nm fibre’ which is organised by the linker histone H1 binding to the linker DNA and a nucleosome on either side. The 30-nm fibre is further condensed forming looped domains termed ‘300-nm fiber’. The final level of compaction is the looped ‘300-nm fibre’ being further
Figure 1.3 Levels of chromatin organisation.
Organization of DNA into the various levels of chromatin structure, a. Duplex DNA, b. 11nm nucleosome, c. 30nm nucleosome, d. 300nm nucleosome e. Section of condensed chromosome, f. mitotic chromosome. (Adapted from Felsenfeld and Groudine, 2003).
Incr
eas
ing
le
vel
s of
cond
ens
at
ion
Short region of DNA double helix
“Beads on a string” Form of chromatin
30-nm chromatin fibre of packed nucleosomes
Section of
chromosome in an extended form
Condensed section of chromosome
[image:26.595.111.475.118.562.2]1.1.4 Chromatin Remodelling
As transcription factors are traversing the nuclear landscape it is essential they can access the DNA in order to interact with it and orchestrate their regulatory function. Due to the strong binding energy between nucleosomes and DNA, reorganisation of the nucleosome structure must accompany any transcription factor-DNA interaction (Hager et al., 2009). Further, in-vivo experiments have provided significant evidence indicating that disruption of nucleosome structure is required for proper elongation; identifying the fact that nucleosome disruption travels along the gene faster than the rate of RNA polymerase II translocation (25 nucleotides per second) (Petesch and Lis, 2008, Izban and Luse, 1992).
The original studies (Wu et al., 1979) describe DNaseI hypersensitive sites (DHS), which represent chromatin regions sensitive to nucleolytic agents specifically DNaseI and micrococcal nuclease (MN), indicating that these regions have disrupted nucleosome structures. Global studies now estimate 2% of the mammalian genome has disrupted nucleosome structure (Hesselberth et al., 2009, Boyle et al., 2008). Transcriptional regulatory elements are strongly associated with these DHS sites (John et al., 2008) therefore chromatin remodelling is implicitly related with binding of transcription factors.
1.1.5 Genetic variability
1.1.5.1 Allelic variation: micro-, mini-satellites, repeats and Variable Number Tandem Repeats (VNTR)
Over 500,000 micro- or mini-satellites have been identified in the human genome. 10–100 nucleotides repeated several times in tandem and bordered by unique DNA sequences are defined as mini-satellites. Micro-satellites also called Short Tandem Repeats (STRs) have smaller sequence repeats e.g., tetra and di-nucleotide sequence repeats (Figure 1.4).
Some degree of degeneration is usually observed in the repeating units; where one repeat may be slightly different to the next but the overall core consensus sequence is maintained. In order to determine whether a repeat unit is variable, genotyping is used; this enables identification of different allelic copy numbers existing between individuals in a population, for example at the same allelic loci, one individual may have 8 copies of a repeat, whilst another may have 10 copies (Warburton et al., 2014).
(Soeby et al., 2005, Lovejoy et al., 2003, Klenova et al., 2004). In support of the hypothesis that VNTRs are able to act as modulators of gene expression many are located at higher density in gene enriched areas compared to non-genic regions (Breen et al., 2008). Potential regulatory VNTRs have been identified in the serotonin transporter (5-HTT), dopamine transporter (DAT1), N-methyl-Daspartame receptor 1 (GRIN1/NMDAR), dopamine D4 receptor (DRD4), and monoamine oxidase A (MAOA). VNTRs are predicted to act as endogenous modulators of transcription or to alter post transcriptional properties of the gene such as mRNA stability. Based on published data by the Quinn group, VNTRs can function in both a tissue-specific and stimulus-inducible manner to fine-tune gene expression (Haddley et al., 2012, Vasiliou et al., 2012). This control over gene expression could be mechanistically correlated with normal physiological function, variation between individual, and a number of diseases and disorders (Ali et al., 2010). A further implication is that if stimulus inducible expression is variable based on a specific polymorphism associated with a disorder then that may in turn have implications on the response to specific pharmacological treatment (Fiskerstrand et al., 1999, MacKenzie et al., 2000, MacKenzie and Quinn, 1999, Lovejoy et al., 2003, Klenova et al., 2004, Roberts et al., 2007).
Figure 1.4 Examples of the various polymorphisms
1.2 DNA structure and topology
1.2.1 DNA structure and topology
The dynamics and function of proteins interacting with DNA are indeed central to transcriptional regulation, however evidence is emerging to suggest that DNA itself in terms of its structure and topology may play a role in gene regulation and as such should no longer be thought of solely as a passive information repository (Kouzine et al., 2013a, Lavelle, 2009).
Genetic processes such as transcription and replication apply physical forces to DNA (Figure 1.4), and in turn alter the molecules structure (Baranello et al., 2012). The structural changes that distort the double helix are known as supercoiling or DNA torsional stress and occur as over twisting, under twisting and associated loop-like plectoneme structures (Vologodskii et al., 1992). According to the “twin domain” theory DNA is thread through the transcription machinery, forcing it to
1.2.2 The role of DNA supercoiling
DNA supercoiling has a direct influence on nucleosome structure, with positive DNA supercoiling facilitating unwrapping of DNA from the histones, and negative supercoiling promoting nucleosome formation (Freeman and Garrard, 1992). It has therefore been suggested that a burst of transcription which drives positive supercoiling ahead of the translocating RNA polymerase (Liu and Wang, 1987, Vologodskii et al., 1992) could in fact be “clearing the way” for polymerase to elongate through a nucleosome dense landscape (Recouvreux et al., 2011, Zlatanova and Victor, 2009). Negatively supercoiled DNA left behind the transcription machinery would be conducive of rapid nucleosome re-formation in the wake of the elongating complex (Baranello et al., 2012). Taking these data into account, it is likely that by varying the intensity and polarity of supercoiling, chromatin formation could be directly regulated to meet transcriptional demands in real-time. This assertion fits with the modern view of chromatin remodelling being a continuous and dynamic process (Hager et al., 2009).
Figure 1.5 Supercoiling generated during transcription and replication.
1.2.3 Alternative DNA structure (Non-B DNA)
In addition to nucleosome arrangement and the covalent modification of histones, alternative DNA conformation provides another source of structural diversity in determining gene activity. Further these alternative DNA structures may contribute to the transmission of epigenetic states (Kouzine and Levens, 2007), through their ability to modify transcription factor binding sites and influence nucleosome structure. Non-B DNA structures include single-stranded DNA (Michelotti et al., 1996b), H-DNA (Htun and Dahlberg, 1989), Z-DNA (left handed double helix) (Rich and Zhang, 2003), G-quadruplex DNA (Simonsson, 2001), triplex DNA (Gilbert and Feigon, 1999), slipped-strand DNA (Pearson and Sinden, 1996), sticky DNA (Son et al., 2006), S(stretched)-DNA (Cluzel et al., 1996) and cruciforms (Shlyakhtenko et al., 1998).
1.2.3.1 G-Quadruplex
G-quadruplexes are four-stranded DNA structures, the sequence of DNA that enables these structures to form is (G3+ N1-7 G3+ N1-7 G3+ N1-7 G3). This sequence arrangement creates two or more G-tetrads; four hydrogen-bonded guanines in a planar arrangement (Figure 1.7). Transcription induced negative supercoiling makes it energetically possible for duplex DNA to adopt the G-quadruplex formation, stabilized by monovalent cations, such as K+ and Na+, that intercalate between the G-tetrads and coordinate bonds with the guanine carbonyl groups (Dapic et al., 2003, Sun and Hurley, 2009).
1.2.3.2 G-quadruplex DNA as therapeutic targets
[image:34.595.118.537.274.643.2]A wide range of G-Quadruplex structures are possible (Figure 1.6) this topological diversity is a result of variations in sequence, strand directionality, loop length, and the number of tetrad stacks (Gonzalez and Hurley, 2010a). This diverse spectrum provides an opportunity to development specific molecules that can modulate the formation or stabilize these structures and in turn regulate gene expression.
Figure 1.6 Possible of G-quadruplex formations
For example the G-quadruplex that forms within the CT element of c-MYC has been demonstrated to function as a repressor element (Siddiqui-Jain et al., 2002). Therefore developing compounds that can stabilize this structure could be used to specifically repress c-MYC expression. c-MYC has been implicated in most aspects of tumour biology with deregulation generally due to gene amplification, translocation, altered ploidy and increased transcription (Marcu et al., 1992, Spencer
and Groudine, 1991). Therefore selectively targeting its aberrant expression would be an attractive therapeutic intervention. In fact a number of molecules have been explored as potential G-quadruplex stabilising agents, including TMPyP4, which was shown to decrease c-MYC expression at both the mRNA and protein levels, as well as lower the level of several c-MYC–regulated genes (Grand et al., 2002). More recently the Balasubramanian group have identified pyridine-2,6-bis-quinilodicarboxamide derivative, pyridostatin5 (PDS) as an exciting G-quadruplex stabilising ligand.(Murat et al., 2013, McLuckie et al., 2013, Muller et al., 2012)
1.3 Genes analysed for G-quadruplex DNA 1.3.1 c-MYC.
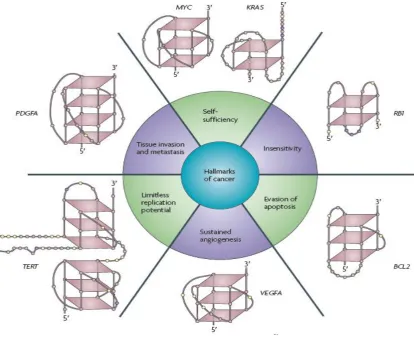
c-MYC is a transcription factor and 10–15% of genes are regulated by this protein (Fernandez et al., 2003, Li et al., 2003, Zeller et al., 2006). c-MYC has been shown to interact with numerous transcription and chromatin regulators (Cheng et al., 1999, Cowling and Cole, 2006, Eilers and Eisenman, 2008, Rahl et al., 2010, Wasylishen and Penn, 2010) and is implicated in most aspects of tumour biology, including apoptosis, proliferation metastasis, angiogenesis and changes in the tumour microenvironment (Oster et al., 2002, Eisenman, 2001). c-MYC is the key example used by Weinstein to describe the concept of “oncogenic addiction” whereby some
cancers appear to rely on one or a few genes to maintain the malignant phenotype, therefore genes such as c-MYC may be the “Achilles heel” in specific cancers (Weinstein et al., 1997, Weinstein, 2002). A seminal paper by the Levens Lab addresses the “addiction” to c-MYC, through a simple rule which explains the majority of c-MYC biology: c-MYC is not an on-off specifier of gene activity, but a nonlinear amplifier of expression. This means it acts universally at active genes except for a class of genes termed ‘immediate early’ genes that are induced before
Figure 1.7 c-MYC promoter structure
c-MYC promoter contains 5 NHE domains NHE I – V, with arrows to identify location within the promoter. NHE III1 is the CT element, expanded in the insert below to show G-rich and C-rich regions of the sequence, (adapted from (Gonzalez and Hurley, 2010a)
Figure 1.8 Sequence and structures of the G‑quadruplex the CT element
Four guanine residues form a tetrad, and three tetrads can stack to form an intramolecularly linked G-quadruplex with a 1/2/1 looping pattern. (Figure adapted from Brooks and Hurley, 2009).
Hoogsteen base pairing
1.3.1.1 G-quadruplex formation within the CT element of c-MYC
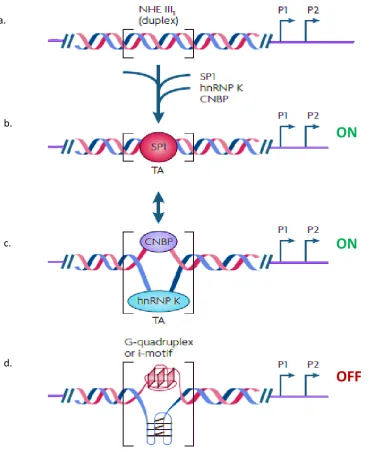
The discovery of the Non-B DNA structures; G-quadruplex and i-motif within the CT element of the c-MYC promoter (Sun and Hurley, 2009) led to the suggestion that these structures may play a role in the regulation of c-MYC. One model that has been proposed describes the transition of the CT element through three DNA structural motifs, two of which lead to activation and one that results in repression of c-MYC (Figure 1.19).
When in duplex form, the transcriptional factor Sp1 binds to the CT element and activates transcription (DesJardins and Hay, 1993). This increased level of transcription could result in the accumulation of supercoiling and flip the CT element into the single-stranded conformation. This would allow the single strand DNA binding proteins hnRNP K and CNBP to bind the purine-rich and pyrimidine-rich strands, respectively in turn maintaining the active state (Brooks and Hurley, 2009, Tomonaga and Levens, 1996, Michelotti et al., 1995). In addition to single-stranded conformation, the CT element can adopt stable non-B DNA structures, a G-quadruplex on the purine-rich strand and an i-motif on the pyrimidine-rich strand (Sun and Hurley, 2009). These globular structures sequester the standard B-DNA transcription factor binding sites and potentially silence transcription.
Figure 1.9 A model describing the dynamic transition trough alternative DNA conformations at the CT element.
a.CT element in standard duplex DNA without proteins bound. b. Binding of Sp1 to the duplex structure, resulting in activation of c-MYC expression. c. Binding of single stranded binding proteins hnRNP K and CNBP to the single stranded C and G rich regions, respectively, results in activation of c-MYC transcription. d. The formation of the G-quadruplex and i-motif sequestering duplex DNA binding sites resulting in repression of c-MYCtranscription.
a.
b.
c.
d.
ON
ON
[image:41.595.125.503.82.535.2]1.3.2 Monoamine oxidase A (MAOA)
MAOA is a key brain enzyme which metabolises monoamines, preferentially serotonin (5-HT), noradrenaline (NA) and dopamine (DA). Modulation of the expression of MAOA, resulting in differential levels of active protein, is implicated in the pathophysiology of numerous neuropsychiatric disorders (Reif et al., 2013, Fan et al., 2010). The gene is considered an excellent model for gene x environment (GxE) interactions that underlie mental health (Caspi et al., 2002).
1.3.2.1 MAOA polymorphic regions (VNTRs)
1.3.3 The serotonin transporter (SLC6A4 / 5-HTT)
Serotonin (5-hydroxytryptamine / 5-HT) is a monoamine neurotransmitter and a known neuromodulator of emotional behaviour and psychological states. Instabilities in the serotonergic system are associated with the pathophysiology of many CNS-related disorders including depression (Ressler and Nemeroff, 2000, Lesch et al., 2003), aggression and antisocial behaviour (Lesch and Merschdorf, 2000), anxiety (Ressler and Nemeroff, 2000, Lesch et al., 2003), suicide (Arango et al., 2002) and addiction (Kreek et al., 2005).
The serotonin transporter also termed (5-HTT, SLC6A4, SERT) is a Na+/Cl -dependent transporter member of the solute carrier gene family (SLC). In the CNS, 5-HT and 5-HTT localise predominantly in the perisynaptic membrane of neurons within the raphe nuclei. Raphe nuclei processes innervate a number of brain areas thought to be involved in behaviour regulation and cognition (McLaughlin et al., 1996, Zhou et al., 2000). Once 5-HT has been released into the synaptic cleft, the 5-HTT mediates its presynaptic reuptake to be recycled by the cell or degraded by monoamine oxidases resulting in serotonergic neurotransmission termination (Rudnick and Wall, 1993). The 5-HTT plays an essential role in regulating the spatiotemporal fine-tuning of the 5-HT neurotransmission by determining the duration and amplitude of 5-HT synaptic signal (Blakely et al., 1991).
1.3.3.1 Serotonergic signalling pathway a drug target
Antidepressants known as selective 5-HT reuptake inhibitors or SSRIs target the 5-HTT to increase the bioavailability of 5-HT in the synaptic cleft (Roman et al., 2003). Tricyclic antidepressants (TCA) such as amtriptyline also target the 5-HTT and despite the undesirable side effects are still in widespread (Roman et al., 2003).
1.3.3.2. 5-HTT 5’ linked polymorphic region (LPR) VNTR
Figure 1.10 Schematic representation of the 5-HTT gene.
1.4 Transcription factors involved in gene regulation via G-quadruplex
1.4.1 Sp1
The transcription factor Sp1 is ubiquitously expressed in mammalian cells and plays an important role in the regulation of a number of genes central to many cellular activities including metabolism, cell growth, differentiation, angiogenesis and apoptosis (Deniaud et al., 2009). Sp1 is a 785-amino-acid, 100- to 110-kDa DNA binding protein and is characterized by three Cys2His2-type zinc finger motifs. These zinc fingers interact with the decanucleotide consensus sequence 5’(G/T)GGGCGG(G/A)(G/A)(C/T)-3’ in double-stranded DNA (Song et al., 2001).
However its binding sequence is known to be degenerate; binding a number of GC-rich motifs (such as 5’ -G/T-GGGCGG-G/A-G/A-C/T-3’ or
5’-G/T-G/A-GGCG-G/T-G/A-G/A-C/T-3’ ) with high affinity (Briggs et al., 1986, Kadonaga and Tjian, 1986, Kadonaga et al., 1987). Sp1 is able to mediate the expression of TATA-containing and TATA-less genes through protein-protein interactions or via dynamic interplay with additional transcription factors (Olofsson et al., 2007). Such genes include c-MYC (Parisi et al., 2007), c-Jun (McDonough et al., 1997), and Stat1 (Canaff et al., 2008). Interactions with chromatin-modifying factors such as p300 (Suzuki et al., 2000) and histone deacetylases (HDACs) (Zhao et al., 2003), suggest a role for Sp1 in chromatin remodelling.
1.4.2 CTCF
CTCF is a ubiquitously expressed zinc finger DNA-binding protein which is highly conserved in higher eukaryotes. The full length protein contains an eleven zinc finger central DNA-binding domain that displays close to 100% homology between mouse, chicken, and human (Ohlsson et al., 2001). Combinatorial use of different zinc fingers give CTCF its ability to bind to a wide range of variant sequences in addition to specific co-regulatory proteins leading to its description as a “multivalent factor” (Filippova et al., 1996). This unique structural feature confers a
versatile role in genome regulation (Phillips and Corces, 2009), including promoter repression, enhancer insulation and more recently, long-range interactions (Dixon et al., 2012). CTCF functions also extend to roles in differentiation and development (Torrano et al., 2005), regulation of cell proliferation (Rasko et al., 2001), tumour suppression (Filippova et al., 1998, Filippova et al., 2002) and apoptosis (Docquier et al., 2005).Thousands of CTCF DNA-binding sequences are present in the genome, including the CT element within the promoter of c-MYC, (Lobanenkov et al., 1990, Klenova et al., 1993) and the 5’ LPR VNTR within the promoter of 5-HTT (Ali et al., 2010, Vasiliou et al., 2012).
1.14 DNA logo representing CTCF-binding motif.
1.4.2 Nucleolin
Nucleolin is a 110-kDa multifunctional nucleolar phosphoprotein with an active role in numerous cellular processes; including ribosome biogenesis, cell proliferation, chromatin decondensation, differentiation and maintenance of neural tissue, transcriptional regulation, and apoptosis (Storck et al., 2007, Mongelard and Bouvet, 2007, Grinstein et al., 2007, Grinstein et al., 2002, Ginisty et al., 1999). Nucleolin is described as a modular protein as it can be structurally divided into three discrete domains: 1) The N-terminal, consisting of highly acidic regions punctuated by basic sequences housing multiple phosphorylation sites. 2) The central domain, which contains four RNA-binding motifs. 3) The C-terminal, defined by spaced RGG repeats punctuated by amino acids. It is the association of these structural domains that allow nucleolin to interact with different proteins and RNA sequences (Ginisty et al., 1999).
1.4.4 hnRNP K
hnRNP K is a 463-residue modular nucleic acid binding protein characterized by the presence of KH domains. Unlike most transcription factors this class of binding protein does not target double stranded DNA. In vivo and in vitro studies have shown these proteins to specifically bind and transactivate single-stranded cis elements within the c-MYC promoter. (Matunis et al., 1992, Bomsztyk et al., 1997, Ostareck-Lederer et al., 1998).
1.4.5 CCHC-type zinc finger nucleic acid binding protein (CNBP)
CCHC-type zinc finger nucleic acid binding protein (CNBP) is a multifunctional protein comprised of seven cysteine-cysteine histidine-cysteine zinc knuckles and an arginine-glycine-glycine (RGG) domain. The protein has been shown to control cell proliferation and survival, implicating it in embryonic development, especially in forebrain and craniofacial development (Chen et al., 2003).
CNBP has been shown to bind to the purine-rich single strand of the c-MYC CT element followed by induction of c-MYC expression, it has therefore been suggested that CNBP may function to mediate c-MYC expression (Michelotti et al., 1995, Armas et al., 2008b). A function for CNBP in the regulation of c-MYC is supported by studies into CNBP−/− mouse embryos, which have been shown to have a substantial reduction in cell proliferation, correlating with the absence of c-MYC expression (Chen et al., 2003). The RGG domain of CNBP has been identified as essential for its nucleic acid binding activity and induction of c-MYC expression. The zinc knuckles of the protein only partially contribute towards its function in this capacity, as identified by functional mutation analysis (Armas et al., 2008a). Interestingly proteolytic mechanisms have been proposed as the way in which CNBP’s biochemical activity is regulated owing to the identification of truncated
Aims and objectives:
1. Address the potential for repeat elements in the promoter of selected genes to form G-quadruplex using both in-silico and preliminary biochemical analysis; transcription factor binding and methylation status at the promoters of selected genes.
2. Use AAV targeting vectors to destabilise G-quadruplex structures to assess directly the capacity of and mechanism through which G-quadruplex influences gene expression, initially validating the approach in the c-MYC promoter with the well characterized CT element.
Chapter 2
2.1 Materials
2.1.1 Commonly used solutions and reagents
2.1.1.1 General Molecular Biology
5x TBE buffer
54 g Tris(hydroxymethyl)methylamine (Tris) (BDH), 27.5 g boric acid (Sigma), 20 ml 0.5 M Ethylenediamine Tetraacetic Acid (EDTA) (Sigma) and dH2O up to 1 litre.
6x agarose gel loading buffer
0.25% (w/v) Bromophenol blue, 0.25% (w/v) xylene cyanol, , 1 mM EDTA, 30% glycerol and 70% water.
2.1.1.2Chromatin Immunoprecipitation (ChIP)
Cell lysis buffer
50mM Hepes-KOH pH7. 5, 140mM NaCl, 1mM EDTA, 10% glycerol, 0.5% NP-40, 0.25% Triton X-100, protease inhibitor cocktail (Sigma Cat No. P8340)
Nuclear lysis buffer
10mM Tris-HCl, pH8.0, 200mM NaCl, 1mM EDTA, 0.5mM EGTA, protease inhibitor cocktail (Sigma)
ChIP dilution buffer
16.7 mM Tris–HCl, pH 8.1, 167 mM NaCl, 1.1%Triton X-100, 0.01% SDS, 1.2 mM, EDTA, protease inhibitor cocktail (Sigma)
Magnetic beads
Dynabeads Protein G (Invitrogen™ 10003D)
Low-salt wash buffer 20 mM Tris–HCl, pH 8.1, 150 mM NaCl, 0.1% SDS, 1% Triton X-100, 2 mM
EDTA,
High-salt wash buffer
20 mM Tris–HCl, pH 8.1, 500 mM NaCl, 0.1% SDS , 1% Triton X-100, 2 mM EDTA.
Lithium chloride (Li Cl) wash buffer
TE buffer
10 mM Tris–HCl, pH 8.0, 1 mM EDTA.
Elution buffer
50 mM Tris–HCl, pH 8 1 mM EDTA, 1%SDS, 50 mM NaHCO 3, 2. 5 M NaCl.
RNAse
RNAse A: 20 mg/ml. (Sigma)
SDS 10%.
Sodium dodecyl sulfate (Sigma) 10% w/v in dH2O
Proteinase K.
Proteinase K solution (Qiagen)
2.1.1.3 Microbiology
Super optimal growth media with catabolite repression (SOC)
20 g/L Tryptone, 5 g/L Yeast Extract, 4.8 g/L MgSO4, 3.603 g/L dextrose, 0.5g/L NaCl, 0.186 g/L KCl.
Luria broth (LB) media
10.0 g/L trypton, 5.0 g/L yeast extract and 10.0 g/L NaCl.
LB agar
2.1.1.4Chemical stimuli given to cells
1 M Lithium chloride (Sigma Cat. No. L9650)
0.42 g in 10 ml of dH2O, used at 1 mM (1 l in 1 ml of appropriate tissue culture media).
1 mM Cocaine hydrochloride (Sigma Cat. No. C5776)
0.0034 g in 10 ml of dH2O, use at 1 µM (1 l in 1 ml of appropriate tissue culture media) or at 10 µM (10 l in 1 ml of appropriate tissue culture media).
10mM Valproic acid sodium salt (Sigma Cat. No. P4543)
0.16g in 10ml of dH₂O sterile filtered and used at 2µM (8µl in 40ml appropriate tissue culture media).
2.1.1.5 Cell and tissue culture media
JAr cell line media
RPMI-1640 medium (Sigma) supplemented with 10% heat-inactivated foetal calf serum (Sigma), 2 mg/ml glucose, 1 mM sodium pyruvate, 2 mM L-glutamine, 10 mM HEPES and 1% (v/v) 100x penicillin/streptomycin (equates to a final concentration of 100 units penicillin/100 µg streptomycin (Sigma-Aldrich; Cat. No. P0781).
SH-SY5Y cell line media
1:1 solution of Eagle's minimal essential medium (EMEM) media and nutrient mixture F12 HAM media supplemented with 10% (v/v) heat-inactivated foetal bovine serum (Sigma), 1% of L-Glutamine 2mM, 1% of Sodium Pyruvate 1mM and 1% penicillin 100 units/ml / streptomycin 0.1 mg/ml (Sigma).
HCT-116 cell line media
Dulbecco's Modified Eagle's medium (DMEM), (Sigma Cat No. 5546) supplemented with 2mM Glutamine and 10% Foetal Bovine Serum (Sigma Cat. No. F3018) 1% penicillin 100 units/ml / streptomycin 0.1 mg/ml (Sigma).
HCT-116 selection media
HEK-293 cell line media
Dulbecco’s minimum essential media (DMEM) F12, supplemented with
10% foetal bovine serum, 1% l-glutamine [200 mM], 1% sodium pyruvate [100 mM], and 1% penicillin [10,000 u/mL]/streptomycin [10 µg/mL].
2.1.1.6Plasmids
2.2
Methods
2.2.1 General cloning methods
2.2.1.1PCR primer design
Primers were designed with the aid of primer design programme; primer3
http://biotools.umassmed.edu/bioapps/primer3_www.cgi, secondary structure and primer dimer formation were prevented with the aid of integrated DNA technologies (IDT), oligonucleotide analysis software; oligoanalizer
http://www.idtdna.com/analyzer/Applications/OligoAnalyzer/. Primers were generally designed between 20-25 bp in length, with a melting temperature of 50-65°C and GC content between 40-60%.
2.2.1.2 Standard PCR
2.2.1.3 PCR purification
To purify double-stranded DNA fragments post PCR (Section 2.2.1.2), restriction enzyme digestion (Section 2.2.6) and ChIP (Section 2.6) for accurate quantification or downstream reactions such as Gibson Isothermal Assembly, Wizard® SV Gel and PCR Clean-Up System was used following manufacturer’s instructions. Briefly; equal volume of membrane binding solution was added to the PCR amplification, an SV minicolumn was inserted into the collection tube, to which the prepared PCR product was added, incubated at room temperature for 1 minute, and centrifuged at 16,000 × g for 1 minute. The flow through was discarded and the minicolumn reinserted into collection tube, which was washed by adding 700μl of membrane wash solution and centrifuged at 16,000 × g for 1 minute.
2.2.1.4 Analysis of DNA using agarose gel-electrophoresis
2.2.1.5 Recovery of DNA from agarose-gels
PCR products and restriction digestion fragments were isolated by running the PCR reaction or the restriction digest on agarose gels. The bands which corresponded to products of the predicted size were excised from the agrose gel under long wave UV translumination using a clean blade. The DNA was recovered from the gel slice using the Wizard SV Gel and PCR Clean-Up System, following manufacturer’s instructions. Briefly; the gel slice was placed in a 1.5ml
microcentrifuge tube, 10μl Membrane Binding Solution was added per 10mg of gel slice and vortexed and incubated at 50–65°C until the gel slice completely dissolved. Once dissolved an SV Minicolumn was inserted into the Collection Tube, to which the gel mixture was added. This was incubated at room temperature for 1 minute, and centrifuged at 16,000 × g for 1 minute, the flow through was discarded and the Minicolumn reinserted into Collection Tube. The Collection Tube was washed by adding 700μl of Membrane Wash Solution and centrifuged at 16,000 × g for 1
minute. The flow through was discarded and Minicolumn reinserted into the Collection Tube, this wash step was then repeated with 500μl Membrane Wash
2.2.2 Gibson Isothermal Assembly
2.2.2.1. Gibson Isothermal Assembly design
Gibson Isothermal Assembly is a high-efficiency DNA end-linking technique using three enzymes to join two or more sequences of blunt ended or 3’
overhang dsDNA in a single 1hour reaction. The technique was used to construct recombinant rAAV vectors, a detailed description of the biochemistry and approach is given in chapter 4.3.2.2.
2.2.2.2 Removal of 3’ overhangs – T4 DNA polymerase treatment
When assembling DNA fragments linearized by or isolated from vectors using restriction enzymes which leave a 3’ overhang, the ends were blunted using T4 DNA polymerase. DNA was dissolved in 1x NEBuffer supplemented with 100 μM of each dNTP, 1 unit of T4 DNA Polymerase per microgram of DNA was added and then Incubated for 15 minutes at 12°C, The reaction was stopped by adding EDTA to a final concentration of 10 mM and heating for 20 minutes at 75°C.
2.2.2.3. Gibson Isothermal Assembly reaction
2.2.3 Clustered Regularly Interspaced Short Palindromic Repeats - CRISPR associated system (CRISPR-Cas) specific cloning methods.
2.2.3.1Annealing oligonucleotides
In order to anneal the sense and anti-sense single stranded oligonucleotides which become the guide RNA (gRNA) 5 µl of each oligonucleotides (1 µg/µl) were added to 85 µl of nuclease free H2O and 5 µl of ligase buffer NEB, heated at 95 °C for 5 minutes and allowed to cool to room temperature (~60 min).
2.2.3.2 Golden Gate cloning
Golden Gate cloning was used as strategy to insert gRNA (annealed oligos) into the pGUIDE vector (a kind gift from Dr Patrick Harrison; University College Cork) rather than gel purifying the backbone. 150ng of pGUIDE plasmid was mixed with 150ng CRISPR gRNA oligos (annealed in Section 2.2.3.1), 1 μl BseRI (NEB), 1μl T4 ligase (Promega), 2 μl ligase buffer (Promega) and dH2O to a total volume of
2.2.3.3Transformation of chemically competent E. Coli cells DH5α™
Once the generation of recombinant plasmid DNA was confirmed by enzymatic digest (Section 2.2.5) and sequencing (Section 2.2.6), plasmids were transformed into strains of competent E. coli cells (DH5α™, InvitrogenTM Cat No.18265-017). Briefly, 50μl aliquot of competent cells was defrosted on ice, the ligation reaction (10µl) or 10ng of plasmid DNA were added to the defrosted cells and subsequently incubated on ice for 30 minutes. The cells were subjected to heatshock in a water bath for 45 seconds at 42°C and then incubated on ice for 2 minutes. 950 µl of pre-warmed LB broth was added to the cells, and the culture incubated at 37 °C for 1 hour on a shaker at 225 rpm. 50-200 µl of this culture was spread onto LB agar plates supplemented with 100 g/ml ampicillin, and grown at
2.2.4 Isolation of DNA constructs from bacteria
2.2.4.1 Mini-preparation of plasmid DNA
A small scale preparation of plasmid DNA, for up to 20 μg, was used for
screening plasmids after manipulation for molecular cloning. The QIAprep Spin Miniprep Kit (Qiagen, Cat No. 27106) was used for this purpose. This kit uses a modified alkaline lysis method, and the lysate is neutralised and adjusted to high salt binding conditions. The neutralised lysate is cleared by centrifugation, before being applied to a silica-gel membrane which selectively absorbs DNA in high-salt conditions. Endonucleases are removed by a wash with buffer PB, and salts are removed by a wash with buffer PE (both part of the kit). The plasmid DNA was eluted in nuclease-free water.
2.2.4.2Maxi-preparation of plasmid DNA
For the isolation of up to 500 μg of plasmid DNA the QIAGEN Plasmid
2.2.5 Analytical restriction enzyme digests
Restriction enzymes were used for molecular cloning and to verify the insertion and position of DNA fragments into plasmid vectors. Restriction enzyme (~5 unit/1 µg DNA) digests were carried out in 1x restriction enzyme buffer. The digests were carried out at the appropriate temperature for the respective enzyme for a minimum time of 1 hour. DNA double digestion sequentially using two restriction endonuclease enzymes was performed when the two enzymes buffer salt concentration were not compatible, in such cases the initial reaction was performed using the enzyme that functioned in a low salt buffer, followed by digestion with the second enzyme that function in the high salt buffer. The second digest was set up adjusted to the volume of the first reaction. Enzymes were obtained from Promega and NEB. The fragments generated by restriction enzyme reaction were visualized after gel electrophoresis in a UV light translluminator.
2.2.6 Sequencing
2.2.7 Measurement of nucleic acid concentration by spectrophotometry
2.2.8 Cell and tissue culture
2.2.8.1Culture of JAr (human placental chorocarcinoma) cells
JAr cells (ATCC HTB-144; American Type Culture Collection, Manassas,VA) were maintained as monolayers in supplemented RPMI-1640 medium (Sigma) (Section 2.1.1.5). Sub-confluent cultures were split at (70-80%) 1:3 to 1:10 i.e. seeding at 1-3x10,000 cells/cm2 using 0.25% trypsin or trypsin/EDTA; 5% CO2; 37°C.
2.2.8.2Culture of SH-SY5Y (human derived neuroblastoma) cells
SH-SY5Y cells were maintained as monolayers in 1:1 solution of Dulbecco’s EMEM media and nutrient mixture F12 HAM (Section 2.1.1.5) Sub-confluent cultures were split at (70-80%) 1:3 to 1:10 i.e. seeding at 1-3x10,000 cells/cm2 using 0.25% trypsin or trypsin/EDTA; 5% CO2; 37°C.
2.2.8.3Culture of HEK-293 (Human embryonic kidney ) cells
HEK-293 cells, were maintained in monolayers in DMEM, (Section 2.1.1.5) Sub-confluent cultures were split at (70-80%) 1:3 to 1:10 i.e. seeding at 1-3x10,000 cells/cm2 using 0.25% trypsin or trypsin/EDTA; 5% CO2; 37°C.
2.2.8.4Culture of HCT-116 (human colorectal carcinoma) cells
2.2.8.5Lithium, cocaine and sodium valproate cell treatments
Cells were incubated in appropriate medium (see Section 2.1.1.5) for 24 hrs and supplemented with either 1 mM lithium chloride, 2µM sodium valproate or 10 µM cocaine (described in Section 2.1.1.4) for 1hr. Following treatment the cells were harvested. Lithium, cocaine and sodium valproate treated cells were subsequently used in, standard PCR, chromatin immunoprecipitation (ChIP) and methylation (MethylQuest) assays.
2.2.9 Co-transfection of rAAV and CRISPR-Cas plasmids.
2.2.9.1Lipofectamine LTX transfection (rAAV)
2.2.9.2TurboFect transfection (CRISPR-Cas)
The TurboFect transfection reagent (Thermo scientific) was used for transfection of CRISPR plasmids pGUIDE and Cas9-WT DNA into SH-SY5Y cells. The TurboFect transfection reagent is comprised of a proprietary cationic polymer in water, the polymer forms positively-charged, complexes with DNA, these complexes are compact and stable thus protecting the DNA from degradation and facilitate efficient plasmid delivery into eukaryotic cells.
24 hrs prior to transfection, 3x10⁵ cells were seeded into 12-well plates in 400 μl of growth medium to give a confluency of 70-90% at the time of transfection.
Equal molar concentrations of pGUIDE and Cas9-WT (3μg) plasmid DNA was diluted in 20 μl of serum-free DMEM. TurboFect reagent was briefly vortexed and 12μl was added to the diluted DNA, this was then mixed immediately by vortexing,
2.2.10 mRNA analysis
2.2.10.1 Extraction of total RNA from JAr, SH-SY5Y and HCT-116 cells.
Total RNA was extracted from cells grown in 6-well culture plates to 70-80% confluency. Cell media was removed, followed by two washes with 1x PBS, the cells were lysed directly by adding 1 ml of TRIzol reagent (Invitrogen), transferred to a 1.5 ml microcentrifuge tube and incubated for 5 minutes at 15-30 °C to permit the complete dissociation of nucleoprotein complexes. DNA and protein were removed through phase separation by adding 200 μl of chloroform solution;
samples were mixed by inversion for 15 seconds and incubated for 2-3 minutes at 21 °C. Samples were then centrifuged at 12,000x g for 15 minutes at 4 °C. Following centrifugation the mixture separated into lower red, phenol-chloroform phase, an interphase, and a colourless upper aqueous phase. The RNA containing aqueous phase was transferred to a sterile-RNase free microcentrifuge tube containing 500 μl 100% isopropanol and incubated for 10 minutes at 21°C. The total RNA was precipitated by centrifugation at 12,000 x g for 10 minutes at 4°C. Total RNA pellet was washed with 75% ethanol, and centrifuged again at 7,500x g for 5 minutes at 4°C. The RNA pellet was then left to dry for 15 minutes at room temperature to allow evaporation of residual ethanol. To dissolve the RNA, the pellet was resuspended in 20 μl of RNase free water and incubated for 10 minutes at
2.2.10.2 DNase digestion of total RNA extraction
Harvested total RNA was digested with RQ1 RNase-free DNase (Promega), in order to ensure that all DNA contaminants were removed. 1 μg of total RNA was digested with 1 μl (1unit) RQ1 RNase-free DNase in a 10 μl volume reaction containing 1 μl of RQ1 10x buffer (Promega). The reaction was performed at 37 ˚C for 30 minutes. 1 μl of Stop-solution (Promega) was added, and the enzyme was inactivated at 65 ˚C for 10 minutes. Successful removal of DNA was determined by
visualisation of RNA and DNase treated RNA on a 1% agarose gel in electrophoresis. The RNA concentration was determined with NanoDrop™ 8000
Spectrophotometer (Section 2.2.7)
2.2.10.3 cDNA synthesis
Promega’s Reverse Transcription System (Cat. No. A3500) was used for the reverse transcription step following manufacturer’s instructions. Briefly 1μg of
DNase treated RNA was used as template in each RT- PCR reaction. Standard reverse transcription (RT) reaction:
MgCl2, 25mM 4 μl
Reverse Transcription 10x Buffer 2 μl
dNTP Mixture, 10 mM 2 μl
Recombinant RNasin Ribonuclease Inhibitor 0.5 μl AMV Reverse Transcriptase 15u
Random Primers 0.5 μg
Total RNA 1 μg
In order to achieve first strand cDNA synthesis the reverse transcription reaction mix was incubated at room temperature for 10 minutes, followed by 15 minutes at 42 ˚C, then 95˚C for 5 minutes and rapidly cooled to 4 ˚C for 5 minutes.
As a negative control the reaction was carried out with dH2O alone in the absence of RNA. The cDNA concentration was determined using the NanoDrop™ 8000