Manuscript Template
FRONT MATTER
Title
• Identification of different oxygen species in oxide nanostructures with 17O solid-state NMR spectroscopy
• Identifying oxygen ions in nano-oxides
Authors
Meng Wang1, Xin-Ping Wu2, Sujuan Zheng1, Li Zhao1, Lei Li1, Li Shen1, Yuxian Gao3, Nianhua
Xue1, Xuefeng Guo1, Weixin Huang3, Zhehong Gan4, Frédéric Blanc5,6, Zhiwu Yu7, Xiaokang
Ke1, Weiping Ding1,Xue-Qing Gong2*, Clare P. Grey5,8* and Luming Peng1*
Affiliations
1 Key Laboratory of Mesoscopic Chemistry of Ministry of Education, School of Chemistry and
Chemical Engineering, Nanjing University, Nanjing 210093, China.
2 Key Laboratory for Advanced Materials, Centre for Computational Chemistry and Research
Institute of Industrial Catalysis, East China University of Science and Technology, 130 Meilong
Road, Shanghai 200237, China.
3 Department of Chemical Physics, University of Science and Technology of China, Hefei
230026, China.
4 National High Magnetic Field Laboratory, 1800 E. Paul Dirac Drive, Tallahassee, FL, 32310–
5 Department of Chemistry, University of Cambridge, Lensfield Road, Cambridge, CB2 1EW,
UK.
6 Department of Chemistry and Stephenson Institute for Renewable Energy, University of
Liverpool, Crown Street, L69 7ZD, UK.
7 High Magnetic Field Laboratory, Chinese Academy of Sciences, Hefei 230031, China.
8 Department of Chemistry, Stony Brook University, Stony Brook, NY 11974-3400, USA.
Corresponding author. Emails: [email protected] (L.P.); [email protected] (X.-Q.G.) and
[email protected] (C.P.G.)
Abstract
Nanostructured oxides find multiple uses in a diverse range of applications including
catalysis, energy storage and environmental management, their higher surface areas and, in some
cases, electronic properties, resulting in different physical properties from their bulk
counterparts. Developing structure-property relations for these materials requires a determination
of surface and subsurface structure. Although microscopy plays a critical role, owing to the fact
that the volumes sampled by such techniques may not be representative of the whole sample,
complementary characterization methods are urgently required. Here we develop a simple NMR
strategy to detect the first few layers of a nanomaterial, demonstrating the approach with
technologically relevant ceria nanoparticles. We show that the 17O resonances arising from the 1st
to 3rd surface layer oxygen ions, hydroxyl sites and oxygen species near vacancies can be
distinguished from the oxygen ions in the bulk, higher frequency 17O chemical shifts being
observed for the lower coordinated surface sites. H217O can be used to selectively enrich surface
sites, allowing these and only these particular active sites monitored in a chemical process. 17O
interconvert at elevated temperature. DFT calculations confirm the assignments and reveal a
strong dependence of chemical shift on the nature of the surface. The results presented here
opens up new strategies for characterizing nanostructured oxides and their applications.
MAINTEXT
Introduction
As the only nuclear magnetic resonance (NMR) active oxygen stable isotope, 17O NMR
spectra have been collected for a large range of metal oxides(1-3) and reveal that 17O is extremely
sensitive to the local environment of the oxygen resulting in a very large chemical shift range
larger than 1,000 ppm(4). However, only a few reports have been published on nanosized
oxides(5, 6), despite their use in numerous applications(7, 8). This is largely a result of the high cost
of 17O enrichment, generally necessary due to the low natural abundance of 17O (0.037%), and
the difficulties associated with efficient isotopic enrichment of the nanomaterials, (for example,
heat treatment in 17O enriched O2 gas, a common method for 17O enrichment, generally leads to
particle sintering). However, the low natural abundance of the bulk also brings new possibilities
for selective labelling and detection of specific sites.
NMR spectroscopy, which is sensitive to the short-range order of all the resonant nuclei in
the sample investigated, should be ideal to study nanomaterials, where the long-range order is
usually interrupted by the surface and other defect sites. At the same time, as one of the most
extensively studied nano-oxides, ceria nanostructures, have been studied for use in a wide range
of applications from solid oxide fuel cell(9) and catalysis(10) (in, for example, catalytic
approach with this nanomaterial. In addition to the finding that different oxygen species (oxygen
ions in different layers and different surfaces), can be distinguished in 17O NMR, we discover
that hydroxyl groups can form through water dissociation on ceria nanoparticles and this process
can be exploited to produce an efficient and selective 17O labelling method for the surface of
nanosized oxides.
Results
Ceria nanoparticles were prepared hydrothermally(13) and their structures were confirmed by
X-ray diffraction (XRD; Fig. S1A). Broader peak were observed in the XRD patterns consistent
with the small particle sizes (~3 nm), as indicated by the TEM images (Fig. S1B). Although the
ceria nanoparticles exhibit mostly rounded shaped or polyhedral morphologies, according to
previous experimental observations (14) as well as theoretical calculations (15), the surfaces are
dominated by the thermodynamically most stable (111) face (Fig. S1B).
17O enrichment was conducted by heating the ~3 nm nanoparticles in a 17O
2 gas atmosphere
at different temperatures. The mean diameters, calculated based on the XRD data by using the
Debye-Scherrer equation, increase with increasing enrichment temperature (Fig. S2 and Table
S1) from approximately 4 to 42 nm following calcination at 523 and 1073 K, respectively. The
results are consistent with BET surface area data (Table S2), which show a drop in surface area
from 190 to 6 m2·g-1 over the same temperature range.
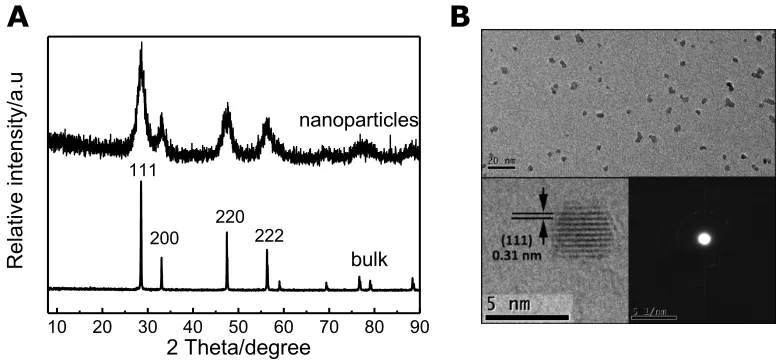
The 17O magic angle spinning (MAS) NMR spectra of the ceria nanoparticles are compared
with the “bulk” ceria, i.e., micron-sized Ce17O2 particles (commercial reagent CeO2 obtained
Fig. 1A. Bulk ceria contains one sharp resonance at 877 ppm corresponding to the 4-coordinated
oxygen ion (OCe4) site, consistent with previous studies.(16) The resonances are much broader for
the nanoparticles and three additional peaks at approximately 1040, 920 and 825 ppm are
observed. The positions of these resonances do not change in spectra acquired with different
external magnetic fields (14.1 vs. 9.4 T), indicating that these peaks arise from species with
small quadrupolar coupling constants (CQs). The intensities of the three new peaks decrease
(relative to the resonance at 877 ppm) with increasing particle sizes, suggesting that these species
are related to surface and sub-surface sites or other defect sites (e.g., sites nearby oxygen
vacancies)(17). The width of these peaks must reflect the large distribution of chemical shifts for
the different surface and sub-surface environments, as well as relatively wide size distribution of
the nanosized sample (Fig. S1). The longitudinal relaxation times (T1)associated with the new
peaks are shorter than that of the bulk environment again implying these sites may be nearby
defects (Fig. S4).
First-principles density function theory (DFT) calculations were performed to aid the
spectral assignments. The CeO2(111) surface was considered initially (on the basis of the TEM
results), and a slab model composed of 6 layers of cerium and 12 layers of oxygen ions (6 CeO2
tri-layers) was constructed for the calculations (Fig. 1B), where the oxygen ions at the same layer
have the same local bonding environments and thus have the same chemical shift (δiso), CQ and
asymmetry parameter (ηQ) within each layer. The oxygen ions in the centre layers (4th to 9th
layer) have similar calculated chemical shifts of ~880 ppm (Fig. 1B), which are close to the
experimental chemical shift of oxygen ions in bulk ceria (877 ppm, Fig. 1A)(16). For the top and
bottom 3 layers, however, very different chemical shifts at approximately 1033, 921 and 837
ppm (with small CQ values smaller than 0.14 MHz, Table S3), were calculated for oxygen ions at
close to those of the three additional peaks observed in NMR spectra of the ceria nanoparticles.
On this basis, the peaks at 1040, 920 and 825 ppm (Fig. 1A) can be tentatively assigned to the
oxygen ions at the outmost 1st, 2nd and 3rd layers of the particles, respectively. Previously, the
dependence of chemical shift on the atomic position with respect to the surface was predicted
and observed experimentally only in 77Se NMR of ZnSe nanoparticles, however, the peaks
owing to different layers were not clearly resolved(18). The assignment of the peak at 1040 ppm
to the 1st layer (3-coordinated) oxygen (on the (111) surface) is in agreement with the trend that
the oxygen chemical shift moves to higher frequency as the coordination number decreases in
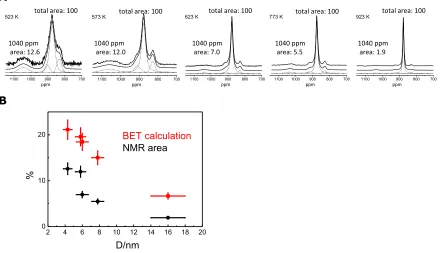
simple metal oxides(3). The fractions of 1st layer oxygen ions (extracted by using spectral
deconvolution) is in accordance with the predictions from BET measurements (Fig. S5). The
quadrupolar coupling constants of these oxygen ions predicted from DFT calculations are also
small (Table S3, νQ smaller than the radio frequency field amplitude ν1 of 62.5 kHz).
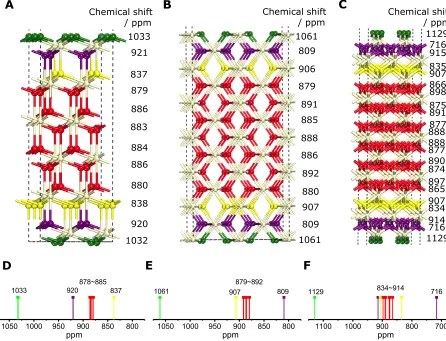
Calculations were also performed for other low index surfaces, such as the (110) and (100)
surfaces (Fig. S6), which may also be present in the nanoparticles. In all the surfaces explored,
the oxygen ions on the first layer have lower coordination numbers and give rise to shifts at
higher frequencies (>1,000 ppm), which is again in agreement with the trend that the oxygen
chemical shift appears at a higher frequency with less coordination numbers in simple metal
oxides(3). The shift calculated for the (110) surface sites is 1061 ppm, somewhat similar to the
value for (111) surface. Very different shifts of around 1129 ppm were, however, calculated for
the (100) surface sites, the higher frequency shift arising from the lower O coordination numbers
(2-coordinated sites, as compared to 3-coordinated sites for the (111) and (110) surfaces). The
lack of a resonance in this chemical shift range in our experimental spectra (Fig. 1A) is in
agreement with reports that this is the least energetically favourable low-index surface(15). The
surfaces (i.e., 1129 and 1033 ppm), as well as our experimental observations that match well
with calculations of (111) facets, suggest that the 17O NMR shift may be able to probe the
coordination numbers of the oxygen atoms and the exposed surface planes of nanocrystals,
which can be extremely important for their applications(19).
To provide additional support for the spectral assignments and to explore the surface
structure and chemistry of ceria nanoparticles, natural abundance water was adsorbed on the 17
O-enriched ceria samples. The major 17O resonance at 877 ppm from to OCe4 (bulk ceria) remains
in the NMR spectra of these samples (Fig. 2A) since the oxygen ions in the bulk are not expected
to be affected by surface adsorbates. The resonances at around 1040, 920 and 825 ppm, however,
disappear and a new broad shoulder at approximately 850 ppm can be observed. The shift of this
resonance remains unchanged in the spectrum acquired at an ultrahigh field of 19.4 T, indicating
the resonance is associated with a small CQ (Fig. S7, Fig. S8A and Table S4). In addition,
another broad peak is observed at much lower frequency (32 ppm). This peak disappears after
the sample is dried under vacuum at room temperature, suggesting that this resonance can be
assigned to water adsorbed on the surface of ceria. After thermal treatment of the sample at 573
K, the broad peak at 850 ppm disappears and the peaks at 1040, 920 and 825 ppm can be
observed again, the spectrum resembles that of the original bare ceria nanoparticles; this
indicates that the structure of the ceria nanoparticles is recovered at elevated temperature when
water is completely removed. The resonance at 850 ppm is ascribed to the oxygen ions in the 3rd
layer (these environments resonating at 825 ppm in the dry sample), in agreement with DFT
calculations (Fig. S8 and Table S5). The resonances from the oxygen ions on the 1st and 2nd layer
are not observed when water is adsorbed, presumably because of fast exchange between these
Interactions between ceria nanoparticles and water were also investigated in a reverse way,
via the adsorption of 17O enriched water on non-enriched ceria nanoparticles (preheated at 573
K). On adding H217O dropwise to ceria nanoparticles at room temperature, weak peaks at
approximately 1040, 877 and 270 ppm appeared (Fig. 2B) in addition to the broad peak at around
32 ppm from adsorbed water. These peaks dominated the spectra after the sample was dried
under vacuum at 373 K. Similar spectra were obtained by introducing H217O to non-enriched
ceria nanoparticles calcined at 573 K on a vacuum line (Fig. 2B). The broad resonance at 270
ppm can be tentatively assigned to the hydroxyl groups (Ce4+-17OH) observed previously by
FT-IR(20) on the surface of ceria nanoparticles on the basis of the low chemical shift. 17O-1H double
resonance NMR techniques (in this case, Cross Polarization (CP)(21) and Rotational Echo Double
Resonance (REDOR)(22)) were used to confirm this assignment since they can be used to select
the 17O resonances of oxygen ions close to protons: they measure the heteronuclear dipolar
coupling (i.e., between 17O and 1H), a function of distance between 17O and 1H. As seen from
Fig. 3A, both the REDOR difference spectrum and CP spectra only show one signal at 270 ppm,
confirming that this resonance comes from oxygen ions in close proximity to proton. The NMR
parameters of this species, including chemical shift (δiso) and quadrupolar product (PQ =
CQ(1+ηQ2/3)1/2), were extracted by calculating the frequency change of the centre of gravity of
the signal at different external fields (300 ppm at 14.1 T vs. 270 ppm at 9.4 T). The obtained
values (δiso = 325 ppm, PQ = 5.1 MHz) are also supported by the DFT calculation results (Fig. S8
and Table S5). It is clear that the surface hydroxyl groups are associated with much larger CQ
than the less coordinated surface oxygen species and this is in agreement with the nutation curve
(Fig. S9). The CP build-up curve (Fig. 3B) shows that with a short contact time (<100 µs), the
CP intensity increases rapidly and reaches a maximum at around 90-100 µs. With longer contact
Brønsted acid sites in acidic zeolites(23), as well as hydroxyl oxygen species in layered double
hydroxides(24), indicating that this O species is directly bound to H. 1H-17O TRAPDOR NMR
was also used to investigate the 1H-17O dipolar coupling on the surface of ceria nanoparticles
(Fig. S10). Significant TRAPDOR fraction can be observed at a rather short 17O irradiation time
of about 100 µs and this value reaches maximum at around 140 µs, very similar to the
observation in acidic zeolite HY(23), and again this result suggests that H is directly connected to
O. Furthermore, the maximum TRAPDOR effect of ~23 % shows the 17O isotopic molar
percentage among the surface hydroxyl groups, indicating highly efficient 17O isotopic labelling
of the surface of ceria nanoparticles.
The domination of the surface species (i.e., the lower coordinated oxygen ions at ~1040 and
hydroxyl groups at ~270 ppm) in the spectra of natural abundance ceria nanoparticles adsorbed
with 17O water, indicates that we can use this approach to as an efficient and surface-selective
isotopic enrichment method. To demonstrate this, we use this method to confirm our proposal
that the resonances at 1040 and 920 ppm are owing to surface and subsurface oxygen sites,
specifically those on the (111) surface. To achieve this, we selectively enriched the surfaces of
ceria nanorods with H217O at room temperature, since these are dominated by distinct (111)
facets (Fig. S11A). Ceria nanorods were also non-selectively enriched in a 17O2 atmosphere at
923 K for comparison. Four sharp resonances at 1027, 920, 877 and 825 ppm are seen for the
sample enriched in 17O2, while the peak at 877 ppm owing to bulk oxygen species dominates
(Fig. S11B). For nanorods enriched with H217O, however, the majority of the signal comes from
two sharp resonances 1027 and 920 ppm (Fig. S11C), confirming our assignment of these
resonances to the (111) surface and subsurface sites, respectively. A broad peak with maximum
intensity at 270 ppm arising from OH can also be observed in the surface labelled sample. The
disorder is present. This approach shows that selectively labelling(25), which should be based on
water adsorbing/dissociation, can be now controlled to the first a few layers of surface sites for
oxide nanostructures.
The fact that significant surface 17O species were observed only on ceria nanoparticles but
not on bulk ceria by adsorbing H217O (Fig. 2B), implies that water dissociation readily occurs
only at the surface of the more active ceria nanoparticles. Calculations show that the oxygen
vacancy formation energies at the outmost 1st and 2nd layers are substantially smaller than that of
the 3rd to 6th layers (Fig. S12), suggesting that there are more oxygen vacancies on the 1st and 2nd
layers of ceria. Therefore, water dissociation on ceria nanoparticles is more likely to be the
results of water interacting with oxygen vacancies. These observations also agree with the
presence of the adsorbed water peak at ~ 32 ppm when adsorbing non-enriched water on 17O
enriched nanosized ceria. Adsorption of water on nanosized ceria proves effective for ceria
nanoparticles with a diameter as large as 16 nm (Fig. S13). The relative intensity of the peak at
around 270 ppm assigned to the hydroxyl groups decreases with increasing pre-heating
temperature, compared to the peaks at approximately 1040 and 920 ppm arising from 1st and 2nd
layer surface oxygen ions, suggesting that the concentration of oxygen vacancies on the surface
of the ceria nanoparticles decreases with increasing particle size.
With all the signals being assigned, the evolution of different species on the ceria
nanoparticles during thermal treatment was then examined (Fig. 4). At 373 K, the intensities of
the peaks from the surface oxygen species (1040 and 270 ppm) are much stronger than peak
arising from the oxygen ion in bulk ceria (877 ppm). With increasing temperature, the peaks
arising from surface become weaker while the intensity of the peak for bulk oxygen species
increases. The latter becomes the major resonance at the temperature above 573 K, indicating
oxygen ions in the bulk, presumably through oxygen migration via oxygen vacancies.
Nanoparticle sintering can be excluded as a source of the oxygen exchange process, at least at a
temperature lower than 573 K, since all of the samples were preheated at 573 K. Therefore, this
approach can be used to track the motion of oxygen ions in oxide nanostructures as a function of
temperature.
Oxygen vacancies and Ce3+ are often present as defects in CeO2-based materials, and their
concentrations are significant in nanoparticles(17, 26), which can be determined by X-ray
photoelectron spectroscopy (XPS)(27, 28) (Fig. S14 and S15). These species play an important role
in controlling the physical properties of this material for a variety of applications, such as
heterogeneous catalysis of redox reactions(29) and are thus investigated here with NMR. H2
temperature programmed reduction (TPR) experiments were first carried out on bulk ceria and
ceria nanoparticles to determine the temperature to generate Ce3+ and oxygen vacancy in H2
atmosphere (Fig. S16). For bulk ceria, a small and relatively narrow H2 consumption peak can be
observed at a temperature lower than 800 K, while a much broader and more intense peak
centred at 773 K is seen for ceria nanoparticles calcined at 773 K. These peaks can be ascribed to
reaction of H2 with surface oxygen of ceria(30). Again, the large peak width associated with the
nanoparticles can be ascribed to the wide size distribution of the nanosized sample (Fig. S1). The
consumption of H2 increase again at a temperature above 1050 K, which should be associated
with the bulk oxygen species. Thus, the 17O NMR spectrum were collected for bulk ceria
enriched at 1073 K and then reduced in H2 atmosphere at 1073 K (Fig. 5A). A shoulder to lower
frequency of the OCe4 peak (877 ppm) and a more distinct lower frequency resonance at around
845 ppm with a full width at half maximum of 12 ppm can be observed. The lower frequency
components are tentatively assigned to oxygen ions nearby the oxygen vacancies or in the Ce3+
and then reduced at 773 K in H2 also contains a relatively broad resonance with a maximum
intensity at around 870 ppm and a broader shoulder at lower frequencies, different from the case
of the original nanoparticles (without reduction) or that obtained on re-oxidization in oxygen
environment (Fig. 5B). The resonance assigned to surface 3-coordinated oxygen ions disappears
after reduction. Careful examination of these spectra (inset of Fig. 5B) shows that a broader
component is present underneath the resonances of the reduced materials. Fermi Contact
(hyperfine) 17O shifts of more than 728 ppm have been observed for oxygen atoms directly
bound to the paramagnetic Ce3+ ion and similarly large contact shifts are expected in this
system.(31) We ascribe the broad component to oxygen ions in the first coordination cell of one or
more Ce3+ ions, the broadening arising from the distribution in local environments and the
dipolar interactions between the unpaired electrons centred on Ce3+ and 17O.
We have also calculated the chemical shiftsof the environments generated by the presence
of the Ce3+ ions and oxygen vacancies and the observation of a sharper peak at a lower frequency
is supported by DFT calculations. Three models constructed to describe the reduced ceria were
considered: (i)CeO2 (2×2×2) unit cell with an oxygen vacancy, which represents the situation of
bulk oxygen vacancy; (ii)CeO2(111) with a sub-surface oxygen vacancy; and (iii)CeO2(111)
with a surface oxygen vacancy, both models (ii) and (iii) representing the situation of vacancies
near the surface. All the three models contain the two Ce3+ ions required to create one oxygen
vacancy. The structures of the three models are shown in Fig. S17A-C and the calculated
chemical shifts are summarized in Fig. S17D-F and Table S6-8. Generally, the calculated
chemical shifts for the oxygen ions 5 Å or less away from the oxygen vacancy in model (i) show
a slightly smaller chemical shift compared to the 877 ppm resonance in bulk CeO2; similar trends
are observed for oxygen ions close to a vacancy (i.e., in the same layer or the next layer to the
average chemical shift for the oxygen ions close to an oxygen vacancy is approximately 845 ppm
in the three different structural models. Note that we have not included the additional hyperfine
shifts that will result from the presence of the Ce3+ ions since these cannot be readily calculated
and so have only considered the environments that are not in the Ce3+ 1st shell.
Discussion
In conclusion, this paper describes a novel 17O NMR approach to study the surface and
defect sites of nanosized oxides. Since the oxygen ions on the surface of ceria nanoparticles (1st,
2nd and 3rd surface layers) show very distinct chemical shift compared to those in the bulk, 17O
NMR spectroscopy can be a sensitive probe to monitor the local structure of oxide nanocrystals.
Adsorbing water on ceria can be used to explicitly label oxygen ions in the very top surface
layers (1st and 2nd), the method being more controlled than simply heating the nanoparticles at
high temperatures. Thus the method allows for inexpensive 17O enrichment of the surface sites of
nanostructures, enabling the most active species to be identified and their fate in a chemical
reaction to be followed conveniently. Double resonance NMR techniques can be used to
distinguish hydroxyl groups from other surface sites. These methods provide a new strategy to
study the unique local structure and surface chemistry of nanostructured oxides, as well as their
performance in a wide range of applications. Moreover, we expect this approach can be used to
study the interfaces between oxides and other materials, and illuminate important issues such as
the nature of the interactions between the catalytic active species and the support oxides(32), and
the differences in anionic conductivity that are often seen at the interface between two oxides(33).
Although the new approach presented allows the detection of the evolution of oxygen
species in a chemical process, the exchange of oxygen ions (e.g., the process shown in Fig. 4)
may limit its applications in monitoring the behaviours of oxygen ions in reactions at elevated
Materials and Methods
Study Design.
The sizes of ceria nanoparticles were determined with the XRD data by using
Debye-Scherrer equation, which were in general agreement with the surface area measurements. There
is no rule for stopping NMR data collection in advance and data acquisition was stopped when
enough signal/noise ratio was achieved. Each experimental measurement (sample preparations
and NMR experiments) was repeated at least once to ensure that the results can be replicated.
Materials preparation.
Preparations of ceria nanoparticles. (NH4)2Ce(NO3)6 (1.645 g, 3 mmol, Sinopharm
Chemical Reagent Co., Ltd) was dissolved in distilled water (50 mL) and the mixture was stirred
magnetically for 10 min to obtain a good homogeneity. The solution was then transferred into an
80 mL autoclave, and heated at 393 K under autogenous pressure for 10 h before it was allowed
to cool down to room temperature. The resulting light-yellow precipitates were washed with
distilled water and anhydrous enthanol 4 times, and then dried at 353 K for 12 h.
Preparations of ceria nanorods. The synthesis of CeO2 nanorods followed the procedure of
Mai et al(34). In a typical preparation procedure, 1.96 g Ce(NO3)3·6H2O was dissolved in 40 mL
ultrapure water (resistance>18 MW), and 16.88 g NaOH was dissolved in 30 mL ultrapure water.
The NaOH solution was added dropwise into the Ce(NO3)3 solution under magnetic stirring at
room temperature (RT). The solution was stirred for an additional 30 min at RT and then
transferred into a 100 mL Teflon bottle, which was tightly sealed and hydrothermally treated in
an autoclave at 373 K for 24 h before cooling to RT. The resulting white precipitate was
collected, washed with ultrapure water, and dried under vacuum at 353 K for 16 h. After that, the
17O enrichment procedures.
Bulk ceria (typically 200 mg, Sinopharm Chemical Reagent Co., Ltd) and nanosized ceria
(typically 200 mg) were first heated at 573 K for 10 h (except the ceria nanoparticles which were
later enriched at 523 K, this particular sample was heated at 523 K) and then enriched by heating
the powders in an 70 % 17O enriched O2 gas (Cambridge Isotope Laboratories) atmosphere at
various temperatures (523 ~ 1073 K) for 10 h (for “bulk” ceria sample, 17O enrichment was
performed at 1073 K for 10 h). Ceria nanoparticles were also enriched via the introduction of a
small amount of 70 % 17O enriched H
2O (Cambridge Isotope Laboratories) by first adding water
dropwise or introducing water using a vacuum line at room temperature then exposing the
samples to vacuum to remove additional water. For introducing water using a vacuum line, water
vapor (typically 0.1 mmol) was adsorbed onto ceria samples (typically 200 mg) at room
temperature for 5 min.
Hydrogen reduction.
Ceria samples (typically 200 mg) were reduced under hydrogen (1 bar) in a sealed quartz
tube at 773 K for 5 min before allowing them to cool to room temperature under vacuum.
Solid state NMR spectroscopy.
17O MAS NMR spectra were performed on 9.4 and 14.1 T Bruker Avance III spectrometers
using 1.3 mm HXY, 3.2 mm HXY, and 4 mm HXY MAS probes (in double resonance) tuned to
17O at 54.2 and 81.3 MHz, respectively. Ultrahigh field data were collected on a 19.6 T Bruker
DRX spectrometer using a 1.8 mm single channel probe tuned to 112.9 MHz. All the samples
were packed into the rotors in the N2 glove box unless otherwise stated. 17O chemical shift is
referenced to H2O at 0.0 ppm.
DFT calculations.
The spin-polarized calculations were carried out with the GGA-PBE functional using the
crystalline systems using the linear response method and electric field gradients (EFG) at the
positions of the atomic nuclei. The project-augmented wave method (PAW)(36) was used to
describe the electron-core interaction. The Ce (5s, 5p, 6s, 5d, 4f), O (2s, 2p) and H (1s) shells
were treated as valence electrons. We used a plane wave kinetic energy cutoff of 500 eV for
structure optimization, chemical shift and EFG calculations. All atoms were allowed to move
and the structural relaxing calculations were converged until the Hellman-Feynman forces on
each ion were less than 0.02 eV/Å. For chemical shift and EFG calculations, we used a typically
higher stopping-criterion of 10-8 eV for electronic minimization (Fig. S18A). Particularly, to
characterize the electronic and geometric structures of ceria properly, we added a Hubbard U of
5 eV suggested by Nolan and co-workers(37) in DFT calculations. Using the PBE+U method, we
obtained a lattice parameters of 5.448 Å for bulk ceria, which is in good agreement with the
experiment value (5.411 Å)(38). The {111}, {110} and {100} facets of CeO2 were modeled by
surface slabs which are thick enough to maintain trivial fluctuations of chemical shift values in
their middle layers, and they were all represented by p(2×2) lateral cells (Fig. S6A-C). For
CeO2(100), we removed half of the oxygen atoms from the outermost planes to offset the net
dipole and make it stable. To avoid interactions between slabs, they were separated by a vacuum
gap greater than 10 Å. The Brillouin-zone integration was performed using a 2×2×1 and 1×1×1
Monkhorst-Pack grid for surface slabs and the (2×2×2) bulk cell, respectively. The isotropic
chemical shift (
δ
iso) is defined as,δ
iso =δ
ref +mδ
calwhereδ
refis the reference chemical shift(Fig. S18B), m is a gradient assumed equal to -1, and
δ
calis the chemical shift value obtainedwithin VASP. The quadrupole coupling constant (CQ) was calculated as Q zz
eQV C
h
= where e is
the absolute value of the electron charge, Q is the element and isotope specific quadrupole
moment (the experimental value of Q=-0.02558 barns(39) is used for the 17O), Vii is the
A chemical shift calculation of clean CeO2(111) surface was performed without structure
relaxing (Fig. S18B). The results show that the chemical shifts of oxygen atoms at 5th~8th O
layers have a constant value of 825 ppm. Considering that the bulk oxygen ions have more
regular arrangements than the oxygen ions near the surfaces, thus this constant value can be used
to estimate the reference chemical shift value (δref). As a result, 52 ppm was taken as the δref (δref
= δiso(bulk) – m ×δcal(bulk) = 877 ppm – 1 × 825 ppm = 52 ppm).
Supplementary Materials
Materials and Methods
Fig. S1. XRD and electron microscopy characterization of ceria nanoparticles.
Fig. S2. The XRD patterns of ceria nanoparticles calcined at different temperature.
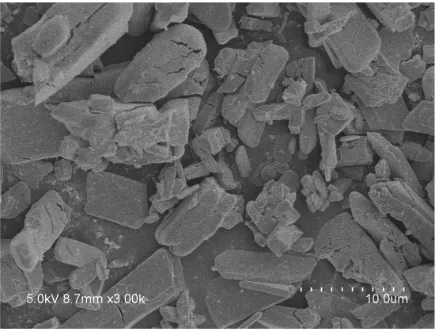
Fig. S3. The SEM image of the bulk ceria sample.
Fig. S4. Longitudinal relaxation studies of ceria nanoparticles.
Fig. S5. Quantification of surface oxygen ions from NMR and BET data.
Fig. S6. Chemical shift calculations of ceria with different surface slabs.
Fig. S7. Solid-state NMR of ceria nanoparticles in contact with water at ultrahigh field.
Fig. S8. DFT calculations for ceria in contact with water.
Fig. S9. Nutation NMR of ceria nanoparticles.
Fig. S10. TRAPDOR NMR of ceria nanoparticles.
Fig. S11. Electron microscopy and solid-state NMR spectra of ceria nanorods.
Fig. S12. Vacancy formation energies of different oxygen ions.
Fig. S13. Solid-state NMR spectra of ceria nanoparticles with different surface area labelled by
adsorbing H217O.
Fig. S14. Ce 3d3/2,5/2 XPS spectra collected for ceria nanoparticles, nanorods and bulk sample, as
Fig. S15. The molar percentage of Ce3+ as a function of particle size from XPS data.
Fig. S16. H2 temperature programmed reduction (TPR) profiles of bulk ceria and ceria
nanoparticles.
Fig. S17. The structure model and chemical shift calculations of ceria with oxygen vacancies.
Fig. S18. The criterion for NMR calculations and the determination of chemical shift.
Table S1. Mean diameter of ceria nanoparticles.
Table S2. BET surface area of ceria samples.
Table S3. Calculated NMR parameters of quadrupolar interaction for ceria.
Table S4. Calculated NMR parameters of quadrupolar interaction for ceria in contact with water.
Table S5. Calculated chemical shifts for ceria in contact with water.
Table S6. Calculated chemical shifts for ceria with oxygen vacancies in the bulk.
Table S7. Calculated chemical shifts for ceria with sub-surface oxygen vacancies.
Table S8. Calculated chemical shifts for ceria with surface oxygen vacancies.
Table S9. Detailed NMR parameters for acquiring 17O MAS NMR data in Fig. 1.
Table S10. Detailed NMR parameters for acquiring 17O NMR data in Fig. 2.
References and Notes
1. T. J. Bastow, S. N. Stuart, 17O NMR in simple oxides. Chem. Phys. 143, 459-467 (1990).
2. S. Yang, K. D. Park, E. Oldfield, Oxygen-17 labeling of oxides and zeolites. J. Am. Chem.
Soc. 111, 7278-7279 (1989).
3. K. J. D. MacKenzie, M. E. Smith, Multinuclear Solid-State Nuclear Magnetic Resonance of
Inorganic Materials. (ELSEVIER, Kidlington, Oxford, UK, 2002), vol. 6.
4. S. E. Ashbrook, M. E. Smith, Solid state 17O NMR-an introduction to the background
5. E. Scolan, C. Magnenet, D. Massiot, C. Sanchez, Surface and bulk characterisation of
titanium-oxo clusters and nanosized titania particles through 17O solid state NMR. J. Mater.
Chem. 9, 2467-2474 (1999).
6. A. V. Chadwick, I. J. F. Poplett, D. T. S. Maitland, M. E. Smith, Oxygen speciation in
nanophase MgO from solid-state 17O NMR. Chem. Mater. 10, 864-870 (1998).
7. P. G. Bruce, B. Scrosati, J.-M. Tarascon, Nanomaterials for Rechargeable Lithium Batteries.
Angew. Chem. Int. Ed. 47, 2930-2946 (2008).
8. A. T. Bell, The Impact of Nanoscience on Heterogeneous Catalysis. Science 299, 1688-1691
(2003).
9. P. Seungdoo, J. M. Vohs, Direct oxidation of hydrocarbons in a solid-oxide fuel cell. Nature
404, 265 (2000).
10. J. A. Rodriguez, S. Ma, P. Liu, J. Hrbek, J. Evans, M. Perez, Activity of CeOx and TiOx
nanoparticles grown on Au(111) in the water-gas shift reaction. Science 318, 1757-1760
(2007).
11. J. Kašpar, P. Fornasiero, M. Graziani, Use of CeO2-based oxides in the three-way catalysis.
Catal. Today 50, 285-298 (1999).
12. R. W. Tarnuzzer, J. Colon, S. Patil, S. Seal, Vacancy Engineered Ceria Nanostructures for
Protection from Radiation-Induced Cellular Damage. Nano Lett. 5, 2573-2577 (2005).
13. C. Tyrsted, K. M. Jensen, E. D. Bojesen, N. Lock, M. Christensen, S. J. Billinge, B.
Brummerstedt Iversen, Understanding the formation and evolution of ceria nanoparticles
under hydrothermal conditions. Angew. Chem. Int. Ed. 51, 9030-9033 (2012).
14. K. Zhou, X. Wang, X. Sun, Q. Peng, Y. Li, Enhanced catalytic activity of ceria nanorods
15. Y. Jiang, J. B. Adams, M. van Schilfgaarde, Density-functional calculation of CeO2 surfaces
and prediction of effects of oxygen partial pressure and temperature on stabilities. J. Chem.
Phys. 123, 064701 (2005).
16. N. Kim, J. F. Stebbins, Vacancy and cation distribution in yttria-doped ceria: An 89Y and 17O
MAS NMR study. Chem. Mater. 19, 5742-5747 (2007).
17. S. Tsunekawa, R. Sivamohan, S. Ito, A. Kasuya, T. Fukuda, Structural study on monosize
CeO2-X nano-particles. Nanostruct. Mater. 11, 141-147 (1999).
18. S. Cadars, B. J. Smith, J. D. Epping, S. Acharya, N. Belman, Y. Golan, B. F. Chmelka,
Atomic Positional Versus Electronic Order in Semiconducting ZnSe Nanoparticles. Phys.
Rev. Lett. 103, 136802 (2009).
19. X. Xie, Y. Li, Z. Q. Liu, M. Haruta, W. Shen, Low-temperature oxidation of CO catalysed by
Co3O4 nanorods. Nature 458, 746-749 (2009).
20. A. Badri, C. Binet, J.-C. Lavalley, An FTIR study of surface ceria hydroxy groups during a
redox process with H2. J. Chem. Soc., Faraday Trans. 92, 4669-4673 (1996).
21. A. Pines, M. G. Gibby, J. S. Waugh, Proton-enhanced NMR of dilute spins in solids. J.
Chem. Phys. 59, 569-590 (1973).
22. T. Gullion, J. Schaefer, Rotational-Echo, Double-Resonance NMR. J. Magn. Reson. 81,
196-200 (1989).
23. L. M. Peng, Y. Liu, N. J. Kim, J. E. Readman, C. P. Grey, Detection of Bronsted acid sites in
zeolite HY with high-field 17O-MAS-NMR techniques. Nature Mater. 4, 216-219 (2005).
24. L. Zhao, Z. Qi, F. Blanc, G. Yu, M. Wang, N. Xue, X. Ke, X. Guo, W. Ding, C. P. Grey, L.
Peng, Investigating Local Structure in Layered Double Hydroxides with 17O NMR
Spectroscopy. Adv. Funct. Mater. 24, 1696-1702 (2014).
25. N. Merle, J. Trebosc, A. Baudouin, I. D. Rosal, L. Maron, K. Szeto, M. Genelot, A.
into the structure of supported catalysts and their interaction with the silica carrier. J. Am.
Chem. Soc. 134, 9263-9275 (2012).
26. J. Spanier, R. Robinson, F. Zhang, S.-W. Chan, I. Herman, Size-dependent properties of
CeO2-y nanoparticles as studied by Raman scattering. Phys. Rev. B 64, 245407 (2001).
27. S. Deshpande, S. Patil, S. V. N. T. Kuchibhatla, S. Seal, Size dependency variation in lattice
parameter and valency states in nanocrystalline cerium oxide. Appl. Phys. Lett. 87, 133113
(2005).
28. J. Światowska, V. Lair, C. Pereira-Nabais, G. Cote, P. Marcus, A. Chagnes, XPS, XRD and
SEM characterization of a thin ceria layer deposited onto graphite electrode for application in
lithium-ion batteries. Appl. Surf. Sci. 257, 9110-9119 (2011).
29. T. Kayama, K. Yamazaki, H. Shinjoh, Nanostructured Ceria−Silver Synthesized in a One-Pot
Redox Reaction Catalyzes Carbon Oxidation. J. Am. Chem. Soc. 132, 13154-13155 (2010).
30. M. Boaro, M. Vicario, C. de Leitenburg, G. Dolcetti, A. Trovarelli, The use of
temperature-programmed and dynamic/transient methods in catalysis: characterization of ceria-based,
model three-way catalysts. Catal. Today 77, 407-417 (2003).
31. K. Djanashvili, C. Platas-Iglesias, J. A. Peters, The structure of the lanthanide aquo ions in
solution as studied by 17O NMR spectroscopy and DFT calculations. Dalton Trans. , 602-607
(2008).
32. J. A. Farmer, C. T. Campbell, Ceria maintains smaller metal catalyst particles by strong
metal-support bonding. Science 329, 933-936 (2010).
33. J. Garcia-Barriocanal, A. Rivera-Calzada, M. Varela, Z. Sefrioui, E. Iborra, C. Leon, S. J.
Pennycook, J. Santamaria, Colossal ionic conductivity at interfaces of epitaxial
34. H.-X. Mai, L.-D. Sun, Y.-W. Zhang, R. Si, W. Feng, H.-P. Zhang, H.-C. Liu, C.-H. Yan,
Shape-Selective Synthesis and Oxygen Storage Behavior of Ceria Nanopolyhedra, Nanorods,
and Nanocubes. J. Phys. Chem. B 109, 24380-24385 (2005).
35. G. Kresse, J. Hafner, Ab initio molecular-dynamics simulation of the liquid-metal–
amorphous-semiconductor transition in germanium. Phys. Rev. B 49, 14251-14269 (1994).
36. P. E. Blöchl, Projector augmented-wave method. Phys. Rev. B 50, 17953-17979 (1994).
37. M. Nolan, S. Grigoleit, D. C. Sayle, S. C. Parker, G. W. Watson, Density functional theory
studies of the structure and electronic structure of pure and defective low index surfaces of
ceria. Surf. Sci. 576, 217-229 (2005).
38. E. A. Kümmerle, G. Heger, The Structures of C–Ce2O3+δ, Ce7O12, and Ce11O20. J. Solid State
Chem. 147, 485-500 (1999).
39. D. Sundholm, J. Olsen, Finite element multiconfiguration Hartree-Fock calculations on
carbon, oxygen, and neon: the nuclear quadrupole moments of 11C, 17O, and 21Ne. J. Phys.
Chem. 96, 627-630 (1992).
Acknowledgments:
General: We thank Dr. Pan Shi, Prof. Changlin Tian (High Magnetic Field Laboratory, Chinese
Academy of Sciences), and Dr. Xuefeng Wang, Prof. Xiuwen Han, Prof. Xinhe Bao (Dalian
Institute of Chemical Physics, Chinese Academy of Sciences) for the help with high field NMR
experiments. We also thank Dr. Junjian Miao and Prof. Shuhua Li (School of Chemistry and
Chemical Engineering, Nanjing University) for the help with DFT calculations. Funding: This
work was supported by the National Basic Research Program of China (2013CB934800,
21222302, 21322307 and 21073083), NSFC - Royal Society Joint Program (21111130201),
Program for New Century Excellent Talents in University (NCET-10-0483), the Fundamental
Research Funds for the Central Universities (1124020512) and National Science Fund for Talent
Training in Basic Science (J1103310). The ECUST group also thanks the Shanghai Rising-Star
Program (12QH1400700) and National Super Computing Centre in Jinan for computing time.
F.B. thanks the EU Marie Curie actions for an International Incoming fellowship 2011-2013
(Grant No. 275212), Clare Hall, University of Cambridge, UK for a Research fellowship and the
University of Liverpool, UK for funding. C.P.G. thanks the European Research Council for an
Advanced Fellowship. This work was also supported by a Project Funded by the Priority
Academic Program Development of Jiangsu Higher Education Institutions. Author
contributions: M.W., S.Z., L.Z., Y.G. and W.H. carried out the synthesis of ceria
nanostructures. M.W., L.L., N.X. and X.G. carried out XRD, electron microscopy, surface area
measurement and other characterizations; M.W., S.Z., L.Z., L.S. and L.P. performed 17O isotope
enrichment, collected and analysed the NMR spectra; M.W., Z.Y., Z.G., F.B. and X.K. collected
and analysed the high field NMR spectra; X.-P.W., and X.-Q.G. conducted the DFT calculations;
M.W., X.-P.W., W.H., W.D., X.-Q.G., C.P.G. and L.P. wrote the manuscript and all authors
discussed the experiments and final manuscript. Competing interests: The authors declare no
competing financial interests.
1100 1000 900 800 700 ppm
A
877B
825 920
1040
14.1 T
9.4 T
DFT 1033 920 837 878~886
573 K 523 K 573 K 623 K 773 K 923 K 1073 K bulk 1033 921 837 879 886 883 884 886 880 838 920 1032 Chemical shift /
[image:24.612.87.517.54.340.2]ppm Number of layer 1 2 3 4 5 6 7 8 9 10 11 12
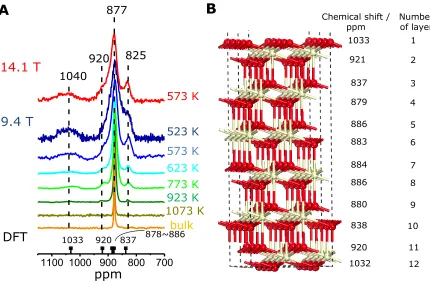
Fig. 1. Solid state NMR spectra of nanosized ceria in comparison with DFT calculations.
(A), 17O NMR spectra for ceria nanoparticles enriched at different temperatures and
external fields compared with the 17O NMR spectra of micron-sized ceria (“bulk” ceria)
and the summary of the chemical shifts predicted using a structural model shown in b.
The spectra obtained at 14.1 and 9.4 T were acquired with spinning speeds of 55 and 20
kHz, respectively. Short pulse lengths of 0.1 ~ 0.4 µs corresponding to π/72 ~ π/18 pulses
for H217O and optimized recycle delays from 1 ~ 100 s to ensure quantitative
observations of all the resonances were used. Detailed experimental parameters are
summarized in Table S9. (B),The structural model of ceria used in the DFT calculations.
Red and white spheres represent oxygen and cerium ions, respectively. The exposed
surface is (111) and the calculated chemical shift of 17O in each layer is shown on the
1400 1200 1000 800 200 0 * * * * * * *
1500 1200 900 600 300 0
* * * * A B 825 850 32 nano ceria
nano-H2O
dried at RT dried at 573 K
nano ceria exposed in air
nano-H2O
(natural) 0 -1 32 877 270 1040 ppm ppm
H217O
bulk-H217O
373 K
373 K
nano-H217O(A)
nano-H217O(D)
[image:25.612.86.526.56.282.2]877 1040
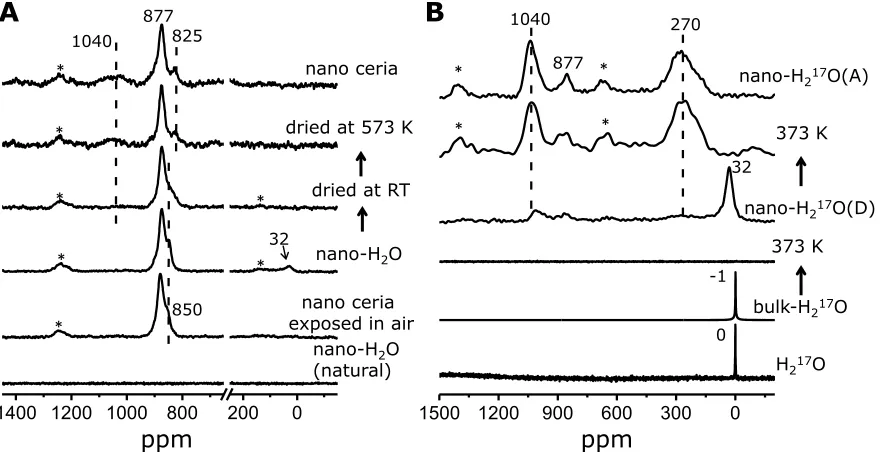
Fig. 2. Solid state NMR spectra of ceria in contact with water. (A), (from bottom to top) 17O
MAS NMR spectra of non-enriched ceria nanoparticles adsorbed with non-enriched
water; ceria nanoparticles enriched in 17O2 at 573 K then exposed to air;ceria
nanoparticles enriched in 17O
2 at 573 K then adsorbed with non-enriched water (water
was added dropwise); the previous sample dried under vacuum at room temperature; and
at 573 K; and ceria nanoparticles enriched in 17O2 at 573 K. (B), (from bottom to top) 17O
NMR spectra of liquid H217O; 17O MAS NMR spectra of bulk ceria adsorbed with H217O
(bulk- H217O); the previous sample dried under vacuum at 373 K; non-enriched ceria
nanoparticles adsorbed with H217O by adding water dropwise (nano- H217O(D)); the
previous sample dried under vacuum at 373 K; and non-enriched ceria nanoparticles
adsorbed with H217O by adsorbing water through vacuum line and then dried under
vacuum at 373 K (nano- H217O(A)). The samples of H217O, bulk- H217O and nano-
H217O(D) in (b) were packed into the rotors in air. All the spectra were acquired at 9.4 T.
Detailed experimental parameters are summarized in Table S10. Asterisks “∗” denotes
0 300 600 900
0.0 0.2 0.4 0.6 0.8 1.0
Intensity(a.u.
)
1200 900 600 300 0
*
* *
*
* * *
A
B
ppm
CP
14.1 T
9.4 T
1040 877
300 270
Spin-echo
difference in REDOR Spin-echo
[image:26.612.87.523.56.305.2]Contact time(
µ
s)
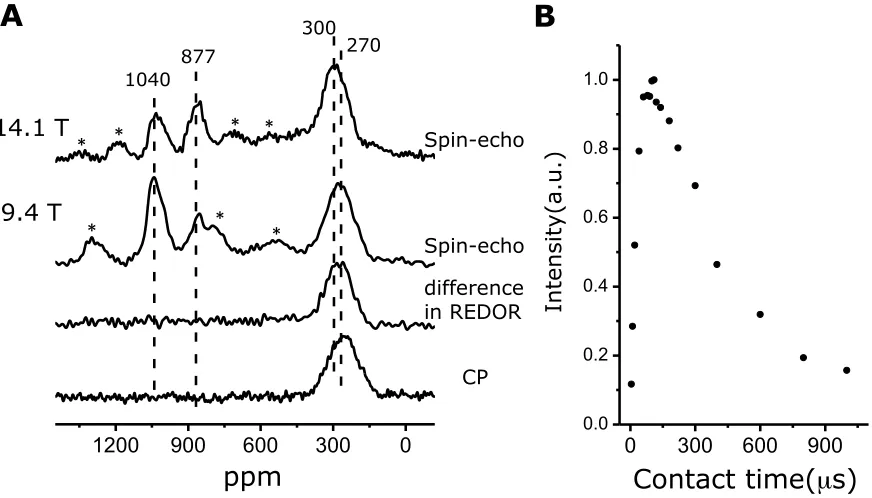
Fig. 3. Double resonance solid state NMR data of ceria nanoparticles. (A), (from top to
bottom) 17O MAS NMR spectra of ceria nanoparticles adsorbed with 17O water followed
by thermal treatment under vacuum at 373 K at 14.1 and 9.4 T; difference spectrum in
17O-1H REDOR experiments; and 1H-17O CP MAS NMR spectrum with a contact time of
100 µs. (B), The peak intensity in CP MAS NMR experiment as a function of contact
time. Spectra were obtained at both 9.4 and 14.1 T under MAS rates of 13 ~ 14 kHz.
1,000 ~ 40,000 scans were averaged and recycle delays from 0.2 ~ 1 s were used.
1500 1200 900 600 300 0 -300
*
* *
* *
*
* *
* *
ppm
1040 877 270
373 K
423 K
473 K
523 K
573 K
773 K
OCe3 OCe4 Ce-OH
Fig. 4. Solid state NMR spectra of ceria nanoparticles adsorbed with H217O followed by
thermal treatment. From top to bottom, 17O NMR spectrum of non-enriched ceria
nanoparticles adsorbed with H217O by adding water dropwise, then dried under vacuum at
373, 423, 473, 523, 573 and 773 K. A rotor synchronized Hahn-echo sequence (π/6 - τ-
π/3- τ - acquisition) was used. Spectra were obtained at 9.4 T under a MAS rate of 20
kHz. 8,000 ~ 20,000 scans were collected and recycle delays from 0.2 ~ 0.5 s were used.
1200 1000 800 600 400 * *
*
2800 1400 0 -1400
A B
877 870
nano reduced
oxidized
ppm
950 900 850 800
reduced
bulk
877
845
ppm
[image:28.612.175.451.52.286.2]1040 ppm
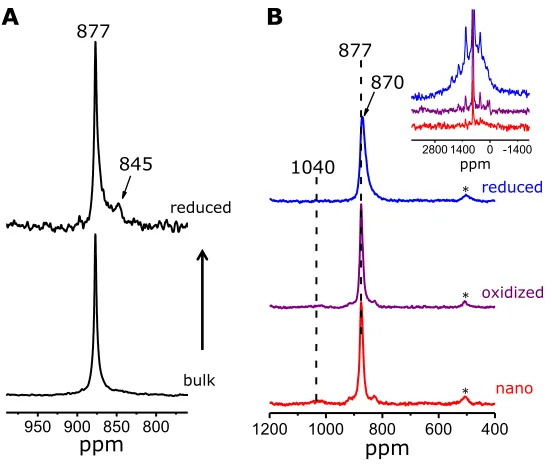
Fig. 5. Solid state NMR spectra of reduced ceria in comparison with bulk and nanosized
ceria. (A), 17O NMR spectra of bulk ceria enriched in 17O
2 at 1073 K (bottom) and
reduced in H2 atmosphere at 1073 K (top). (B), 17O NMR spectra of nanosized ceria
enriched in 17O2 at 773 K (bottom), reduced in H2 atmosphere at 773 K (top), and
re-oxidized in air reduced ceria (middle). Inset shows the full width of the three 17O spectra.
A rotor synchronized Hahn-echo sequence (π/6 - τ- π/3-τ - acquisition) was used. Data
were obtained at 9.4 T under a MAS rate of 20 kHz. 100,000 (a, bulk), 300,000 (a,
reduced), 1024 (b) and 40,000 scans (b, inset) were averaged and recycle delays of 0.1 s
Supplementary Materials
Materials and Methods
Characterization: X-Ray Diffraction (XRD) patterns of prepared samples were recorded in the 2θ
region of 5 - 90° on a Philips X’Pert X-ray diffractometer with a Cu Kα radiation (40 kV, 40
mA, λ = 1.5418 Å). TEM micrographs were performed on a JEOL JEM-2010 transmission
electron microscope. The Brunauer-Emmett-Teller (BET) specific surface areas of the samples
were measured by nitrogen adsorption at 77 K using a Micromeritics tristar ASAP 2020
instrument. The H2 consumption in TPR experiments was measured by means of a thermal
conductivity detector. The reactants (5% hydrogen in nitrogen) were passed over ceria samples
with a flow rate of 40 mL/mim. The heating rate was 10 K/min. X-ray photoelectron
spectroscopy (XPS) analysis was performed on a PHI 5000 VersaProbe system, using
monochromatic Al Kα radiation (1486.6 eV) operating at an accelerating power of 15 kW.
Before the measurements, the samples were outgassed at room temperature in a UHV chamber
(<5 × 10⁻⁷ Pa). The sample charging effects were compensated by calibrating all binding
energies (BE) with the adventitious C 1s peak at 284.6 eV. The morphology of the bulk ceria
sample was investigated by using a field-emission scanning electron microscope (Hitachi
FE-SEM S4800) equipped with an energy dispersive X-ray spectrometer.
The molecular dynamics (MD) simulation and geometry optimization were applied to locate the
optimal structureof water/CeO2(111) interface (Fig. S8). This interface model contains 18 H2O
molecules in vacuum gap (ρwater= 0.98 g/cm3). A canonical ensemble was used to perform a MD
simulation at 300 K for about 16 ps. The top and bottom three atomic layers were relaxed, and
other layers were fixed. After that, several low energy structures obtained during the MD
DFT total energy was regarded as the optimal structureof water/CeO2(111) interface, and the
subsequent chemical shift calculation was performed on this structure.
The oxygen vacancy formation energy (Eov) was calculated as
2-δ 2 2
ov CeO O CeO
1
=
-2
E E + E E where
2-δ
CeO
E ,
2 O
E and 2
CeO
E represent the calculated DFT total energies of defective CeO2(111),
10 20 30 40 50 60 70 80 90 222
220 200
Re
la
tive in
tensi
ty/
a.u
2 Theta/degree
nanoparticles
bulk 111
[image:31.612.129.518.55.235.2]A
B
Fig. S1. XRD and electron microscopy characterization of ceria nanoparticles. (A) XRD
patterns of ceria nanoparticles and bulk ceria; (B) HRTEM images and SAED pattern of ceria
nanoparticles.
10 20 30 40 50 60 70 80
Re
la
tive in
tensi
ty/
a.u
2 Theta/degree
1073 K
923 K
773 K 623 K 573 K 523 K
[image:31.612.174.439.365.573.2]A B
-0.1 0.0 0.1 0.2 0.3 0.4 0.5 0.6 0.0 0.2 0.4 0.6 0.8 1.0
Intensity 1040 ppm
T1=0.013s b=0.87
time/s
0 1 2 3 4 5 6
0.0 0.2 0.4 0.6 0.8 1.0
Intensity 920 ppm
T1=0.038s b=0.5
time/s 0 4 8 12 16
0.0 0.2 0.4 0.6 0.8 1.0
Intensity 877 ppm
T1=0.090 s b=0.5
time/s
0 1 2 3 4
0.0 0.2 0.4 0.6 0.8 1.0
Intensity 825 ppm
T1=0.032s b=1.0
time/s
0 2 4 6 8 10 12 14 16
0.4 0.6 0.8 1.0 1040 ppm 825 ppm 920 ppm 877 ppm In te nsity time/s
[image:33.612.82.542.54.225.2]0.0 0.2 0.4 0.6 0.8 1.0 0.4 0.6 0.8 1.0 Intensity time/s
Fig. S4. Longitudinal relaxation studies of ceria nanoparticles. (A) 17O NMR spectra signal
intensities measured with different recycle delays on the sample of ceria nanoparticles enriched
in 17O2 at 573 K using a solution π/18 pulse as the excitation pulse. (B) T1 analytical fits using a
stretch exponential function of the type 1 ( )
0
(t) (1 )
b t T
I =I −e− , where I(t) and I0 are the signal
1100 1000 900 800 700
ppm
523 K
1100 1000 900 800 700 623 K
ppm 1100 1000 900 800 700
573 K
ppm 1100 1000 900 800 700 773 K
ppm 1100 1000 900 800 700
923 K
ppm A
total area: 100 total area: 100 total area: 100 total area: 100 total area: 100
1040 ppm
area: 12.6 1040 ppmarea: 12.0 1040 ppmarea: 7.0 1040 ppmarea: 5.5 1040 ppmarea: 1.9
2 4 6 8 10 12 14 16 18 20
0 10 20
%
D/nm
BET calculation
NMR area
[image:34.612.91.533.63.316.2]B
Fig. S5. Quantification of surface oxygen ions from NMR and BET data. (A) 17O NMR
spectral deconvolutions for the ceria nanoparticle samples enriched in 17O2 at 523, 573, 623, 773
and 923 K, respectively. (B) The comparison of the fractions of surface low-coordinated species
(~1040 ppm) obtained from spectral deconvolutions (A) and estimated according to the BET
1050 1000 950 900 850 800 ppm 879~892 809 907 1061
1050 1000 950 900 850 800
ppm 878~885 837 920 1033 Chemical shift / ppm B C A E F D 1033 921 837 879 886 883 884 886 880 838 920 1032 Chemical shift / ppm 1061 809 906 879 891 885 888 886 892 880 907 809 1061 Chemical shift / ppm 1129 716 915 835 907 866 898 875 891 877 888 888 890 877 897 874 907 865 914 834 1129716
1100 1000 900 800 700
ppm
834~914 716
[image:35.612.98.544.56.397.2]1129
Fig. S6. Chemical shift calculations of ceria with different surface slabs. Calculated CeO2
(A) (111), (B) (110) and (C) (100) surface slabs, and the summary of the corresponding
calculated NMR chemical shifts (D, E and F). 1st, 2nd and 3rd surface layers are in green, violet
1200 1000 800 600
773 K 623 K 573 K
* * *
850 877
ppm
1040
[image:36.612.226.402.47.234.2]* * *
Fig. S7. Solid-state NMR of ceria nanoparticles in contact with water at ultrahigh field. 17O
MAS NMR spectra of nanosized ceria enriched in 17O
2 at different temperatures in contact with
water at ultrahigh external field of 19.4 T. The samples were packed into the rotors in air. A rotor
synchronized Hahn-echo sequence (π/2 - τ - π- τ - acquisition) was used. Spinning speed, 35
1100 1000 900 800 700 600 500 400 300 "bulk" third second first layer ppm OH 366 B A 37 40 38 39 14 16 13 15 46 48 45 47 8 6 7 5 34 36 33 35 22 24 21 23 18 20 17 19 26 28 25 27 3 1 4 2 3 42 44 41 43 10 12 9 11 32 30 31 29 Number
[image:37.612.85.538.71.352.2]of layer 6 5 4 3 2 1 1 2 3 4 5 6
Fig. S8. DFT calculations for ceria in contact with water. (A) Optimal structure of
water/CeO2(111) interface. (B) Summary of calculated NMR chemical shifts. The chemical
shifts of oxygen ions in the 1st, 2nd and 3rd surface layers, hydroxyl groups are in green, violet,
yellow and blue, respectively. Each oxygen ion is labelled and the corresponding NMR
parameters for quadrupolar interaction (CQ, ηQ and νQ) and chemical shift are shown in Table S4
8
µ
s7
µ
s6
µ
s5
µ
s4
µ
s3
µ
sApplied pulse length
(
µ
s
)
2
π
=16µ
s
2
µ
s1
µ
s*
#*
#
*
#
*
#
*
[image:38.612.135.475.49.230.2]#
*
#*
#*
#Fig. S9. Nutation NMR of ceria nanoparticles. 17O NMR nutation curves for the peaks at 1040
ppm (∗) and 270 ppm (#) measured on the ceria nanoparticles enriched in 17O
2 at 573 K. Spectra
are plotted as a function of the pulse length. The pulse length was incremented in steps of 1.0 µs
from 1.0 to 8.0 µs corresponding to about π/8 to π for water. Field, 9.4 T; spinning speed, 14
0 30 60 90 120 150 180 0.00
0.05 0.10 0.15 0.20 0.25
TRAPDO
R fra
cti
on
100 80 60 40 20 0 -20 -40 -60 -80
* *
difference Double resonance
Control
ppm
* *
*
*
* * *
* * *
* * * * *
* * * * *
* * * * * * * *
A
B
[image:39.612.95.530.62.316.2]Irradiation time (µs)
Fig. S10. TRAPDOR NMR of ceria nanoparticles. (A) 1H-17O TRAPDOR NMR spectra at an
irradiation time of 120 µs (and a 17O radio-frequency field strength of 62.5 kHz determined with
H217O) of nanosized ceria enriched with 17O-water (the non-enriched ceria nanoparticles were
adsorbed with 17O-water over the vacuum line before it was dried under vacuum at 373 K). Field,
9.4 T; spinning speed, 5 kHz; recycle delay, 4 s. (B) Plot of the 1H-17O TRAPDOR fractions
1600 1200 800 400 0 -400
ppm
enriched with H
2 17O
enriched with 17O
2
*
270 877
825 920
* * * *
* *
*
*
*1027
A
B
[image:40.612.169.457.70.428.2]C
Fig. S11. Electron microscopy and solid-state NMR spectra of ceria nanorods. (A) HRTEM
image of ceria nanorods with (111) facets exposed. (B) 17O MAS NMR spectra of ceriananorods
labelled by heating in 17O2 (70 % 17O) at 923 K. (C) 17O MAS NMR spectra of ceriananorods
labelled by adsorbing H217O (70 % 17O) at room temperature followed by thermal treatment at
Fig. S12. Vacancy formation energies of different oxygen ions. Vacancy formation energies
1500 1200 900 600 300 0
923 K 16 nm 60 m2/g 773 K 7.8 nm 135 m2/g
* *
* *
* *
ppm
573 K 5.8 nm 176 m2/g
1040
920
[image:42.612.162.480.53.294.2]270
Fig. S13. Solid-state NMR spectra of ceria nanoparticles with different surface area
labelled by adsorbing H217O. 17O MAS NMR spectra of nanosized ceria samples pre-heated at
different temperature followed by 17O enrichment with H217O (70 % 17O) (the non-enriched
samples were adsorbed with 17O-water over the vacuum line before it was dried under vacuum at
373 K). Short pulse lengths of π/6 and recycle delays of 0.1 s were used. Field, 9.4 T; spinning
speed, 20 kHz (573 K, 773 K) or 14 kHz (923 K); number of scans, 20,000 (573 K, 773 K) and
920 910 900 890 880
v'''
v'' v'v
v0
u0
u
u' u''
nanorods bulk 1073 K
923 K 773 K 623 K 573 K
a.
u.
Binding Energy (eV)
523 K
u'''
Fig. S14. Ce 3d3/2,5/2 XPS spectra collected for ceria nanoparticles, nanorods and bulk
sample, as well as line fitting results. v0, v’, u0 and u’ peaks are attributed to Ce3+; while v, v’’,
v’’’, u, u’’, and u’’’ are the characteristic peaks of Ce4+ ions. For Ce3+, the binding energy peaks
v0 and u0 at 880.6 and 898.8 eV, respectively, correspond to the Ce 3d94f2 O 2p5 final state; the
binding energy peaks v’ and u’ at about 884.7 and 902.7 eV, respectively, can be attributed to the
Ce 3d94f1 O 2p6 final state. For Ce4+, the binding energy peaks v, u and v’’, u’’ at 882.7,
901.2, 888.9 and 907.7 eV, respectively, arise from Ce 3d94f2 O 2p4 and Ce 3d94f1 O 2p5 final
states; the binding energy peaks, v’’’ and u’’’ at about 898.6 and 917.0 eV, respectively, are due
[image:43.612.185.436.51.453.2]2 4 6 8 10 12 14 16 18 40 45 50 5
10 15 20 25 30
●
Nanoparticles
■
Nanorods
◆
Bulk ceria
Mo
lar
pe
rc
en
tag
e of Ce
3+
(%)
Particle size (nm)
[image:44.612.127.498.58.343.2]Bulk
Fig. S15. The molar percentage of Ce3+ as a function of particle size from XPS data. The
molar percentage of Ce3+ is calculated by using (27, 28)
' '
3
' '' ''' ' '' '''
[ ] o o
o o
v u
v u
v v v v u u u u
v u
A A A A Ce
A A A A A A A A A A
+ + + +
=
+ + + + + + + + + ,
300 400 500 600 700 800 900 1000
Hyd
rog
en
consu
mptio
n/a.u
nano
Temperature(K)
[image:45.612.152.461.80.335.2]bulk
Fig. S16. H2 temperature programmed reduction (TPR) profiles of bulk ceria and ceria
1100 1050 1000 950 900 850 800 750 3 4 5 6 7 8 9 877 Dis ta nc e t o O v /A ppm
1100 1050 1000 950 900 850 800 750
1 2 3 4 5 6 877 Num be r o f la ye r ppm 37 38 39 13 14 16 15 44 45 47 46
O
V A B C36 39 38 37
14 13 15
45 44 4746
5 6 7 8
3332 3534
O
VO
V 13 14 15 36 39 38 37 46 44 47 45O
V37 39 38
14 13 16 15
45 44 47 46
8 7 6 5
O
V 1 2 3 4 5 6 7 8 9 10 11 12 13 14 15 16 17 18 19 20 21 22 23 24 25 26 27 28 29 30 31 32 33 34 35 36 37 38 39 40 41 42 43 44 45 46 47 48 49 50 51 52 53 54 55 56 57 58 59 60 61 62 63 D E F1100 1050 1000 950 900 850 800 750
[image:46.612.121.498.49.618.2]1 2 3 4 5 6 Num be r o f la ye r ppm 877 Number of layer 1 2 3 4 5 6 7 8 9 10 11 12 Number of layer 1 2 3 4 5 6 7 8 9 10 11 12
Fig. S17. The structure model and chemical shift calculations of ceria with oxygen
vacancies. The structural model of ceria for DFT calculations of the effects of an oxygen
vacancy on the NMR chemical shift. Calculated structures of (A) CeO2 (2×2×2) unit cell with an
CeO2(111) with a surface oxygen vacancy (top and side views). (D, E, F) Summary of the
corresponding calculated NMR chemical shifts (See Table S6-8 for details). Oxygen ions in the
1st, 2nd and 3rd surface layers of (b, c) are in green, violet and yellow, respectively. Each oxygen
A
[image:48.612.173.450.53.459.2]B
Fig. S18. The criterion for NMR calculations and the determination of chemical shift. (A)
Test on the cutoff and stopping-criterion for electronic minimization at clean CeO2(111). (B)
Table S1. Mean diameter of ceria nanoparticles. Mean diameter (DXRD) of ceria nanoparticles
calcined at different temperatures in a 17O2 atmosphere calculated based on the XRD data (Fig.
S2) by using the Debye-Scherrer equation.
Temperature (K) DXRD (nm)
523 4.3 (5)
573 5.8 (6)
623 6.0 (7)
773 7.8 (7)
923 16.0 (20)
1073 42.0 (30)
Table S2. BET surface area of ceria samples. BET surface area of ceria nanoparticles calcined
at different temperature in comparison with bulk ceria.
Temperature (K) BET Surface Area (m2·g-1)
523 190
573 176
623 166
773 135
923 60
1073 25
[image:49.612.140.446.471.700.2]Table S3. Calculated NMR parameters of quadrupolar interaction for ceria. Calculated CQ,
ηQ and νQ of oxygen ions in the structural model shown in Fig. 1B.
Layer CQ
(kHz)
νQ
(kHz)
η
1 135 20.3 0.004
2 107 16.1 0.002
3 117 17.6 0.009
4 23 3.5 0.029
5 26 3.9 0.019
6 23 3.5 0.067
7 10 1.5 0.168
8 10 1.5 0.128
9 5 0.8 0.235
10 123 18.5 0.019
11 99 14.9 0.012
12 144 21.6 0.001
Table S4. Calculated NMR parameters of quadrupolar interaction for ceria in contact with
water. Calculated CQ, ηQ and νQ of oxygen ions in the structural model shown in Fig. S8A. The
number in the parenthesis corresponds to the labelling of the oxygen ion shown in Fig. S8A.
Number Layer CQ
(kHz)
νQ
(kHz)
η
1
3
117 17.6 0.115
2 117 17.6 0.757
3 122 18.3 0.916
4 92 13.8 0.146
5
4
46 6.9 0.641
6 49 7.4 0.684
7 107 16.1 0.217
8 130 19.5 0.069
9
5
53 8.0 0.061
10 46 6.9 0.141
11 64 9.6 0.128
12 61 9.2 0.109
13
2
221 33.2 0.827
14 167 25.1 0.769
15 193 29.0 0.566
16 223 33.5 0.409