Compressed Sensing on
Terahertz Imaging
Thesis submitted in accordance with the
requirements of the University of Liverpool for the
degree of Doctor of Philosophy
by
Hao Shen
June 2012
I
Abstract
Most terahertz (THz) time-domain (pulsed) imaging experiments that have been
performed by raster scanning the object relative to a focused THz beam require
minutes or even hours to acquire a complete image. This slow image acquisition is a
major limiting factor for real-time applications. Other systems using focal plane
detector arrays can acquire images in real-time, but they are too expensive or are
limited by low sensitivity in the THz range. More importantly, such systems cannot
provide spectroscopic information of the sample.
To develop faster and more efficient THz time-domain (pulsed) imaging systems, this
research used random projection approach to reconstruct THz images from the
synthetic and real-world THz data based on the concept of compressed/compressive
sensing/sampling (CS). Compared with conventional THz time-domain (pulsed)
imaging, no raster scanning of the object is required. The simulation results
demonstrated that CS has great potential for real-time THz imaging systems because
its use can dramatically reduce the number of measurements in such systems.
We then implemented two different CS-THz systems based on the random projection
method. One is a compressive THz time-domain (pulsed) spectroscopic imaging
system using a set of independent optimized masks. A single-point THz detector,
together with a set of 40 optimized two-dimensional binary masks, was used to
measure the THz waveforms transmitted through a sample. THz time- and
frequency-domain images of the sample comprising 20×20 pixels were subsequently
reconstructed. This demonstrated that both the spatial distribution and the spectral
characteristics of a sample can be obtained by this means. Compared with
conventional THz time-domain (pulsed) imaging, ten times fewer THz spectra need to
II
In order to further speed up the image acquisition and reconstruction process, another
hardware implementation - a single rotating mask (i.e., the spinning disk) with
random binary patterns - was utilized to spatially modulate a collimated THz. After
propagating through the sample, the THz beam was measured using a single detector,
and a THz image was subsequently reconstructed using the CS approach. This
demonstrated that a 32×32 pixel image could be obtained from 160 to 240
measurements. This spinning disk configuration allows the use of an electric motor to
rotate the spinning disk, thus enabling the experiment to be performed automatically
and continuously. To the best of our knowledge, this is the first experimental
implementation of a spinning disk configuration for high speed compressive image
acquisition.
A three-dimensional (3D) joint reconstruction approach was developed to reconstruct
THz images from random/incomplete subsets of THz data. Such a random sampling
method provides a fast THz imaging acquisition and also simplifies the current THz
imaging hardware implementation. The core idea is extended in image inpainting to
the case of 3D data. Our main objective is to exploit both spatial and
spectral/temporal information for recovering the missing samples. It has been shown
that this approach has superiority over the case where the spectral/temporal images
are treated independently. We first proposed to learn a spatio-spectral/temporal
dictionary from a subset of available training data. Using this dictionary, the THz
images can then be jointly recovered from an incomplete set of observations. The
simulation results using the measured THz image data confirm that this 3D joint
reconstruction approach also provides a significant improvement over the existing
III
Acknowledgments
This thesis could not be finished without the help and support of many people who are
grateful acknowledged here. At a very first, I would like to express my deepest
gratitude to my supervisor, Dr. Yaochun Shen. He has always given me valuable ideas,
suggestions and comments with his profound knowledge and rich research experience
and guided me in the right direction. He was easily available and accessible and
willing to discuss whenever I needed his guidance and support. Then, I owe special
thanks to Dr. Lu Gan and Dr. Vahid Abolghasemi for supporting part of this research.
I could not accomplish my thesis without their kind support and valuable suggestions.
I also would like to thank Prof. Yi Huang for supporting and guiding me in my
research. I have learnt from them a lot not only about research, but also about the
professional ethics.
In additional, I wish to extend my thanks to the Department of Electrical Engineering
and Electronics for its support of this study. I would like to thank Mr. Alan Edwards
for manufacturing the power supplier for BWO THz source. And I owe special thanks
to Mr. Alan Roby, Mr. John Lynch and Miss Jill Anson of the core services for their
help and guidance in making experimental equipments. Also, I would like to thank
Prof. Peter Weightman and Mr. Paul Harrison, from Department of Physics, for
providing the BWO THz source used in this work.
Thanks are also due to Engineering and Physical Sciences Research Council (EPSRC),
UK Technology Strategy Board (TSB), and my university, for their support during
this work. Part of my work were accomplished by their funding (EP/H02235X/1,
EP/I038853/1, EP/E048811/1, and AB293H).
I would like to thank my postgraduate colleagues, who never failed to give me great
IV
Liu and Miss Chen Li for their kindly supports and suggestions. I am also indebted to
Mr. Lei Wang for his helps.
Last but not least, I would like to thank my family members, especially my wife, Lin
Xu, and my parents. My wife has to live alone for such a long time when I was busy
in doing research at University. This would not be possible without her
encouragement. Without my parents' support during my whole research duration, I
V
Table of Contents
Abstract ... I
List of Figures ... VII List of Tables ... XIII
Chapter 1 Introduction ... 1
1.1 Motivation of the Work ... 1
1.2 Organization of the Thesis ... 4
References: ... 7
Chapter 2 Background ... 9
2.1 Terahertz Imaging ... 9
2.1.1 THz Sources ... 10
2.1.2 THz Detectors ... 15
2.1.3 THz Time-Domain Spectroscopy (THz-TDS) ... 19
2.1.4 THz time-domain (pulsed) imaging (TPI) ... 24
2.1.5 Applications of THz Imaging ... 32
2.2 Compressed Sensing ... 39
2.2.1 Background of CS ... 40
2.2.2 Sparse Signal Model ... 43
2.2.3 Sensing Matrices ... 45
2.2.4 Signal Recovery Algorithms ... 47
2.2.5 CS Imaging Applications ... 51
References: ... 54
Chapter 3 Random Projection on THz Imaging ... 67
3.1 Introduction of Random Projection on THz Imaging... 67
3.2 Simulation Procedure on Random Projection ... 68
3.3 Simulation Results on Synthetic Data and Real-World THz Data ... 69
3.4 Simulation Results on Real-World THz Data ... 76
3.5 Summary ... 77
References: ... 78
Chapter 4 CS-THz System using a set of Independent Optimized Masks ... 80
4.1 Masks Design based on CS ... 81
4.2 CS-THz Experiment using IR Light Source ... 84
4.2.1 Experimental Setup ... 84
4.2.2 Experimental Results ... 84
4.3 CS-THz Experiment using BWO THz Source ... 87
4.3.1 Experimental Setup ... 87
4.3.2 Experimental Results ... 87
4.4 CS-THz Time-Domain (pulsed) Spectroscopic Imaging Experiment ... 88
4.4.1 Experimental Setup ... 88
4.4.2 Experimental Results ... 89
VI
References: ... 94
Chapter 5 CS-THz System using a Single Spinning Disk ... 96
5.1 Spinning Disk Design based on CS... 97
5.2 CS-THz Experiment using IR Light Source ... 101
5.2.1 Experimental Setup ... 101
5.2.2 Experimental Results ... 105
5.3 CS-THz Experiment using BWO THz Source ... 106
5.3.1 Experimental Setup ... 106
5.3.2 Experimental Results ... 108
5.4 CS-THz Time-Domain (pulsed) Imaging Experiment ... 109
5.4.1 Experimental Setup ... 109
5.4.2 Experimental Results ... 110
5.5 New Generation Spinning Disk ... 113
5.6 Discussion ... 115
5.7 Summary ... 117
References: ... 119
Chapter 6 Three-Dimensional Reconstruction from Random/Incomplete Subsets of THz Data ... 121
6.1 Frame-by-Frame Inpainting ... 122
6.2 3D joint Dictionary Learning and Recovery ... 125
6.2.1 Dictionary Learning for 3D Training Data ... 127
6.2.2 Joint Reconstruction from Incomplete Data ... 128
6.2.4 Results and Discussions ... 131
6.5 Summary ... 134
References: ... 136
Chapter 7 Conclusions and Future Work ... 138
7.1 Conclusions ... 138
VII
List of Figures
Figure. 1.1 The THz range of the spectrum lies between high-frequency edge of
the microwave band and the long-wavelength edge of far-infrared light. ... 1
Figure. 2.1 (a) Photograph and (b) THz image of a packaged semiconductor
integrated circuit (plastic packaging). This is one of the first images acquired using THz-TDS... ... 9
Figure. 2.2 Photoconductive antenna for generation of broadband THz pulses. ... 11
Figure. 2.3 Schematic diagram of two-beam photomixing with a photomixer. ... 13
Figure. 2.4 A photo of BWO source (Insight Productive Company, USA) which
provides electromagnetic radiation at 0.14 THz. ... 14
Figure. 2.5 Schematic diagram of a typical setup for free-space EO sampling. .... 17
Figure. 2.6 A photo of pyroelectric detector (SPH-49, Spectrum Detector Inc.
USA). NEP=3×10⁻⁹ W/Hz1/2 . ... 18
Figure. 2.7 Schematic configuration of a full THz-TDS system for transmission
spectroscopy. A photoconductive emitter is used for THz generation and an EO crystal is used for THz detection. (PM: parabolic mirror, BS: beam splitter, PC THz emitter: photoconductive THz emitter, and EO: electro-optic). ... 20
Figure. 2.8 Schematic diagram of the geometries for transmission and reflection
THz spectroscopy. Eˆ0() is the incident field, Eˆt() is the
transmitted field, and Eˆr() and Eˆr'() are the reflected fields from first and second interface of the sample. Figure adapted from [9]. ... 20 Figure. 2.9 (a) THz bandwidth transient recorded in the time domain and (b) its corresponding frequency spectrum. ... 22
Figure. 2.10 Schematic diagram of a reflection TPI system. (PM: parabolic mirror,
BS: beam splitter, PC THz emitter: photoconductive THz emitter, and PC THz detector: photoconductive THz detector). ... 26
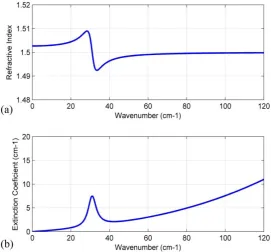
Figure. 2.11 Schematic diagram of 1-D model for simulating THz propagation in a
multilayered medium. ... 27 Figure. 2.12 Simulated (a) refractive index and (b) extinction coefficient using a Lorentz model. Here, the center frequency value is 31 cm-1 (0.93 THz); the width of oscillator is 5 cm-1; the strength of the oscillator is 8 cm-1; and the C1=0.2, C2=0.2, C3=0.2 and C4=0. ... 28
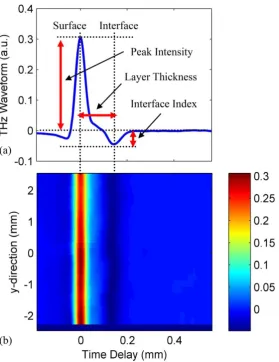
Figure. 2.13 (a) Typical THz waveform measured for a one-layer sample. (b)
B-scan of THz waveforms measured for a one-layer sample. ... 30 Figure. 2.14 THz transmission images of a chocolate bar obtained by using (a) peak-to-peak amplitude of the transmitted time-domain pulse and (b) variation in transit time of the THz pulse through the sample. ... 32
VIII
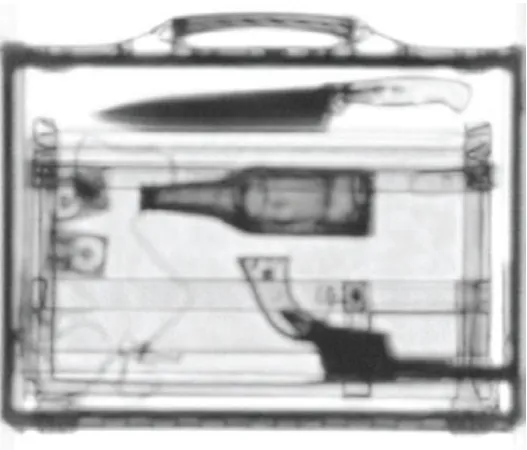
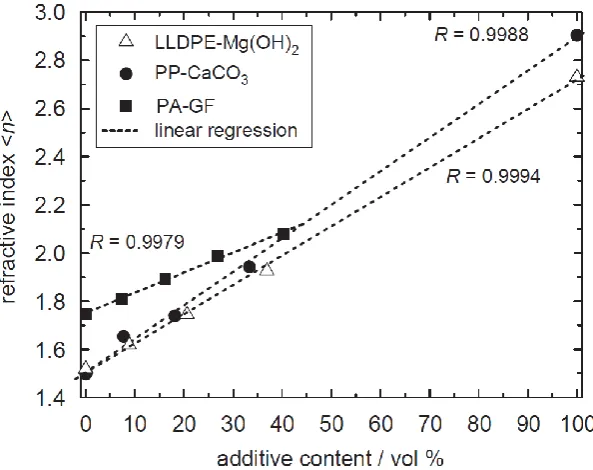
imaging system. All the inner objects, such as a knife, a bottle and a gun, are clearly identified.. ... 34 Figure. 2.16 Refractive index as a function of the volumetric additive content for different polymeric compounds.. ... 35
Figure. 2.17 Three-dimensional TPI false color image showing the coating
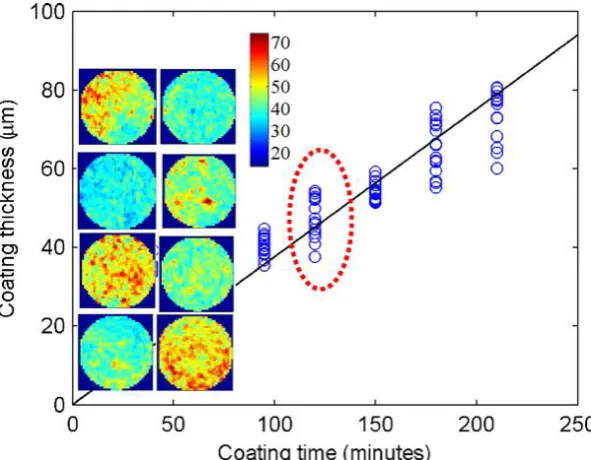
thickness map of the two tablet surfaces and the central band. Color represents coating thickness, and the scale is in μm. The scales in the x, y and z directions are in mm. The inset shows the optical photograph of the same tablet where the defect areas are highlighted by a yellow ellipse. ... 36 Figure. 2.18 The averaged coating thickness of each individual tablet against the coating time. The inset shows the coating thickness map (in μm) of eight tablets with the same coating time of 120 minutes.. ... 37
Figure. 2.19 (a) Photograph of the painting sample and corresponding THz images:
(b) delay of the transmitted THz pulse maximum, and power transmission integrated over the frequency interval covering (c) 0.3-0.4 THz and (d) 0.1-0.2 THz. ... 38
Figure. 2.20 Schematic diagram of single-pixel camera. The incident light is
reflected by the sample and then formed on the digital micro-mirror device (DMD) array whose mirror orientations are modulated in the pseudorandom pattern supplied by the random number generators (RNG). Finally, the light is focused onto the photodiode for reconstruction and processing.. ... 51 Figure. 3.1 Schematic diagram of single-pixel THz imaging system. ... 68
Figure. 3.2 Flowchart diagram of simulation on synthetic and real-world THz data.
... 69 Figure. 3.3 Original image for body scan with weapon. ... 70
Figure. 3.4 Simulated results for linear measurements. The left-hand inset image is
the original image and the right-hand inset image is the reconstructed image using 500 linear measurements. ... 71
Figure. 3.5 Reconstructed images using (a) 24×24 physical pixels sensing matrices;
(b) 48×48 physical pixels sensing matrices; and (c) 96×96 physical pixels sensing matrices. (SR: sampling rate). ... 71 Figure. 3.6 The simulation results for reconstructing two images ("angry" and "smile") using the full random projection. MMSE linear estimation is used for recovery. All images have 96×96 pixels. (SR: sampling rate, SNR: signal to additive Gaussian noise ratio). ... 73 Figure. 3.7 SNRs for reconstructing an image "Smile" using the full random projection. MMSE linear estimation is used for recovery. (SR: sampling rate, SNR: signal to noise ratio). ... 74
Figure. 3.8 (a) Original image (a single-pixel line). The corresponding
IX
Figure. 3.9 (a) A-scan of reconstructed image from each row of the data for
reconstructing single-pixel line at 50% sampling rate. All 96 rows of the data from Figure. 3.7 (j) are presented. (b) The average value of all rows of the data from (a). ... 75 Figure. 3.10 (a) Original image. The corresponding reconstruction results (b)-(h) using MMSE linear estimation for different sampling rates at 3%, 5%, 10%, 15%, 20%, 25% and 30%, respectively. ... 76 Figure. 4.1 Optimized mask set for CS-THz system. ... 82
Figure. 4.2 Simulated results demonstrating the universality of the proposed mask.
(a) Original image and reconstructed images using (b) 40 optimized masks, (c) 40 random masks, and (d) 120 random masks. ... 83
Figure. 4.3 Schematic diagram of the compressive imaging system (PM: parabolic
mirror, LED: light emitting diode, PD: photodiode, DAQ: data acquisition). ... 84
Figure. 4.4 Simulated results for linear measurements. The left-hand inset image is
the simulated results and the right-hand inset image is the reconstructed image using 40 optimized masks... 85 Figure. 4.5 (a) Photographs of the samples shaped as "T", "H", "A", "H" and "G" used in IR imaging experiment, and their corresponding IR images reconstructed using (b) MMSE linear estimation. Each image has 20×20 pixels and was reconstructed by 40 optimized masks. ... 86 Figure. 4.6 (a) Photographs of the samples shaped as "E" used in IR imaging experiment. Their corresponding 20×20 pixels IR images are reconstructed using (b) MMSE linear estimation and (c) TV-min nonlinear reconstruction algorithm. The extended 80×80 pixels IR images are reconstructed using (d) MMSE linear estimation and (e) TV-min nonlinear reconstruction algorithm. ... 86
Figure. 4.7 Schematic diagram of the compressed THz imaging system using
BWO source. ... 87
Figure. 4.8 THz images reconstructed using (a) simulated signals and (b)
measured signals. Each character of this sample shaped as "COOL" is respectively reconstructed using 40 optimized masks. Each image has a 20×20 pixels with a pixel size of 2.0 mm×2.0 mm. A BWO source at 0.14 THz was used to illuminate the sample and the transmitted THz radiation was measured using a single-element pyroelectric sensor. ... 88
Figure. 4.9 Experimental arrangement for TPI using compressive sampling. Each
of 40 masks has a 40.0 mm×40.0 mm imaging area. The copper pixels are opaque to THz radiation while the white pixels are transparent to THz radiation. (BS: beam splitter, PM: parabolic mirror). ... 89
Figure. 4.10 (a) Original 20.0 mm×20.0 mm image of a Chinese character “big”. (b)
Spatial domain reconstruction. (c)-(f) Reconstructed image at 0.15, 0.3, 1.0 and 2.0 THz. All image have 20×20 pixels and the pixel size is 2.0 mm×2.0 mm. ... 90
X
THz, respectively. Each image is 40.0 mm×40.0 mm. (d) RGB chemical map of the sample where red is assigned to lactose, green to polythene, and blue to regions of no transmission (copper areas). (e) THz spectra of polyethylene (upper trace) and lactose (lower trace). The inset shows a photograph of the sample that is made of copper tape with two square holes (each 20.0 mm×20.0 mm). A 3.0-mm-thick polyethylene pellet is placed at the top-left square while a 3.2-mm-thick lactose pellet is placed at the bottom-right square. ... 91
Figure. 5.1 Schematic diagram of the spinning disk. When spinning the disk, each
effective mask is obtained from the rectangular window in green with different binary patterns (i.e., the area between two red dashed lines is the actual imaging area). ... 97
Figure. 5.2 The simulation results for reconstructing an image of English character
"A" using the spinning disk configuration. Both MMSE linear estimation and TV-min nonlinear reconstruction algorithm are used. All images have 32×32 pixels. (NM: number of measurements, SNR: signal to additive Gaussian noise ratio). ... 99 Figure. 5.3 SNRs for reconstructing an image of English character "A" using the spinning disk configuration. Both MMSE linear estimation and TV-min nonlinear reconstruction algorithm are investigated. (NM: number of measurements, SNR: signal to noise ratio). ... 100
Figure. 5.4 SNRs comparison for reconstructed images using spinning disk
configuration (SDC) and full random operator (FRO). TV-min nonlinear reconstruction algorithm is used. For SDC, it is about 2-5 dB degradation with regard to the FRO. The insets show the reconstructed images using 360 measurements: the top two images are reconstructed using FRO and the bottom two are recovered using SDC, both at 10 dB and 60 dB signal to additive Gaussian noise ratio. (NM: number of measurements, SNR: signal to noise ratio). ... 101
Figure. 5.5 Schematic diagram of a spinning disk based compressive imaging
system. The square enclosed by the solid red line represents the "effective image window". In our experiment, the spinning disk has a
radius of R=95.0 mm and the image window is placed l=35.0 mm from
the center of the disk. A hole of 0.5 mm diameter at the edge of the spinning disk is used for synchronizing the mask position and the measured signal. (LED: light emitting diode, PD1: photodiode, DAQ: data acquisition). ... 102
Figure. 5.6 Photo of a spinning disk based IR compressive imaging system. A pair
of LED and photodiode in white dashed square, together with a hole of 0.5 mm diameter at the edge of the spinning disk, are used for synchronizing the mask position and the measured signal. (LED: light emitting diode, PM: parabolic mirror). ... 103
Figure. 5.7 Synchronizing the disk rotation with data measurement by comprising
XI
photodiode (PD1). (a) Measured data for reconstruction. (b) Feedback signal for synchronization. ... 104 Figure. 5.8 (a) Photographs of the samples used in IR imaging experiment, and their corresponding IR images reconstructed using (b) MMSE linear estimation and (c) the TV-min nonlinear reconstruction algorithm. Each image has 32×32 pixels and was reconstructed from 240 measurements. ... 106
Figure. 5.9 Schematic diagram of the compressive THz imaging system using
BWO source. A single rotating mask (a spinning disk) was used to modulate the THz beam. ... 107
Figure. 5.10 Photo of the compressive THz imaging system using BWO source. 107
Figure. 5.11 The physical spinning disk which is fabricated on a 0.5-mm-thick standard print circuit board (PCB). The diameter of this spinning disk is 20.0 mm and each of the physical pixel is 1.0 mm×1.0 mm. ... 108
Figure. 5.12 (a) Photograph of samples, and the corresponding THz images
reconstructed using (b) simulated signals and (c) measured signals. The samples used are copper tape with a cut-through pattern of "T", "H" and "z", which is concealed in fiber reinforced epoxy resin. The spinning disk was used, and the images were reconstructed from 100 measurements. Each image has a 32×32 pixels with a pixel size of 1.0 mm×1.0 mm. A BWO source at 0.14 THz was used to illuminate the sample and the transmitted THz radiation was measured using a single-element pyroelectric sensor. ... 109
Figure. 5.13 Photo of the compressed THz time-domain (pulsed) spectroscopic
imaging system. A photoconductive emitter is used for THz generation and an EO crystal is used for THz detection. (BS: beam splitter, PC THz emitter: photoconductive THz emitter, and EO: electro-optic). 110 Figure. 5.14 (a) Power of laser as a function of time delay. (b) Simulated and reconstructed results comparison. The curve in blue is the simulated results which is the ideal simulated data. The one in red is the measured data; and the one in green is the calibrated data using the data from (a). ... 111 Figure. 5.15 (a) Photographs of the samples used in the THz imaging experiment, and their corresponding THz images reconstructed using (b) MMSE linear estimation and (c) the TV-min nonlinear reconstruction algorithm. Each image has 32×32 pixels and was reconstructed from 160 measurements. ... 112
Figure. 5.16 Schematic diagram of new generation spinning disk which is made of a
XII
measurements. ... 114
Figure. 5.18 (a) Normal sample images used in IR experiments, and their
corresponding IR images reconstructed using (b) MMSE linear estimation and (c) the TV-min nonlinear reconstruction algorithm. Four samples from left to right: (I) Four squares of size 1×1, 3×3, 5×5, and 7×7 pixels. (II) Four straight lines whose widths are 1, 3, 5, and 7 pixels. (III) A straight line with 1-pixel-width. (IV) A straight line with 3-pixels-width. Each pixel equals to 0.33 mm in practice. ... 115
Figure. 6.1 (a) TPIscan-1000 system (TeraView Ltd, Cambridge, U.K.). (b) 3D
data cube extracted from the sample (40 layers start from 140th temporal band). ... 123
Figure. 6.2 (a) Original image. The corresponding reconstruction results using
NESTA (b)-(f) for different sampling rates at 10%, 15%, 20%, 25% and 30%, respectively. ... 124
Figure. 6.3 3D reconstruction data cube extracted from the total reconstruction
results (40 layers start from 140th temporal band) using NESTA for a 20% sampling rate... 125
Figure. 6.4 (a) Original image, (b) incomplete image, keeping only 5% of pixels.
XIII
List of Tables
Table. 3.1 The corresponding spatial resolution for different sampling rates. ... 76
Table. 3.2 Mean square error (MSE) and signal-to-noise ratio (SNR) in dB, for
different observation rates. ... 77 Table. 5.1 Comparison for current CS-THz systems. ... 116
Table. 6.1 Mean square error (MSE) and signal-to-noise ratio (SNR) in dB, for
different observation rates. ... 124
Table. 6.2 Recovery accuracy (PSNR) in dB, for two cases of MFOCUSS with
spatio-temporal dictionary (proposed), and MFOCUSS with DCT dictionary. The results are shown for different observation rates and different selection of Ld and Lr. ... 132
Table. 6.3 Recovery accuracy (PSNR) in dB, for different methods. We used Ld =
XIV
List of Publications and Conference
Presentations
Journal Paper:
[1] H. Shen, L. Gan, N. Newman, Y. Dong, C. Li, Y. Huang and Y. C. Shen, "Spinning disk for compressive imaging," Opt. Lett., vol. 37, no. 1, pp. 46-48, 2012.
[2] S. C. Zhong, H. Shen, and Y. C. Shen, "Real-time monitoring of structural vibration using spectral-domain optical coherence tomography," Optics and Lasers in Engineering, vol. 49, no. 1, pp. 127-131, 2011.
[3] S. C. Zhong, Y. C. Shen, H. Shen, and Y. Huang, "FDTD study of a novel terahertz emitter with electrical field enhancement using surface Plasmon resonance," Progress in Electromagnetics Research Symposium (PIERS) Online, vol. 6, no. 2, pp. 153-156, 2010.
[4] Y. C. Shen, L. Gan, M. Stringer, A. Burnett, K. Tych, H. Shen, J. E. Cunningham, E. P. J. Parrott, J. A. Zeitler, L. F. Gladden, E. H. Linfield, and A. G. Davies, "Terahertz pulsed spectroscopic imaging using optimized binary masks," Appl. Phys. Lett., vol. 95, no. 23, 231112, 2009.
Conference Presentations:
[5] H. Shen, V. Abolghasemi, L. Gan and Y. C. Shen, "Compressive
three-dimensional (3D) terahertz imaging," accepted by Institute of Physics' conference in optics and photonics, Photon12, 2012.
[6] H. Shen, L. Gan, N. Newman, and Y. C. Shen, "Fast compressive terahertz imaging," Signal Processing with Adaptive Sparse Structured Representations (SPARS), Edinburgh, Scotland, UK, 2011.
[7] H. Shen, N. Newman, L. Gan, S. C. Zhong, Y. Huang and Y. C. Shen, "Compressed terahertz imaging system using a spin disk," 35th IEEE International Conference on infrared, millimeter, and terahertz waves, Rome, Italy, 2010.
[8] S. C. Zhong, Y. C. Shen, H. Shen, R. K. May, M. Evans, J. A. Zeitler, and I. Warr, "Near-Infrared Spectroscopy for Non-destructive coating analysis calibrated by terahertz pulsed imaging," 35th IEEE International Conference on Infrared, Millimeter, and Terahertz Waves, Rome, Italy, 2010.
XV
[10] S. C. Zhong, H. shen, Y. C. Shen, J. A. Zeitler, L. Ho, M. Evans, P. T. Taday, M. Pepper, T. rades, K. C. Gordon, R. Muller and P. Kleinebudde, "Noninvasive 3D characterization of Layered samples using Terahertz pulsed imaging and infrared optical coherence tomography," 34th IEEE International Conference on Infrared, Millimeter, and Terahertz Waves, Busan, Korea (South), 2009.
XVI
Abbreviations
2D: two-dimensional 3D: three-dimensional
ADC: analog-to-digital converter API: active pharmaceutical ingredient AR(1): autoregressive model of order 1 ATR: attenuated total reflection
BS: beam splitter
BWO: backward wave oscillator CCD: charge-coupled device
CMOS: complementary metal-oxide semiconductor
CS: compressed/compressive sensing/sampling
CW: continuous wave DAQ: data acquisition
DCT: discrete cosine transform DFG: difference-frequency generation DMD: digital micro-mirror device DSP: digital signal processing EO: electro-optic
FEL: free electron laser FET: field-effect transistor FIR: far infrared
FOCUSS: focal underdetermined system solver
FRO: full random operator FTIR: Fourier transform infrared FWHM: full width at half maximum KLT: Karhunen-Loeve transform LED: light emitting diode
LTG: low-temperature-grown
MMSE: minimum mean square error MMV: multiple measurement vector MRI: magnetic resonance imaging MSE: mean square error
NEP: noise equipment power NM: number of measurements
NP: non-deterministic polynomial-time NSP: null space property
OMP: orthogonal matching pursuit PCA: photoconductive antenna PCB: print circuit board
PD: photodiode PM: parabolic mirror
PSNR: peak signal-to-noise ratio QCL: quantum cascade laser RGB: red-green-blue
RIP: restricted isometry property RNG: random number generator SDC: spinning disk configuration SFG: sum-frequency generation SMV: single measurement vector SNR: signal-to-noise ratio
SOCP's: second order cone programs SR: sampling rate
SVD: singular value decomposition TDS: terahertz time-domain
spectroscopy THz: terahertz
TPI: terahertz time-domain (pulsed) imaging
1
Chapter 1
Introduction
1.1
Motivation of the Work
As shown in Figure. 1.1, terahertz (THz) radiation refers to electromagnetic waves at
frequencies in the THz range, which lie between the high-frequency edge of the
microwave band and the long-wavelength edge of far-infrared light. Many crystalline
substances possess sharp characteristic spectral features in this frequency range,
which are associated with both inter- and intra-molecular vibrational modes [1, 2].
This, when coupled with the ability of THz radiation to propagate through common
barrier materials, such as clothing and packaging, makes THz imaging and
spectroscopy a potentially powerful tool for nondestructive determination of the
chemical composition and physical structure of a concealed sample [3]. Indeed, over
the past decade THz time-domain (pulsed) imaging has been demonstrated in
applications areas as diverse as the medical diagnosis of human tissue, the detection
and chemical mapping of illicit drugs and explosives, and pharmaceutical tablet
inspection [4-7].
Figure. 1.1 The THz range of the spectrum lies between high-frequency edge of the microwave band and the long-wavelength edge of far-infrared light.
2
rapidly since 1995. However, because of the relatively modest power levels available
from the photoconductive sources commonly used in THz time-domain spectroscopy
(THz-TDS) and imaging systems, and the lack of compact and sensitive
multi-element THz detectors, most TPI experiments have been performed by raster
scanning the object relative to a focused THz beam, and by using a single-point
detector. Consequently, a complete image usually takes minutes or even hours to
acquire, depending on the total number of pixels and the required spectral
range/resolution. This is a major limiting factor for real-time applications such as in
vivo medical and security imaging, or for on-line industrial process monitoring. Other
approaches, such as those using focal plane detector arrays, single-shot electro-optic
sensing using crossed polarizers and a charge-coupled device (CCD) camera, the
Radon transform, and interferometric imaging [8-12], respectively, have certain
limitations in speed, resolution or hardware requirement. Therefore, it is necessary to
improve the current techniques to achieve a fast, cost-effective THz imaging system.
Fortunately, a novel theory in signal processing called compressed/compressive
sensing/sampling (CS) [13, 14] has emerged over the past decade. An advantage of
CS is to sense sparse signals by reducing the sampling rate and storage of acquisition
devices. Recently Chan et al. [15, 16] reported a new THz imaging procedure, based on CS. The proposed CS-THz imaging system can solve problems such as no
conventional CCD and complementary metal-oxide semiconductor (CMOS) imagers
in the THz range and the slow data acquisition using the raster scanning approach.
The free-space time-domain (pulsed) THz wave front travelling from an object to a
single-point detector was spatially modulated by the insertion of a series of planar
two-dimensional (2D) masks. Each mask comprised a random checkerboard pattern
of 32×32 pixels which could each either transmit or block the THz radiation. By
recording the THz field in the presence of each mask, a 2D image of the object was
reconstructed [15]. This approach not only eliminates the need to raster scan the
object or THz beam, but also reduces the number of measurements required [15].
3
scanning used for THz imaging (assuming that the masks can be changed
automatically, for example, by using the newly developed THz spatial modulator
[17]).
To date, current CS-THz systems still have much room for improvement. A major
advantage of TPI is that the transient electric field, rather than the radiation intensity,
is measured as a function of time. This coherent detection scheme not only yields a
THz signal with excellent signal-to-noise ratio (SNR) and a high dynamic range, but
also preserves the important phase information. Therefore, the first problem is that
such a CS-THz system has not been proved to obtain the spectral information of the
desired sample. Secondly, as each row of sensing matrix Φ is independent, the
imaging speed is limited by the slow translation of one random pattern to another [18].
We noted that a THz spatial modulator could, in principle, be used for automatic
CS-THz imaging [17]. However, this first generation THz spatial modulator has only
4×4 pixels, limiting its practical imaging applications. The second generation 32×32
pixels THz spatial modulator is still underdeveloped. Thirdly, a fully random binary
operator incurs high computational complexity and huge memory, especially for
high-resolution imaging [16]. For example, to get a 512×512 image with 64k
measurements (i.e., 25% sampling rate), it requires several to tens of gigabytes of
storage and giga-flop operations, which is unrealistic in practice.
The motivation for this research is to further improve the performance of current
CS-THz systems. The aim is to achieve the following goals: firstly, to obtain both the
spatial distribution and the spectral characteristics of a sample using the CS-THz
system; secondly, to design specific sampling operators to minimize the sampling rate
and the computational complexity; and thirdly, to achieve high speed compressive
4
1.2
Organization of the Thesis
Chapter 2 introduces the background of two main aspects of this work: THz imaging
and CS. Section 2.1 discusses the sources and detectors of THz radiation, THz-TDS
system, THz imaging and the corresponding applications. Following a brief
introduction to CS, section 2.2 continues with a discussion of the sparse signal model.
After this, the classical properties of sensing matrices and various constructions for
structured CS matrices are reviewed. The chapter then focuses on the theory and
algorithms for sparse recovery; and concludes with a discussion of some extensions of
the sparse recovery framework.
Chapter 3 presents the simulation results for random projection on synthetic and
real-world THz data. A linear random projection procedure will be demonstrated in
this chapter. The minimum mean square error (MMSE) linear estimation was used as
the reconstruction algorithm. The reconstructed THz images from both the synthetic
and real-world THz data were subsequently acquired to obtain the desired image.
Some key aspects of compressive THz imaging, including the effect of signal-to-noise
ratio (SNR), the effect of number of measurements, and the limit of spatial resolution
etc., were investigated and will be presented in this chapter.
Chapter 4 reports on the development of a THz time-domain (pulsed) spectroscopic
imaging system using a set of independent optimized masks. The coherent detection
scheme not only yields a THz signals with excellent SNR and high dynamic range,
but also preserves the important phase information. This enabled us to measure a THz
spectrum at each pixel in the image. Such a THz spectrum can be reconstructed and
obtained by using CS. In the experiment, two well-defined absorption features were
observed in the lactose spectrum; this result agrees well with the published data. To
the best of our knowledge, this is the first time that a CS-THz system has been used to
obtain both the spatial distribution and the spectral characteristics of a sample. Also,
5
approximate the Karhunen-Loeve transform (KLT)) enables the sampling rate to be
extremely small (only 10% of the pixels are required for reconstructing an image).
The corresponding results have recently been published [18].
Chapter 5 further develops a faster and more efficient THz imaging system, based on
a single spinning disk configuration, which allows the use of an electric motor to
rotate the spinning disk, thus enabling the experiment to be performed automatically
and continuously. In the THz imaging experiment, it took about 80 seconds to
measure one THz image. We showed for the first time, to our knowledge, that a
continuously spinning disk can be used for fast compressive TPI. A second generation
spinning disk without substrate was developed to minimize the effect of the disk itself
on the THz imaging system. This new generation spinning disk, which has the
potential to achieve faster and more efficient THz imaging will be discussed. A brief
summary of current CS-THz systems is reported at the end of this chapter. The results
of this research into single spinning disk configuration have recently been published
[19, 20].
Chapter 6 describes a three-dimensional (3D) joint reconstruction approach which
has been applied to reconstruct THz images from random/incomplete subsets of THz
data. Such a random sampling method provides a fast THz imaging application which
can minimize the current THz imaging hardware implementation. We first propose to
learn a spatio-spectral/temporal dictionary from a subset of available training data.
Using this dictionary, the THz images can then be jointly recovered from an
incomplete set of observations. The corresponding results have been accepted for
publication [21].
Chapter 7 summarises the current achievements, i.e., random projection (Chapters 4
and 5) and random sampling (Chapter 6) on THz imaging. Compared with the current
CS-THz techniques, the proposed CS-THz systems have been further developed to be
6
We anticipate achieving compact design, fast computation, and easy implementation
7
References:
[1] M. Walther, B. Fischer, M. Schall, H. Helm, and P. U. Jepsen, " Far-infrared vibrational spectra of all-trans, 9-cis and 13-cis retinal measured by THz time-domain spectroscopy," Chem. Phys. Lett. vol. 332, no. 3-4, pp. 389-395, 2000.
[2] Y. C. Shen, P. C. Upadhya, E. H. Linfield, H. E. Beere, and A. G. Davies, "Temperature-dependent low-frequency vibrational spectra of purine and adenine," Appl. Phys. Lett., vol. 82, no. 12, pp. 2350-2352, 2003.
[3] A. G. Davies, A. D. Burnett, W. Fan, E. H. Linfield, and J. E. Cunningham, "Terahertz spectroscopy of explosives and drugs," Mater. Today, vol. 11, no. 3, pp. 18-26, 2008.
[4] B. B. Hu and M. C. Nuss, "Imaging with terahertz waves," Opt. Lett. vol. 20, no. 16, pp. 1716-1718, 1995.
[5] E. Pickwell, B. E. Cole, A. J. Fitzgerald, M. Pepper and V. P. Wallace, " In vivo study of human skin using pulsed terahertz radiation," Phys. Med. Biol. vol. 49, no. 9, pp. 1595-1607 , 2004.
[6] K. Kawase, Y. Ogawa, Y. Watanabe, and H. Inoue, "Non-destructive terahertz imaging of illicit drugs using spectral fingerprints," Opt. Express, vol. 11, no. 20, pp. 2549-2554, 2003.
[7] Y. C. Shen and P. F. Taday, " Development and application of terahertz pulsed imaging for non-destructive inspection of pharmaceutical tablet," IEEE J. Sel. Top. Quantum Electron. vol. 14, no. 2, pp. 407-415, 2008.
[8] A. W. M. Lee, Q. Qin, S. Kumar, B. S. Williams, Q. Hu, and J. L. Reno, "Real-time terahertz imaging over a standoff distance (>25 meters)," Appl. Phys. Lett., vol. 89, no. 14, 141125, 2006.
[9] Z. Jiang and X. C. Zhang, "Terahertz imaging via electrooptic effect," IEEE Trans. Microwave Th. Tech., vol. 47, no. 12, pp. 2644-2650, 1999.
[10] J. Pearce, H. H. Choi, D. M. Mittleman, J. White, and D. Zimdars, "Terahertz wide aperture reflection tomography," Opt. Lett., vol. 30, no. 13, pp. 1653-1655, 2005.
[11] S. Wang and X. Zhang, "Pulsed terahertz tomography," J. Phys. D: Appl. Phys., vol. 37, no. 4, pp. 964 (R31-R36), 2004.
[12] A. Bandyopadhyay, A. Stepanov, B. Schulkin, M. D. Federici, A. Sengupta, D. Gary, J. F. Federici, R. Barat, Z. H. Michalopoulou, and D. Zimdars, "Terahertz interferometric and synthetic aperture imaging," J. Opt. Soc. Am. A, vol. 23, no. 5, pp. 1168-1178, 2006.
[13] D. L. Donoho, "Compressed sensing," IEEE Trans. Inf. Theory, vol. 52, no. 4, pp. 1289-1306, 2006.
[14] E. J. Candès, J. Romberg, and T. Tao, "Robust uncertainty principles: Exact signal reconstruction from highly incomplete frequency information," IEEE Trans. Inf. Theory, vol. 52, no. 2, pp. 489-509, 2006.
8
Mittleman, "A single-pixel terahertz imaging system based on compressed sensing," Appl. Phys. Lett., vol. 93, no. 12, 121105, 2008.
[16] W. L. Chan, M. L. Moravec, R. G. Baraniuk, and D. M. Mittleman, "Terahertz imaging with compressed sensing and phase retrieval," Opt. Lett. vol. 33, no. 9, pp. 974-976, 2008.
[17] W. L. Chan, H. T. Chen, A. J. Tayler, I. Brener, M. J. Cich, and D. M. Mittleman, "A spatial light modulator for terahertz beams," Appl. Phys. Lett., vol. 94, no. 21, 213511, 2009.
[18] Y. C. Shen, L. Gan, M. Stringer, A. Burnett, K. Tych, H. Shen, J. E. Cunningham, E. P. J. Parrott, J. A. Zeitler, L. F. Gladden, E. H. Linfield, and A. G. Davies, "Terahertz pulsed spectroscopic imaging using optimized binary masks," Appl. Phys. Lett., 95, no. 23, 231112, 2009.
[19] H. Shen, N. Newman, L. Gan, S. C. Zhong, Y. Huang and Y. C. Shen, "Compressed terahertz imaging system using a spin disk," 35th International Conference on infrared, millimeter, and terahertz waves, Rome, Italy, 2010. [20] H. Shen, L. Gan, N. Newman, Y. Dong, C. Li, Y. Huang and Y. C. Shen,
"Spinning disk for compressive imaging," Opt. Lett., vol. 37, no. 1, pp. 46-48, 2012.
9
Chapter 2
Background
2.1
Terahertz Imaging
Many challenges, such as a lack of suitable sources, sensitive detectors, and other
components for the manipulation of radiation in terahertz (THz) range, limited the
evolutions in the field of THz in the 1960s-1970s. However, in the 1980s, the
development of the femtosecond laser provided an alternative way to conduct
spectroscopy in the THz range. This method, which relies on the optical excitation of
photoconductive dipole antennas, is so-called THz time-domain spectroscopy
(THz-TDS) [1-4]. The first images acquired using THz-TDS, as shown in Figure. 2.1,
were reported by Hu and Nuss in 1995 [5, 6]. This is an impressive milestone and
leads the subsequent evolutions of THz imaging techniques. The subsequent
developments of THz imaging are mainly based on THz-TDS, which is closely linked
to the ultrafast laser technology, especially to the development of the Ti:sapphire
femtosecond laser [7]. The following sections will discuss THz sources, THz
detectors, THz-TDS, THz imaging and its applications.
10
2.1.1
THz Sources
This section discusses several general sources for THz generation: photoconductive
emitter, optical rectification, photomixing sources (continuous-wave (CW)
generation), the backward wave oscillator (BWO), the far infrared laser (FIR laser),
the quantum cascade laser (QCL), and the free electron laser (FEL).
A. Photoconductive emitter
Currently, the most widely used broadband time-domain (pulsed) THz sources are
ultrashort laser driven THz emitters based on frequency down-conversion from the
optical region [8]. Photoconduction, one of the most common approaches, is based on
a photoconductive switch on a semiconductor substrate excited by a femtosecond
laser pulse. The dynamics of the transient current that generated the electromagnetic
field determines the frequency content. Therefore, a current transient that evolves on
the timescale of a few hundred femtoseconds to a few picoseconds will generate a
radiation in the THz range [9]. Figure 2.2 presents the practical implementation of a
biased photoconductive switch/antenna for generation of THz pulses [10, 11]. The
metallic electrodes provide the bias field to the photoconductive gap between these
two electrodes. When impinging the femtosecond laser pulses onto the gap, the
current impulses will be generated. High energy photons can excite electrons across
the electronic bandgap of the photoconductor into the conduction band. Using
femtosecond laser pulses, the resulting current transients will generate the THz pulses
that are emitted by a THz dipole antenna structure. More details for generation and
detection of THz pulses from biased semiconductor antennas can be found in previous
11
Figure. 2.2 Photoconductive antenna for generation of broadband THz pulses.
B. Optical Rectification
Another common method for generating broadband THz radiation is optical
rectification, which is based on an electro-optic crystal by difference-frequency
mixing of the frequency components of a femtosecond laser pulse [9]. The generation
of THz radiation by nonlinear frequency mixing of laser beams was first demonstrated
by mixing in LiNbO3 and quartz in 1969 [13]. Over the past forty years, many papers
have proposed this method using various materials, such as LiNbO3 and LiTaO3,
GaAs and CdTe, and ZnTe, to achieve ultrabroadband generation of THz pulses
[14-21]. The current ‘hotspot’ of this area is the generation and detection of ultrashort
THz transients by four-wave mixing in the focal region of intense laser fields [22-24].
The generation of THz radiation by short laser pulses requires efficient
difference-frequency mixing of all the frequency components within the spectrum of
the laser pulse. Thus, a distribution of difference frequencies in the time domain
appears as an electric field transient with a shape similar to the envelope of the laser
pulse. This process has since been referred to as optical rectification. Two factors, the
bandwidth of the excitation pulse and the phase matching between the near-infrared
[image:28.595.174.406.79.294.2]12
of the generated THz transient [9]. In the nonlinear crystal, the THz photons interact
with the pump photons and create sidebands to the pump frequencies by difference-
and sum- frequency generation (DFG and SFG), respectively. Note that this SFG
process, which leads to the electro-optic effect, is widely used for optical detection
[9].
By using both photoconduction and optical rectification approaches, the typical
frequency range of generated THz radiation is from 0.1 to 3 THz or higher, depending
on the laser pulse parameters. The average power levels range from nanowatts to
hundred microwatts, and pulse energies are typically in the femtojoule to nanojoule
range [8].
C. Photomixing Sources
Photomixing is the generation of CW THz radiation from two lasers. Such a THz
generation approach delivers an outstanding performance if spectral resolution is the
primary concern. It is a complementary method for photoconductive generation. Note
that, compared with photoconductive broadband time-domain (pulsed) THz
generation, no femtosecond laser is required in the CW systems. The output of two
frequency stabilized lasers is spatially overlapped in a photomixer and focused onto a
biased photoconductive antenna (PCA) with an optimized electrode geometry [25].
Thus, the mixing of these two incident waves is exploited to generate a CW THz
radiation, which oscillates with two different frequencies of two incoming waves
[26-28]. After detuning one of the lasers, the emission frequency can be swept in a
wide spectral range. Both the amplitude and the phase of the CW THz radiation can
be detected coherently with a homodyne detection scheme [26, 29].
The general principle for CW THz generation is similar to that for photoconductive
broadband generation. Two CW lasers with identical polarization are required; the
13
The co-linear lasers are then used to illuminate the photoconductive THz emitter.
Subsequently, the desired THz radiation with frequency THz 12 is generated.
A Silicon hyper-hemispherical lens is used to collimate the THz beam. Note that the
linewidth and stability of the two lasers determine the spectral resolution of the CW
THz generation. Thus, the spectral resolution offered by CW THz spectroscopy is
[image:30.595.157.419.251.463.2]significantly higher than any other techniques in the THz range [9].
Figure. 2.3 Schematic diagram of two-beam photomixing with a photomixer.
D. Backward Wave Oscillator (BWO)
The BWO, also called backward wave tube, is a vacuum tube that is used to generate
THz radiation [30]. An electron gun generates an electron beam that is interacting
with a slow wave structure. The generated THz radiation has its group velocity
directed opposite to the direction of motion of the electrons (i.e., the phase velocity of
the wave is positive and the group velocity is negative). BWOs can operate in the THz
region at moderate power levels (1-100 mW). A number of BWOs can be
implemented and integrated into a system to generate a wide frequency range of THz
radiation. A photo of BWO source which provides electromagnetic radiation at a
14
Figure. 2.4 A photo of BWO source (Insight Productive Company, USA) which provides electromagnetic radiation at 0.14 THz.
E. Far Infrared (FIR) Laser
The FIR gas laser is relatively old coherent source developed in the THz region. It is
an optically pumped laser which consists of a long waveguide filled with gaseous
organic molecules. The most widely used gas is methanol, which provides a powerful
(typically 100 mW) emission line at 118 μm [8]. Such FIR laser is line-tuneable in the
range of 0.3 to 5 THz. Because it is inefficient, often requires helium cooling, and is
only line-tuneable, the FIR laser technology has seen only modest development in
recent years.
F. Quantum Cascade Laser (QCL)
QCL is a semiconductor laser that emits in the mid- to far-infrared region. It has been
demonstrated as a relatively new source developed in the THz spectrum, but until
very recently several significant problems had prevented THz QCLs from being
realized. The main problems are caused by the long wavelength of THz radiation.
This results in a large optical mode, which results in poor coupling between the small
gain medium and the optical field, and in high optical losses, owing to free electrons
in the material [31]. The first QCL to operate in the THz region was developed by
NEST-Pisa and the Cavendish Laboratory [32]. Such THz QCL emitted at 4.4 THz,
providing about 2 mW of average power. They addressed the above and other
problems in an innovative design. This system demonstrated pulsed operation at a
temperature of 10 K (requires helium cool); however, the optimized fabrication
promises to lead to CW operation at a temperature of 70 K (liquid nitrogen
15
research groups, such as MIT and the University of Leeds [33, 34].
G. Free Electron Laser (FEL)
The FEL with energy-recovering linear accelerators provides extremely high-power
THz emissions [35]. Unlike gas, liquid or solid-state lasers, in which electrons are
excited in bound atomic or molecular states, FELs use a beam of high-velocity
bunches of electrons propagating in a vacuum through a strong, spatially varying
magnetic field [31]. The magnetic field causes the electron bunches to oscillate and
emit photons. The FEL has an extremely wide frequency range and is widely tuneable.
Also, it may generate CW or pulsed waves, and provides an average brightness of
more than six orders of magnitude higher than typical photoconductive emitters.
However, such systems require prohibitive costs, space and a dedicated facility.
Note that both the photoconductive emitter and BWO THz sources were used in our
after-mentioned experiments to generate both broadband and single frequency THz
radiation.
2.1.2
THz Detectors
Corresponding to the THz sources, several methods for THz detection are discussed
here, including photoconductive sampling, free-space electro-optic sampling, thermal
detectors (including bolometers), heterodyne detectors, extrinsic germanium detectors,
and field-effect transistor (FET) detectors.
A. Photoconductive Sampling
One of the most common methods for broadband time-domain (pulsed) THz detection
can be done by photoconductive detector. It has the same structure as the
photoconductive emitter, whereas the only difference is that the detector antenna is
16
and used to excite the detector structure. The detected THz pulses supply the electric
field which required driving a photocurrent in the antenna. This photocurrent can be
presented as a convolution of the electric field acquired by the antenna and the
transient photoconductivity acquired by the gate pulse [9]. When the transient
photoconductivity is much faster than the duration of the THz field, the photocurrent
is proportional to the THz field strength. Oppositely, with long-live photoconductivity,
the photocurrent is proportional to the temporal integral of the THz field. Therefore,
the trapping and recombination time of the photoinduced carriers determines the
bandwidth of the detector, and the transient photoconductivity can be treated as a
low-pass filter function that is applied to the frequency spectrum of the THz pulse
incident on the detector [9].
The material of the photoconductive detector is important for acquiring a high
bandwidth of the detected THz signal. In 1988, radiation-damaged silicon-on-sapphire
was used as photoconductive material [2]. Currently, low-temperature-grown (LTG)
GaAs with a few hundred femtosecond carrier lifetimes is popular [36-39]. Other
materials with smaller bandgaps, such as LTG-GaAsSb [40], LTG-InGaAs [41],
superlattice structures with LTG-InGaAs/InAlAs [42, 43] and ion-implanted InGaAs
[44-46], have also been proposed.
B. Free-Space Electro-Optic Sampling
The electro-optic (EO) sampling, another common method for broadband
time-domain (pulsed) THz detection, is a coupling between a low-frequency electric
field (i.e., THz pulse) and an optical pulse (the laser beam). As shown in Figure. 2.5,
the THz electric field modulates the birefringence of the sensor crystal; and this in
turn modulates the polarization ellipticity of the laser beam [31]. The probe
polarization evolves into an almost circular, but elliptical, polarization after a λ/4 plate.
A Wollaston prism splits the probe beam into two orthogonal components, which are
sent to a balanced photo-detector. The ellipticity modulation of the laser beam, i.e.,
17
used to analyze the information on both the amplitude and phase of THz pulse. The
materials of such electro-optic method have already been studied in the
aforementioned broadband THz sources based on an electro-optic crystal. Note that
the noise equivalent power (NEP) of both photoconductive and electro-optic detectors
is around 10-15 W/Hz1/2; and the operating temperatures are both at room temperatures. Such EO sampling approach is used in our after-mentioned experiment to detect the
broadband time-domain (pulsed) THz radiation.
Figure. 2.5 Schematic diagram of a typical setup for free-space EO sampling.
C. Thermal Detectors
Many types of thermal detectors, such as bolometers, Golay cells, and pyroelectric
detectors, can be used in the THz region [47]. Due to the low output power of THz
sources, most of these systems require cooling to reduce the relatively high levels of
thermal background radiation. Such approaches can reach NEP=10-17 W/Hz1/2 at an extremely low temperature - about 4 K and below. In a specific case, using the
hot-electron Titanium nanobolometers, the NEP can reach 3×10-19 W/Hz1/2 at 0.3 K [48]. The operation principles of thermal detectors have been described in various
research [49]. Some of the thermal detectors can operate at room temperature,
whereas the NEP is relatively larger. A photo of one of the pyroelectric detectors is
shown in Figure. 2.6; and note that this pyroelectric detector is used in our
after-mentioned experiment to detect the single frequency THz radiation from a BWO
18
Figure. 2.6 A photo of pyroelectric detector (SPH-49, Spectrum Detector Inc. USA). NEP=3×10⁻⁹ W/Hz1/2 .
D. Heterodyne Detectors
Heterodyne detectors are used in applications requiring very high spectral resolution
of the detector. A local oscillator source at the THz frequency is mixed with the
received THz signal in these systems. The downshifted signal is then amplified and
recorded [31]. A Schottky-diode mixer has been reported for sensing applications at
2.5 THz [50]. Cryogenic cooling can be used for higher sensitivity in heterodyne
detectors. The most widely used is the superconductor-insulator-superconductor
tunnel junction mixer [51]. More details of the heterodyne detectors have been
discussed in various research [52].
E. Extrinsic Germanium Detectors
The germanium-based extrinsic photoconductor detector is the first extrinsic
photo-detector. Due to the limitation of silicon detectors (i.e., for wavelengths longer
than 40 μm there are no appropriate shallow dopants for silicon), the germanium
devices are more suitable for detecting long wavelengths. The NEP can reach a few
[image:35.595.175.421.70.319.2]19
F. Field-Effect transistor (FET) Detectors
FET detectors can be used for both resonant (single wavelength) and non-resonant
(broadband) THz detection and can be directly tuneable by changing the gate voltage.
They can operate in room temperatures where the achieved NEP is around 10-10 W/Hz1/2. The operation principle of FET has been discussed in various research [47].
2.1.3
THz Time-Domain Spectroscopy (THz-TDS)
Experimental Setup
The THz-TDS system, which allows a material's far-infrared optical properties to be
determined as a function of frequency, has been reviewed in several publications [9,
53-57]. Basically, in THz-TDS systems, the photoconduction and optical rectification
can be used for THz generation; correspondingly, the photoconductive sampling and
free-space EO sampling can be used for THz detection. The nonlinear optical
techniques (optical rectification and EO sampling) are especially advantageous in
their broadband properties and well-investigated frequency properties. However, the
photoconductive antenna has a number of materials and fabrication techniques and
may provide some complementary functions to optical rectification and EO sampling
techniques. Figure 2.7 illustrates the THz-TDS system that was used in our
experiment, using a photoconductive emitter for THz generation and the EO crystal
for THz detection. A Ti:sapphire femtosecond laser provides ultrashort
visible/near-infrared pulses. The output is split into two parts: a pump beam is used
for THz generation and a probe beam for THz detection. The optical pulse is focused
onto a biased PCA. The THz pulse generated from the PCA is collimated by the
parabolic mirrors and is finally focused onto the EO crystal. Note that, except for such
transmission THz-TDS, other implementations such as reflection THz-TDS and
attenuated total reflection (ATR) THz-TDS are also widely used in spectroscopy
20
Figure. 2.7 Schematic configuration of a full THz-TDS system for transmission spectroscopy. A photoconductive emitter is used for THz generation and an EO crystal is used for THz detection. (PM:
parabolic mirror, BS: beam splitter, PC THz emitter: photoconductive THz emitter, and EO:
electro-optic).
Data Analysis
The first application of transmission THz-TDS was proposed in 1989 on water vapour
in the ambient atmosphere [4], and subsequently the absorption coefficient and index
of refraction of a range of dielectrics and semiconductors were reported [68]. To date,
transmission THz-TDS is widely used in most THz spectroscopy measurements. The
THz-TDS systems shown in Figure 2.7 are performed in transmission configuration.
Figure. 2.8 Schematic diagram of the geometries for transmission and reflection THz spectroscopy. )
( ˆ
0
E is the incident field, Eˆt() is the transmitted field, and Eˆr() and ˆ ( )
'
r
E are the
21
The general schematic diagram of the geometries for transmission and reflection THz
spectroscopy is presented in Figure 2.8. The incident THz pulse can be described by
its spectral amplitude and phase Eˆ0(), which is obtained by Fourier transformation
of the measured THz data in time-domain. Ignoring the multiple reflections within the
sample, the transmitted and reflected signals in this geometry can be expressed as [9]
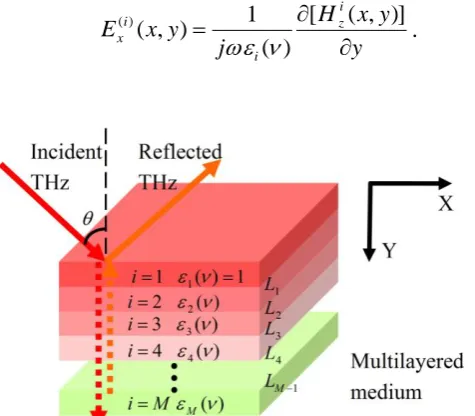
, ˆ ˆ ˆ ˆ ) ( ˆ , ˆ ˆ ) ( ˆ , ˆ ˆ ) ( ˆ ) ( ˆ / 2 / 21 23 12 0 ' 12 0 / 2 / 23 12 0 c d in d r r c d in d t e e t r t E E r E E e e t t E E (2.1)
where tˆ12, tˆ23, rˆ12, and rˆ23 are various complex Fresnel field transmission and reflection coefficients. Such transmission and reflection spectroscopy can be used to
acquire the complex index of refraction of the sample, nˆ()n()i(), where
) (
is the extinction coefficient which related to the absorption coefficient ()
through ()()c/2. In transmission THz-TDS, two THz pulses, respectively
propagating through air and the sample, are recorded and their spectral amplitudes
and phases can be compared as [9]
c d n i d i ref sam e e t t e T E
E /2 ( 1) /
23 12 )
( ˆ ˆ
) ( ) ( ˆ ) (
ˆ
. (2.2)
For analyzing the sample materials with low absorption coefficient, the Fresnel
transmission coefficients are real-valued, and at normal incidence we find [9]
d c n
) 1 ( )
( , (2.3)
)) ( 4 ) 1 ( ln( 2 ) ( 2 T n n d
. (2.4)
In Figure 2.9, an example of a typical transmission THz-TDS measurement is shown.
Figure 2.9 (a) illustrates a time trace of the THz signal, and Figure. 2.9 (b) presents
22
Figure. 2.9 (a) THz bandwidth transient recorded in the time domain and (b) its corresponding frequency spectrum.
Equations (2.3) and (2.4) are only suitable for the sample materials with vanishing
absorption and infinite thickness. For thin samples, the multiple reflections of the
signal in the sample need to be taken into account. A sequence of signal echoes will
appear following the main transmitted pulse in time domain. To solve this problem,
Duvillaret et al. proposed a general situation including a Fabry-Perot factor FP() and complex valued Fresnel transmission coefficients [69]. For a sample in air, the
generalized transmission function Tˆ() is [9, 69]
) ( ) 1 ˆ ( ˆ 4 ) ( ˆ ) ( ˆ ) (
ˆ /2 /
2 FP e e n n E E
T d in d c
ref
sam
, (2.5)
where c d in d e e n n FP / 2 ) 1 ˆ 1 ˆ ( 1 1 ) (
. (2.6)
The same authors demonstrated a method based on the presence of multiple signal
echoes to calculate the sample thickness [70]. This method improves the
determination of the optical constants, such as index of refraction, through
simultaneous determination of the sample thickness. The thickness of any material