Article
User Characteristics and Effectiveness of a Park and
Ride Facility in Bangkok
Saksith Chalermpong1,a,*, Apiwat Ratanawaraha2,b,Nichaboon Maneenoy3,c,
and Chakaphan Chullabodhi3,d
1 Department of Civil Engineering, Faculty of Engineering, and Transportation Institute,
Chulalongkorn University, 254 Phayathai Road, Patumwan, Bangkok 10330, Thailand
2 Department of Urban and Regional Planning, Faculty of Architecture, Chulalongkorn University,
254 Phayathai Road, Patumwan, Bangkok 10330, Thailand
3 Department of Civil Engineering, Faculty of Engineering, Chulalongkorn University, 254 Phayathai Road,
Patumwan, Bangkok 10330, Thailand
E-mail: a[email protected] (Corresponding author), b[email protected], c[email protected], d[email protected]
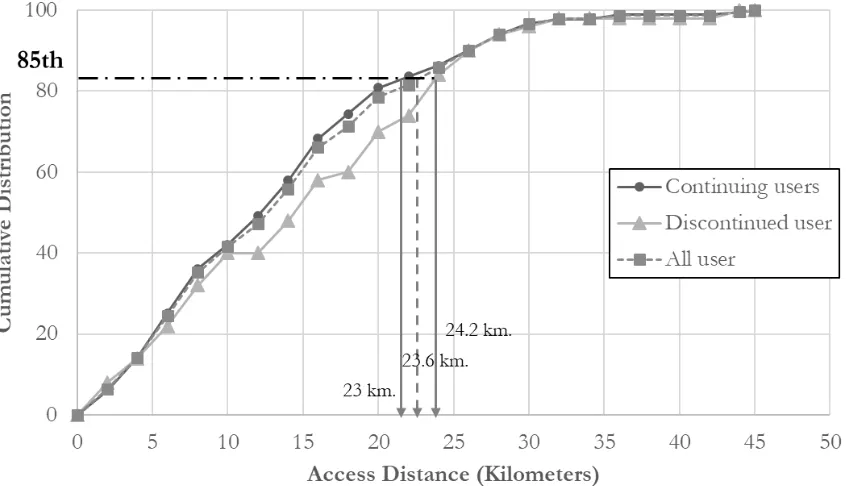
Abstract. An experimental project was initiated in Bangkok in 2015 to set up Park and Ride facilities near transit stations as part of an effort to encourage transit use. Incentives were offered to prospective users, including free one-month trial and free transit trips. This paper provides evidence on user characteristics of one of the facilities and its effectiveness in time savings and reducing car travel. After the free-trial period ended, approximately 45% of the users discontinued their use. The results from interview surveys of both continuing and discontinued users confirm time savings and reduction in car travel for a majority of users who had relied solely on cars before the modal shift. But car travel distance increased for users who previously drove to other facilities or used public transport to access transit stations. The radius of the catchment area is found to be 23.6 km. We also developed a logistic regression model of the decision to continue using the facility even after the trial period. The modeling results imply that travel time and driving distance before and after using Park and Ride clearly influence decision-making. Users with longer travel time and driving distance before using Park and Ride tend to continue using the facility.
Keywords: Park and ride, catchment area, vehicle-kilometers traveled, time savings, incentives.
ENGINEERING JOURNAL Volume 22 Issue 3 Received 9 September 2017
1. Introduction
As Bangkok expands its mass rail transit networks, Park and Ride (P&R) becomes a key component of efforts that aim to promote transit use by expanding the transit catchment area beyond distances reachable by walking, bicycling, and public transport. The Mass Rapid Transit Authority of Thailand (MRTA) has built 12 P&R facilities near its subway stations in Bangkok. According to an MRTA report, its current P&R capacity cannot accommodate the excess demand for P&R [1]. But there is scant empirical evidence on P&R usage in the city, such as user profiles, travel behaviors of P&R users, the effects of pricing on prospective users, and the benefits to society through reducing car travel. This underlies the pressing need to produce evidence to help guide the planning and investment of P&R facilities in the city.
Meanwhile, the global literature on P&R has examined a number of key aspects, including catchment areas [2, 3], locational considerations [4, 5], user characteristics [6, 7], and reasons for success [8]. In terms of car travel, a number of existing studies confirm the correlation between P&R availability and the reduction in car travel. For instance, a survey of 150 P&R facilities in the United States indicated vehicle miles traveled (VMT) savings due to P&R availability [9]. A number of studies also point to the benefits of P&R in reducing driving and greenhouse gas (GHG) emissions [10]. But other studies also challenge such notion. Car travel may still account for a long part of the trip, limiting the contribution to GHG reduction [11]. Because the P&R availability increases car mobility, this may facilitate the modal shift for access trips from public transport, walking and bicycling to private cars. The so-called “abstraction effect” occurs when commuters who previously use only public transit shift to driving for access trips when P&R is available [12, 13].
While such literature provides general information and insights about P&R facilities, an effective P&R planning and implementation requires city-specific evidence that reflects the actual user characteristics and the factors that determine users’ decisions. The current literature is mostly based on experiences in the United States and Europe, not so much from developing countries, especially in cities where transit-oriented development is gaining ground and where P&R facilities are being built.
Such is the case with Bangkok. In 2015, an experimental project was initiated in the city to set up P&R facilities near transit stations as part of a city-wide effort to reduce reliance on private cars and to encourage transit use. Incentives were provided to prospective users for a few months. After the free-trial period and the incentives ended, a number of users stopped using the P&R facilities. But a large proportion of users have continued to pay and use the service. The data gathered for the experimental project are useful, not only for academic inquiry but also for practical purposes, as the city considers options for developing a comprehensive transport policy in general, and a P&R policy in particular.
This paper provides a summary of the findings that the research team gathered and analyzed as part of the experiment. The key objectives of the paper are threefold: to analyze P&R user characteristics; to examine the effectiveness of P&R in terms of car-travel reduction and time savings; and to examine the factors affecting users’ decisions to continue or discontinue to use the facilities after the incentives ended. The following sections provide the background, research design and methodology, and research findings. We conclude the paper with a discussion on the implications for parking policy in the context of transit-oriented development in Bangkok.
2. Overview of The Park & Ride Experiment Project
An experimental project to provide P&R facilities along transit lines was conducted as part of the Bangkok’s Sathorn Model program of the Sustainable Mobility 2.0 initiative of the World Business Council for Sustainable Development. Locally funded by the Toyota Mobility Foundation, the program includes a number of projects that aim to reduce the reliance on private cars and use more public transport, including school shuttle buses, flexible work hours, and traffic flow management.
The P&R project provides P&R facilities near transit stations in the outer areas of Bangkok by utilizing undeveloped private land plots and underused parking lots of nearby supermarkets and shopping malls. As of May 2016, the project facilities can accommodate up to 2,613 cars in 14 locations. This paper focuses on the P&R facility located next to Krungthonburi BTS station, primarily because 290 out of 320 users in the overall P&R project are users of the Krungthonburi P&R Facility. The facility accommodates a total of 290 cars, 122 of which are under roof, with automatic barrier gates, 24-hour security guards, lighting, and bathrooms.
area, the travel time by car is excessive, with average speed of 5.1 km/h during peak hours [14]. This is due to the bottleneck at Taksin Bridge, one of the few river-crossing bridges that connect the western suburbs to central Bangkok. A P&R facility at Krungthonburi provides a good alternative for commuters who want to avoid delay on the bridge and congested Sathorn and Silom roads. Notably, the Krungthonburi P&R facility accounts for only 11% of the overall P&R program capacity but as many as 90% of the participants. This indicates an uneven distribution of P&R capacity relative to the potential time savings from switching to P&R. Meanwhile, the full-capacity operation at the Krungthonburi site and the overflow parking in nearby areas also indicate the inadequacy of P&R capacity relative to Taksin Bridge trips.
Fig. 1. Locations of Krungthonburi P&R and Bangkok’s CBD.
A few service options and rates were available, with incentives being offered to entice prospective users, as follows.
1. Free trial for one month during August 27 - October 30, 2015;
2. Monthly membership: Free of charge during the first month. A monthly fee of 1,605 baht (US$45) for subsequent months until December 31, 2016. Members received a transit card with 50 free trips on the BTS transit system preloaded (worth 1,250 baht or US$35) every month;
3. Daily use: Non-member are allowed to use the park and ride facility, with a flat fee of 80 baht per day (US$2.3) from November 18, 2015;
4. Monthly fee reduced to 1,070 baht (US$30) from 1 March 2016 without free transit trips; and 5. Open 24/7 from 1 March 2016, with an hourly rate of 20 baht (US$0.60) and discount rates for evening and overnight hours.
Note that to be eligible to apply for monthly membership and receive incentives, applicants must show proofs that they work at locations near BTS stations and will use the P&R facility to commute to work. This is to prevent the use of the facility as a regular parking lot by those living nearby.
3. Research Questions, Hypotheses, and Data Collection
The key research questions are: (1) How effective is P&R in reducing car travel? and (2) Are there any differences in terms of user characteristics between users who continue using P&R and those who discontinued the use after the free trial period? We hypothesize that the vehicle kilometers traveled (VKT) would be shorter after the users participated in the experiment and that travel time and driving distance are the key factors that determine whether a user would continue to use P&R.
[image:3.595.70.525.190.413.2]survey did not include members who pay discount monthly rate of 1,070 baht, because there were only 8 of them. Neither did we include non-members who pay to use the facility on the daily or hourly basis, because they did not receive any incentives.
Because we have detailed records of both continuing and discontinued monthly members, we were able to conduct stratified random sampling. We were able to interview almost 76% of the total continuing users, while conducting simple random sampling for the discontinued group. We interviewed the target continuing users in the morning and evening at the P&R site. For those who did not have time in the morning, we asked them to fill in the questionnaire during the day and return it in the evening.
4. Research Findings
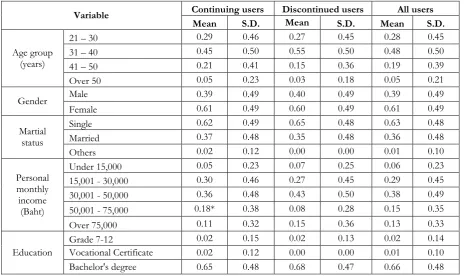
4.1. Characteristics of Users
The largest number of users are in the 30s age group, followed by those in their 20s. There are more female users than male, and more single than married users. In terms of income, a large majority of users could be categorized as middle-income. Unsurprisingly, 97% of the users have tertiary education, corresponding with the level of income and car affordability. A large majority of the respondents (77%) did not change either their residential or job locations within one year before using P&R, while 17% had changed job locations. Almost three quarters of them had previously driven directly from home to work, and another 8% drove to other P&R facilities before shifting to the one in question.
4.2. Shifts in Mode and Residential/Work Locations
We further categorize the P&R users into groups according to the mode they used before using the P&R facility and whether or not they had changed their residential and/or job locations within one year before the P&R use. As shown in Table 2, a large majority (74%) of all users had relied primarily on private cars before the modal shift. The P&R facility also attracted two unintended groups of users, those who previously drove to other P&R facilities (8%) and those who previously used public transit to access the station (19%). The significant share of these two groups may undermine the effectiveness of building new P&R facilities as a mean to reduce driving.
Table 1. Descriptive statistics of P&R user data.
Variable Continuing users Discontinued users All users
Mean S.D. Mean S.D. Mean S.D.
Age group (years)
21 – 30 0.29 0.46 0.27 0.45 0.28 0.45
31 – 40 0.45 0.50 0.55 0.50 0.48 0.50
41 – 50 0.21 0.41 0.15 0.36 0.19 0.39
Over 50 0.05 0.23 0.03 0.18 0.05 0.21
Gender Male 0.39 0.49 0.40 0.49 0.39 0.49
Female 0.61 0.49 0.60 0.49 0.61 0.49
Martial status
Single 0.62 0.49 0.65 0.48 0.63 0.48
Married 0.37 0.48 0.35 0.48 0.36 0.48
Others 0.02 0.12 0.00 0.00 0.01 0.10
Personal monthly income
(Baht)
Under 15,000 0.05 0.23 0.07 0.25 0.06 0.23
15,001 - 30,000 0.30 0.46 0.27 0.45 0.29 0.45
30,001 - 50,000 0.36 0.48 0.43 0.50 0.38 0.49
50,001 - 75,000 0.18* 0.38 0.08 0.28 0.15 0.35
Over 75,000 0.11 0.32 0.15 0.36 0.13 0.33
Education
Grade 7-12 0.02 0.15 0.02 0.13 0.02 0.14
[image:4.595.67.534.487.763.2]Variable Continuing users Discontinued users All users
Mean S.D. Mean S.D. Mean S.D.
Master's degree or higher 0.31 0.47 0.30 0.46 0.31 0.46
Changes in residential and job locations
No changes 0.74* 0.44 0.85 0.36 0.77 0.42
Job location only 0.19 0.39 0.13 0.34 0.17 0.38 Residential locations only 0.05 0.23 0.02 0.13 0.04 0.20
Both 0.02 0.12 0.00 0.00 0.01 0.10
Transport modes prior to using the P&R facility
Private cars only 0.73 0.45 0.75 0.44 0.73 0.44 Private cars to other P&R
facilities and BTS 0.05 0.23 0.13 0.34 0.08 0.27 Public Transport 0.22* 0.42 0.12 0.32 0.19 0.39 Parking
subsidy recipient
Getting a free parking or
monthly discount 0.27* 0.45 0.52 0.50 0.35 0.48
Destination station
Silom line stations 0.55 0.50 0.64 0.48 0.58 0.50 Sukhumvit line stations 0.36* 0.48 0.19 0.40 0.30 0.46 Siam/Nat’l stadium station 0.03 0.18 0.03 0.18 0.09 0.18
MRT station 0.06 0.24 0.14 0.35 0.03 0.28
Egress modes
Walk 0.83 0.38 0.90 0.30 0.85 0.36
Motorcycle taxi 0.15 0.36 0.10 0.30 0.13 0.34
Others 0.02* 0.16 0.00 0.00 0.02 0.13
Frequency of BTS use (trips per month) 26.73* 17.86 12.57 17.50 22.26 18.89
Sample size 131 60 191
*Statistically significant difference from discontinued users at the 90% level.
Note: The mean value for each categorical variable, such as age group and gender, represents the proportion of sample that belongs to that category. For example, the mean value for male of 0.39 implies that 39% of the sample is male.
4.3. Catchment Area
Fig. 2. Cumulative distribution of access distance to P&R.
4.4. Trip characterisrics and travel time savings
In testing the effect of P&R on VKT, we focus on the users without any changes in residential and/or job locations. This is because those with changes in residential and/or job locations have other reasons than availability of P&R that may affect their modal choice decisions, presumably more than those without such locational changes. We also focus on commuting trips from residence to work, instead of the trips from work back home, because the latter tend to include many other sub-trips, such as grocery shopping, dining out, etc. The data suggest that the average VKT of P&R users who had previously driven from home all the way to work decreased from an average of 20.67 km to 15.7 km with an average reduction of 4.97 km. The total travel time also decreased from an average of 97.89 minutes to 89.38 minutes. The data confirm that P&R indeed helped reduce the VKT and the total travel time of this particular group of users. The average reduction in driving distance reflects that average distance from the P&R location to job destinations located mostly in the Silom-Sathorn CBD area. The small reduction in total travel time shows that travel time saving by modal shift is offset by transfer time at the origin station and egress time from the destination station to office.
Table 2. Transport Modes Prior to Using the P&R Facility
Transport modes prior to using the P&R facility
No changes in
residential/job locations residential/job locations With Changes in
Total
Number of users (%) Number of users (%)
Continuing
users Discontinued users Continuing users Discontinued users
Private cars only 70 (48.0) 40 (27.4) 25 (58.0) 5 (11.6) 140 (74.1) Private cars to other P&R
[image:6.595.87.510.109.352.2]Passenger vans and BTS 4 (2.7) 2 (1.4) 0 (0.0) 0 (0.0) 6 (3.2) Buses and BTS 10 (6.8) 4 (2.7) 2 (4.7) 0 (0.0) 16 (8.5) Motorcycle taxis and BTS 2 (1.4) 0 (0.0) 0 (0.0) 0 (0.0) 2 (1.1)
Taxis and BTS 3 (2.1) 0 (0.0) 0 (0.0) 0 (0.0) 3 (1.5)
Walking and BTS 0 (0.0) 0 (0.0) 2 (4.7) 0 (0.0) 2 (1.1)
Total 96 (65.8) 50 (34.2) 34 (79.1) 9 (20.9) 189 (100)
Sample size 146 (100) 43 (100)
Table 3. Changes in Access Distance and Travel Time by User Group
No locational changes & only driving
Continuing users Discontinued users All users
Mean S.D. Mean S.D. Mean S.D.
Access distance
by car (km)
before P&R 20.38 8.26 21.17 9.18 20.67 8.57
after P&R 14.83 8.21 17.22 9.72 15.7 8.82
Pairwise difference -5.55** 4.32 -3.95* 5.05 -4.97* 4.64 Travel
time (mins.)
before P&R 97.73 33.5 98.16 34.38 97.89 33.66 after P&R 87.06 30.84 93.29 30.23 89.38 30.62 Pairwise difference -10.67** 27.69 -4.87 20.68 -8.51* 25.36
Sample size 63 40 103
No locational changes & using public transport
Continuing users Discontinued users All users
Mean S.D. Mean S.D. Mean S.D.
Access distance
by car (km)
before P&R 0.00 0.00 0.00 0.00 0.00 0.00
after P&R 12.67 9.48 12.51 8.79 12.63 9.16 Pairwise difference 12.67* 9.48 12.51* 8.79 12.63* 9.16 Travel
time (mins.)
before P&R 91.19 39.43 100.71 24.57 93.57 36.10 after P&R 82.57** 28.92 102.86 18.22 87.64 27.81 Pairwise difference -8.62 27.53 2.14 40.09 -5.93 30.68
Sample size 22 7 29
No locational changes & Private cars to other P&R facilities and BTS
Continuing users Discontinued users All users
Mean S.D. Mean S.D. Mean S.D.
Access distance
by car (km)
before P&R 11.54 10.96 15.00 7.27 13.08 9.12 after P&R 12.34 7.38 18.23 7.34 14.96 7.55 Pairwise difference 0.80 4.42 3.23 2.91 1.88 3.82 Travel
time (mins.)
before P&R 89.00 33.62 117.50 42.72 101.67 38.41 after P&R 90.00 27.61 103.75 32.50 96.11 28.81 Pairwise difference 1.00 7.42 -13.75 72.73 -5.56 45.51
Sample size 5 4 9
Notes: *Statistically significant difference from zero at the 90% level.
**Value is also significant difference from discontinued users at the 90% level.
We further disaggregated the data into two groups of users, namely, continuing and discontinued users. We find that the average VKT and the total travel time decreased when both groups started using P&R. But the average reduction in VKT and total travel time for the continuing users are greater and statistically significant, whereas those for the discontinued users are smaller and not statistically significant. Such differences may explain why certain users continue to use P&R while others opted out.
are different. On average, those who continue to use P&R experienced a shorter total travel time (8.62 min.) after the mode shift, while those who discontinued experienced slightly longer total travel time (2.14 min.)
Users who switched from other P&R locations to use the Krungthonburi facility experienced small increases in VKT, with an average of 1.88 km and S.D. of 3.82 km. As expected, users in this group who continued to use P&R after the trial period experienced smaller increase in VKT than those who discontinued. However, the changes in total travel time are unexpected as those who continue experienced slightly longer total travel time, but those who discontinued experience shorter travel time after modal shift to P&R. The results for this group are probably not as reliable as those for the previous two groups because of a small sample size. These findings are interesting and important, as they underlie the possibility that P&R could increase car travel distance and travel time, possibly because P&R makes it easier to drive for certain user groups.
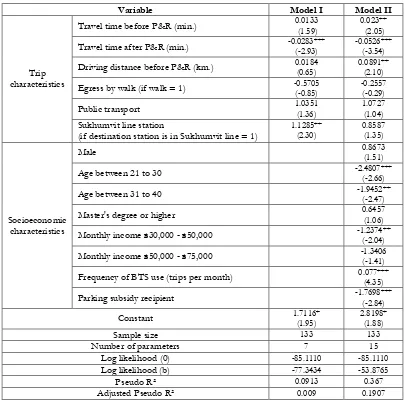
Table 4. Logit model results for the likelihood of continuing to use the P&R facility.
Variable Model I Model II
Trip characteristics
Travel time before P&R (min.) 0.0133 (1.59) 0.023** (2.05) Travel time after P&R (min.) -0.0283*** (-2.93) -0.0526*** (-3.54) Driving distance before P&R (km.) 0.0184 (0.65) 0.0891** (2.10) Egress by walk (if walk = 1) -0.5705 (-0.85) -0.2557 (-0.29) Public transport 1.0351 (1.36) 1.0727 (1.04) Sukhumvit line station
(if destination station is in Sukhumvit line = 1) 1.1285** (2.30) 0.8587 (1.35)
Socioeconomic characteristics
Male 0.8673 (1.51)
Age between 21 to 30 -2.4807*** (-2.66)
Age between 31 to 40 -1.9452** (-2.47)
Master's degree or higher 0.6457 (1.06)
Monthly income ฿30,000 - ฿50,000 -1.2374** (-2.04)
Monthly income ฿50,000 - ฿75,000 -1.3406 (-1.41)
Frequency of BTS use (trips per month) 0.077*** (4.35)
Parking subsidy recipient -1.7698*** (-2.84)
Constant 1.7116* (1.95) 2.8198* (1.88)
Sample size 133 133
Number of parameters 7 15
Log likelihood (0) -85.1110 -85.1110
Log likelihood (b) -77.3434 -53.8765
Pseudo R² 0.0913 0.367
Adjusted Pseudo R² 0.009 0.1907
4.5. Determinants of Users’ Decision
[image:8.595.95.500.249.651.2](LRT) [21], Model I, which is a restricted version of Model II, can be rejected. Therefore, Model II was selected for further interpretation of the results.
The coefficient estimates of Model II show expected signs, but only a few coefficients are statistically significant. Travel time and driving distance before and after using the P&R facility clearly influence decision-making. Users who experienced longer travel time and driving distance before using P&R tend to continue using P&R where as those who experienced longer travel time after using P&R tend to discontinue. However, coefficients of dummy variables that represent travel mode used before using P&R and destination stations are not significant. As for socioeconomic characteristics of decisionmakers, some variables have significant coefficients, including dummy variables representing age group 21 to 30 and 31 to 40 years old, monthly income between 30,000 to 50,000 baht, frequency of BTS use prior to using P&R, and dummy variable representing availability of parking subsidy at work location.
5. Conclusions and Policy Implications
With the data collected for an experimental P&R initiative in Bangkok, we are able to provide quantitative evidence on P&R user characteristics in the city and to confirm the effectiveness of P&R on time savings and reduction in car travel distance for a majority group of users. The results from the analyses of changes in access trip by groups show that the P&R has real potential in reducing driving, as can be seen by the large share of users who switched from driving from home to work. This means VKT reduction will be greater at residential locations farther away from CBD. However, the data also confirm the “abstraction effect” as a number of users shifted modes from public transport to private cars in order to use P&R. Consequently, the overall benefits of VKT reduction may be offset by more driving by these unintended users.
We are also able to ascertain the catchment area of a transit station as defined by access distance to P&R located next to the station. Such evidence is useful in devising transit-oriented policy and public relations measures to promote P&R facilities in the future. This may include targeted policies that prioritize P&R use by specific groups of drivers by requiring applicants to show proof of driving, such as receipt of parking at work. Nonetheless, it may be difficult to resolve the abstraction issues by discouraging public transport users to shift to P&R.
Three key policy implications could be conjectured from the regression results on users’ decision. First, if the P&R locations are chosen such that they serve drivers with long commute, we may be able to expect a greater retention rate. Second, if incentives are formulated to target specific user groups, such as those whose jobs do not provide parking subsidy, a higher retention rate may be achieved after the incentives end. Since the use of the P&R can produce significant benefits to the general public, the government may consider subsidizing the parking fees. However, cost-benefit analysis should be conducted prior to determining the appropriate level of subsidy. Third, the results on commuters’ travel expenses may support the call to eliminate parking subsidies by employers, such that commuters would find it cost-effective to shift to using P&R facilities.
A few issues need further examination in future research. It is unclear why retention is lower among certain groups, such as female, younger, medium-income commuters. Answering these questions can further refine incentives. We also need to examine price sensitivity across user groups. As the experimental project continues, we will be able to collect more data for future research on the users and their behaviors. For example, the free transit card incentive will be discontinued after 2016, and the retention of P&R use after users bear the full cost can be observed. Such data would allow us to calculate catchment areas of transit stations with different characteristics, such as distance from job destinations.
Acknowledgments
References
[1] Mass Rapid Transit Authority of Thailand (MRTA), “Customer satisfaction survey report: MRTA’s Park & Ride building and parking area,” MRTA, Bangkok, 2015.
[2] J. A. Mesa and F. A. Ortega, “Park-and-ride station catchment areas in Metropolitan Rapid Transit systems,” in Mathematical Methods on Optimization in Transportation Systems. M. Pursula and J. Niittymiiki, Eds. Boston: Kluwer, 2001, pp. 81-93.
[3] R. J. Spillar, “Defining the market for park-and-ride,” in Park-and-Ride Planning and Design Guidlines, 1st ed. New York: Parsons Brinckerhoff, 1997, ch. 5, sec. 4, pp. 61–65.
[4] A. Mock and J. C. Thill, “Placement of rapid transit park-and-ride facilities,” Transp. Res. Rec, vol. 2534, pp. 109-115, 2015.
[5] L. Truong and W. Marshall, “Are park-and-rides saving the environment or just saving parking costs? Case study of Denver, Colorado, light rail system,” Transp. Res. Rec, vol. 2419, pp. 109-117, 2014. [6] S. T. Islam, Z. Liu, M. Sarvi, and T. Zhu, “Exploring the mode change behavior of park-and-ride users,”
Math Probl Eng, vol. 2015, 2015.
[7] P. J. Foote, “Chicago Transit Authority weekday park-and-ride users: Choice market with ridership growth potential,” Transp. Res. Rec, vol. 1735, pp. 158-168 , 2000.
[8] W. Lam, N. Holyoak, and H. Lo, „How park-and-ride schemes can be successful in Eastern Asia,” J
Urban Plan D, vol. 127, no. 2, pp. 63-78, 2001.
[9] J. W. Flora, W. A. Stimpson, and J. R. Wroble, “Survey of existing facilities,” in Corridor Parking Facilities
for Carpoolers Volumes I-III. A. M. Voorhees and Associates, Eds. Federal Highway Administration,
Washington, D.C., 1980.
[10] City of Stockholm. (2002). Stockholm’s Action Programme against Greenhouse Gas Emissions [Online]. Available: http://www.stockholm.se/PageFiles/97459/Follow-up%202000-2005%20.pdf. [Accessed: 25 July 2016].
[11] E. Gantele and C. Begon, “The impact of car parking policies on greenhouse gas emissions,” in
Proceedings of the European Transport Conference, Leeuwenhorst Conference Centre, the Netherlands, October 6-8,
2008.
[12] G. Mingardo, “Transport and environmental effects of rail-based park and ride: Evidence from the Netherlands,” J. Transp. Geogr, vol. 30, pp. 7-16, 2013.
[13] G. Parkhurst, “The economic and modal-split impacts of shortrange park and ride schemes: Evidence from Nine UK Cities,” ESRC Transport Studies Unit, publication 1996/29, UCL, London 1996. [14] Office of Transport and Traffic Policy and Planning, 2015 Annual Traffic Speed Survey in Bangkok.
Bangkok: OTP, 2015.
[15] K. E. Stieffenhofer, M. Barton, and V. V. Gayah, “Assessing park-and-ride efficiency and user reactions to parking management strategies,” J Public Transport, vol. 19, no. 4, pp. 75-92, 2016.
[16] G. Parkhurst, “Park and ride: Could it lead to an increase in car traffic?,” Transport Policy, vol. 2, no. 1, pp. 15-23, 1995.
[17] S. Chalermpong and A. Ratanawaraha, “Land use impacts on station access behaviors of Bangkok Bus Rapid Transit passengers,” Transp. Res. Rec, vol. 2533, pp. 50-59, 2015.
[18] C. Chullabodhi and C. Chalermpong, “Transit catchment area of Bangkok Mass Transit System and Mass Rapid Transit Station,” in The 9th National Transport Conference, Bangkok, Thailand, 2014.
[19] R. Maprasert and V. A. Santidhananon, “ Study of park and ride facility at Ladprao MRT Station,” (in Thai) Senior Project Report, Dept. of Civil Engineering, CU, Bangkok, Thailand, 2016.
[20] A. Ratanawaraha, C. Chalermpong, and C. Chullabodhi, “Walking distance of commuters after modal shift to rail transit in Bangkok,” J. East Asia Soc. Transp. Stud., vol. 11, pp. 1467-1478, 2015.
[21] M. Ben-Akiva and S. R. Lerman, “Tests and practical issues in developing discrete choice models,” in